The aim of this paper is to apply the methodology developed by Evripidou et al. (2022) to assess the co-explosivity between housing credit and housing prices in the Spanish economy from 1971 to 2024.
First, the authors use recursive unit root tests for explosiveness, proposed by Phillips et al. (2011) and Phillips et al. (2015a), to investigate whether nominal house prices (NHP) and housing credit exhibit bubble-like behavior at any point in the time series. Second, they apply the methodology of Evripidou et al. (2022) to assess co-explosiveness between housing credit and house prices. Thus, this study not only analyzes the univariate explosiveness of these series but also explores their interdependence. A (stable) asynchronous coexplosiveness would permit the construction of early warning indicators for upcoming explosiveness in housing markets.
First, to examine explosiveness in individual series, they use recursive unit root tests proposed by Phillips et al. (2011) and Phillips et al. (2015a) to assess whether NHP and housing credit exhibit bubble-like behavior. These tests identify periods of exuberance in 1988–1991 and 1992–1993 (coinciding with economic expansion before the 1992 Barcelona Olympics and Seville Universal Exposition) and 2001–2008 (preceding the subprime mortgage crisis and the “Spanish housing boom”). Second, regarding co-explosivity, the KPSS test for co-explosivity reveals no co-explosivity when house prices lead housing credit, as the null hypothesis of stationarity is rejected across all lags (−5 to +5 years). However, a significant co-explosivity pattern emerges when housing credit leads house prices, with a stable bubble relationship observed for leads of 2–5 years. The strongest relationship occurs at a 4-year lead, indicating that credit dynamics precede and drive housing price bubbles. This finding is central to their analysis, highlighting the critical role of credit in triggering housing price bubbles. It underscores the importance of addressing the leading effect of credit, which is essential for effective policy and market interventions aimed at mitigating real estate bubbles. The empirical evidence, particularly at the 4-year lead, reveals a feedback mechanism in which credit growth drives subsequent price increases. Given that their econometric analysis identifies credit dynamics as a key driver of housing bubbles, policy interventions should encompass macroprudential and microprudential measures, alongside fiscal and structural policies.
This paper examines the interaction between housing prices and housing credit in Spain from 1971 to 2024, contributing to the empirical literature on the Spanish economy in two ways. First, they use recursive unit root tests for explosiveness, proposed by Phillips et al. (2011) and Phillips et al. (2015a), to investigate whether NHP and housing credit exhibit bubble-like behavior at any point in the time series. Second, they apply the methodology of Evripidou et al. (2022) to assess co-explosiveness between housing credit and house prices. Thus, this study not only analyzes the univariate explosiveness of these series but also explores their interdependence. A (stable) asynchronous coexplosiveness would permit the construction of early warning indicators for upcoming explosiveness in housing markets.
1. Introduction
The global financial crisis of 2008–2009 thrust the interplay between housing prices and household borrowing into the forefront of economic policy debates. Originating from the collapse of an unanticipated housing bubble, the crisis followed a synchronized house price boom in the USA and several European countries, including Spain, Ireland, the UK, the Netherlands and Denmark, from 2003 to 2007. These booms, peaking in 2007, were fueled by rapid expansions of mortgage lending and securitization. Housing booms are widely recognized for their spillovers to non-housing sectors and their positive contributions to economic growth, making their transmission channels a critical focus for economists and policymakers (e.g. Jordà et al., 2015).
Financial crises often lead to persistent or permanent output losses (see, e.g. Cerra and Saxena, 2008; Baron et al., 2021). International evidence suggests that debt booms increase the risk of financial crises and the subsequent output losses outweigh the growth benefits of debt-fueled booms that avoid crises. Spanish experience is particularly relevant for studying the impact of housing credit on economic growth, given its pronounced real estate boom from 1995 to 2007 [1].
The housing market has been a cornerstone of the Spanish economy over recent decades. Much of the literature on the Spanish housing market examines the determinants of house prices and the housing price bubble that persisted until 2007 [see, e.g. Estrada et al., 2009; Gimeno and Martínez-Carrascal, 2010; Rodríguez and Bustillo, 2010; González and Ortega, 2013; Neal and García-Iglesias, 2013; Arrazola et al., 2015]. More recent studies focus on the evolution of house prices since the 2014 recovery (see, e.g. Alves and Urtasun, 2019; Bank of Spain, 2024; López-Rodríguez and de los Llanos Matea, 2019). Other research explores the role of banks and credit supply in transmitting the housing boom, using bank-, firm- and loan-level microdata. For instance, Jiménez et al. (2020) argue that the Spanish housing boom enabled banks to expand credit supply through mortgage securitization of real estate assets. Similarly, Martín et al. (2021) document that the housing boom in Spain affected the rest of the economy by increasing banks’ net worth and expanding credit supply. They show that rising house prices increased bank net worth, initially crowding out credit to non-housing sectors but later expanding it across all industries.
This study makes three principal contributions to the literature on housing markets and financial stability, particularly in the Spanish context. First, it introduces a novel methodological approach by combining the recursive explosiveness tests developed by Phillips et al. (2015a, 2015b) with the co-explosivity framework proposed by Evripidou et al. (2022). This integrated methodology represents a first-time application to the Spanish economy, substantially enhancing the value added of our analysis by providing a more robust detection of bubble dynamics and their interdependencies between housing prices and housing credit.
Second, on the empirical front, the study uncovers compelling evidence of the leading role played by housing credit in driving house price dynamics. Our results reveal the strongest co-explosive relationship at a 4-year lead, demonstrating that credit expansion precedes and fuels housing price bubbles. This finding offers new insights into the causal mechanisms underlying real estate cycles in Spain, extending previous studies by quantifying the temporal precedence of credit over prices.
Finally, the analysis has significant implications for the design of macroprudential policies. A (stable) asynchronous coexplosiveness would permit the construction of early warning indicators for upcoming explosiveness in housing markets. It highlights the critical need to address the leading effect of credit in preventing and mitigating real estate bubbles. Given that our econometric results identify credit dynamics as a primary driver of housing bubbles, effective policy interventions should integrate macroprudential and microprudential tools, complemented by fiscal and structural measures, to enhance financial stability and curb excessive risk-taking in the housing sector.
The rest of the paper is organized as follows. Section 2 discusses the nexus between housing prices and housing credit. Section 3 presents the methodology. Section 4 reports the empirical results. Section 5 concludes.
2. Theoretical framework
Economic theory suggests a bidirectional relationship between housing prices and credit availability. First, the availability of bank credit stimulates housing demand and, consequently, prices due to lower lending rates, favorable economic expectations and relaxed household liquidity constraints (Oikarinen, 2009). Banks assess borrowers based on their creditworthiness and the collateral value of properties, which influences lending rates. Increased credit availability and affordability, coupled with short-term supply rigidity, drive up housing prices (Arestis and González, 2014). Conversely, rising housing prices can boost bank lending by increasing credit supply or demand (Goodhart and Hofmann, 2008). However, central banks regulate debt standards to ensure sustainable financing and prevent over-leveraging. As housing debt constitutes a significant portion of bank portfolios, rising property prices strengthen bank balance sheets, encouraging further lending. In contrast, a housing price crash heightens default risks, prompting banks to curtail lending to the housing sector.
Second, the “financial accelerator mechanism” explains the two-way causality between housing market volatility and financial sector stability (Bernanke and Gertler, 1995; Bernanke et al., 1999). Higher housing prices increase the credit required for home purchases, exerting upward pressure on credit demand. Additionally, as most housing loans are secured by the property itself, rising prices enhance collateral values, boosting households’ net worth and borrowing capacity. Simultaneously, higher property valuations reduce the riskiness of bank assets by lowering default risks, incentivizing banks to expand lending. This banking sector activity amplifies asset price appreciation through credit expansion (Herring and Wachter, 2003; Pavlov and Wachter, 2006).
Moreover, housing prices influence household borrowing through wealth effects. Consistent with this theory, credit cycles have aligned with housing price cycles across numerous countries (e.g. IMF, 2000; BIS, 2001; Goodhart and Hofmann, 2007; Albuquerque et al., 2025; Höynck et al., 2025).
The empirical literature investigates whether bank lending Granger-causes housing price increases due to relaxed lending standards during asset price surges or whether rising housing prices drive lending expansion (Anundsen and Jansen, 2013; Hofmann, 2004). However, findings remain inconclusive (see Anundsen and Jansen, 2013, for a comprehensive review).
3. Methodology
3.1 Testing for explosiveness in the individual series
3.1.1 The bubble model.
Kurozumi et al. (2023) analyze a time series process generated by a data-generating process (DGP) that incorporates one explosive regime followed by a collapsing regime, as follows:
where , , . The process typically follows a unit root process but may exhibit a bubble at , characterized by an explosive AR(1) coefficient . This is followed by a collapsing regime from to , during which the process behaves as a stationary process. This collapse represents a return to normal time series behavior. The parameter determines the magnitude of the bubbles’ collapse, with the duration spanning the period from to .
In the presence of heteroskedasticity, the volatility of the innovations, in (3), may be non-stationary. In contrast, the conventional homoskedasticity assumption, as as used by Phillips et al. (2011, PWY henceforth) and Phillips, et al. (2015a, 2015b, PSY henceforth), among others, implies that for all t.
Alternatively, the time series process can be expressed as:
or
The null hypothesis H0 posits that no bubble is present in the series and follows a unit root process throughout the sample period, i.e. in (4) [2]. The alternative hypothesis H1 posits that a bubble is present in the series, corresponding to the case where in (4) is not stable at 1 and the model is given by (1)–(3) with .
3.1.2 Tests for explosive autoregression in the individual series.
PWY and PSY developed tests for detecting explosive bubbles using recursive right-tailed Dickey–Fuller-type unit root tests, which identify evidence of explosive behavior in a time series .
PWY proposed a test based on the maximum of augmented Dickey–Fuller (ADF) test statistics computed over subsamples. Their testing procedure is derived from the regression model:
for to .
The parameter of interest is . The null hypothesis of a unit root, , is tested against the right-tailed alternative, , at least in some subsample. The model is estimated by ordinary least squares and the t-statistics associated with the estimated is referred to as ADF statistic.
The supremum ADF (SADF) test is defined as the supremum of the ADF statistic from forward recursive regressions:
where the right-tail is the rejection region. This test can be used for testing for a unit root against explosive behavior in some subsample. It is a test that aims to detect the existence of at least one speculative bubble in the time series.
PSY proposed a generalized version of the (SADF) test of PWY. Their generalized supremum ADF (GSADF) test is as follows:
The statistic (8) is used to test the null of a unit root against the alternative of recurrent explosive behavior, as the statistic (7). It is a test that allows for the detection of multiple bubbles and collapses throughout the series.
Note that the SADF is a special case of GSADF test, obtained by setting and [3].
3.1.3 Identification of explosive periods.
To identify the onset and conclusion of explosive behavior, we apply the backward (BSADF)-expanding window test proposed by PSY. It performs ADF-tests using a backward-expanding sample with a fixed endpoint and varying starting points , defined as follows:
The estimator of the initiation date of explosiveness, , is the first point at which the test statistic exceeds its wild bootstrapped critical value sequence, . The termination date estimator, , is the first point at which the test statistic falls below its critical value. These are formally defined as follows:
The BSADF test serves as our primary methodology, enabling precise identification and date-stamping of explosive bubble episodes in the time series.
3.2 The co-explosive model.
We use the recent approach of Evripidou et al. (2022), who use a KPSS test to evaluate co-explosiveness in a bivariate setting. Co-explosiveness occurs when two or more time series exhibit a shared explosive process. Three scenarios – synchronous co-explosiveness, asynchronous co-explosiveness (with a lead/lag structure) and no-co-explosiveness – can significantly impact financial market stakeholders and economic policymakers.
Consider two observed time series and , where includes an explosive episode. The DGP for the temporarily explosive time series is defined as follows:
where is a constant, is a temporarily explosive time series with i as an integer (positive, negative or zero) capturing potential lead-lag dynamics, being a latent, unobserved process and is a mean zero I(0) error term. The co-explosive model allows for correlation among , and . Under this DGP, exhibits explosive dynamics driven by if and , by if and or both and if and .
Regarding co-explosiveness in (11), if and , then and are co-explosive, meaning the linear combination is . This implies stationarity across all sub-regimes of and , indicating that co-explosiveness also entails cointegration in the regimes and a stationary linear combination in the explosive regimes.
Co-explosiveness can manifest as follows:
Contemporaneous: if , the explosive behavior occurs simultaneously.
Lagged: if , the explosive episode in precedes that in by i periods, with the explosive dynamics in propagating to after the lag.
Leading: if , the explosive episode in precedes that in by i periods, establishing a co-explosive relationship where leads .
No co-explosiveness: if and , and are no-co-explosive.
3.2.1 Testing for co-explosivity.
When testing for co-explosive behavior between the observed series, the hypotheses for model (11) are formulated as follows:
Under the null hypothesis H0, and are co-explosive, such that the linear is . Under the alternative hypothesis H1, the processes are not co-explosive.
To test for co-explosivity, Evripidou et al. (2022) propose a modified KPSS-type statistic:
where T is the number of observations, are residuals obtained from regressing on a constant and and the estimate variance . To account for serial correlation in the residuals, is replaced with the Newey and West (1994) long-run variance estimate. A KPSS statistic exceeding its wild-bootstrapped critical value leads to rejection of the null hypothesis of co-explosiveness.
3.2.2 Identifying the timing of explosive regime migration.
Under the null hypothesis of co-explosiveness, the lag/lead parameter i is typically unknown in practical applications. Evripidou et al. (2022) propose selecting i from a predefined range of values J, where i is chosen to minimize the residual variance () from the regression of on and a constant:
The value of is used to compute the test statistic (13) and its corresponding wild-bootstrapped critical value, both essential for the co-explosiveness test. The range J typically includes negative lags (when leads ) and positive lags (when leads ), allowing for bidirectional relationships.
4. Empirical application
4.1 Data
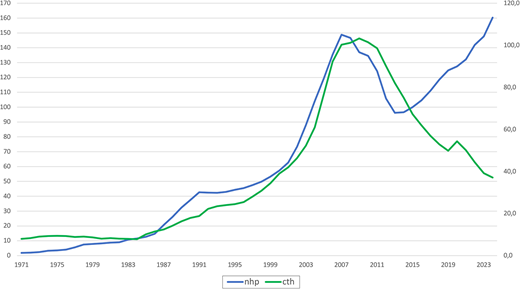
We use time-series data on the Spanish economy from 1971 to 2024, a 54-year sample period that is well-suited for the econometric approach used in this study. [4] The data set includes the following variables: credit to housing (), nominal GDP (), credit housing to GDP ratio (), nominal house price index () and real house price index (). CTH is sourced from Jordà et al. (2017) for 1971–1991, based on mortgage loans to the non-financial private sector and from the Bank of Spain (2025a; Table 4.12, column 15) for 1992–2024, reflecting credit to construction and housing. Nominal GDP is obtained from Prados de la Escosura, 2017 (Table 1) and Bank of Spain (2025a; Table 11.1, column 12), while nominal and RHP indices are sourced from OECD (2025). Figure 1 illustrates the evolution of the NHP index and the credit housing to GDP ratio .
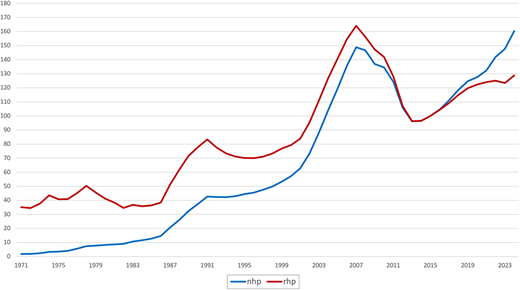
The data reveal three distinct house price cycles in recent decades. First, from 1995 to 2007, Spain experienced a pronounced housing boom, with NHP, RHP and the credit housing to GDP ratio rising by 235.1%, 133.8% and 310.4%, respectively (see Figure 2). [5] During this period, the Spanish economy grew robustly, with real GDP increasing by an average of 3.7% annually from 1994 to 2007. This economic expansion coincided with a credit boom, primarily driven by housing-related credit, which includes loans to construction firms, real estate and mortgages. Domestic savings were insufficient to finance this credit surge, leading banks to tap international debt markets to channel capital inflows to firms and households. Total housing credit expanded nearly a thousandfold between 1994 and 2007 and its share of total credit rose from 39.1% in 1994 to 62.4% in 2007. [6] The accumulation of non-performing loans on bank balance sheets triggered a severe banking crisis, as documented by Baudino et al. (2023) and Bank of Spain (2017, 2019).
Second, the housing and economic booms collapsed between 2007 and 2013, marked by declines in NHP, RHP and the credit housing to GDP ratio of 35.1%, 41.3% and 18.2%, respectively. Third, from 2013 to 2023, nominal and RHP rebounded by 66.6% and 33.6%, respectively, with NHP reaching their 2007 peak, potentially signaling a new bubble. Sustained housing demand, driven by lower interest rates, robust job creation and strong foreign demand, has outpaced the supply of new housing, which, despite recent expansion, remains insufficient. This demand-supply imbalance continues to drive house price escalation, as noted by the Bank of Spain (2024). Finally, from 2009 to 2024, the credit housing to GDP ratio plummeted by 64,1%.
4.2 Tests for explosive autoregression in the individual series.
Since co-explosiveness requires explosive autoregressive regimes in the individual series, we first test for such behavior in the NHP index and the credit housing to GDP ratio (). We use the recursive unit root tests proposed by PWY and PSY to detect bubble-like behavior in these series, specifically using SADF, GSADF and BSADF tests.
The SADF test identifies a single speculative bubble by applying the ADF test recursively with a fixed starting point and expanding endpoints. It is well-suited for detecting a single explosive episode. In contrast, the GSADF test extends this framework to detect multiple bubbles, even when closely spaced, making it more robust for comprehensive empirical and historical financial analyses. The BSADF test further generalizes the approach by varying both the starting and ending points of the estimation window, enabling precise identification and dating of multiple exuberance episodes via the datestamping procedure, which enhances historical diagnostics and empirical reliability.
For our empirical analysis, the minimum window size, , defines the shortest subsample for recursive right-tailed ADF tests in the SADF and GSADF procedures. Following PWY and PSY, we set as a fraction of the total sample size T to balance statistical power and the number of estimable subsamples, calculated as follows:
where (commonly ) is a pre-specified proportion and is the floor operator. A minimum of 5 observations ensures reliable estimation in small samples. For our sample, , corresponding to an 11-year minimum subsample length. The lag order p for the ADF test is selected automatically using the Bayesian Information Criterion, as recommended by PWY and critical values for the SADF and GSADF statistics are generated via Monte Carlo simulations with 500 replications, providing significance levels at 10%, 5% and 1%.
Table 1 reports the SADF and GSADF test results for and , along with their right-tail critical values for the 1971–2024 sample. For , the SADF test fails to reject the unit root null hypothesis at the 95% significance level, indicating no evidence of a single explosive episode. However, the GSADF statistic exceeds its critical value, rejecting the null in favor of multiple explosive periods, suggesting robust evidence of recurrent bubbles in NHP. The GSADF test’s superior statistical power makes it more reliable for detecting multiple bubbles.
For , both the SADF and GSADF tests reject the unit root null hypothesis at the 95% significance level, providing evidence of at least one bubble and multiple explosive periods, respectively, in the credit housing to GDP ratio.
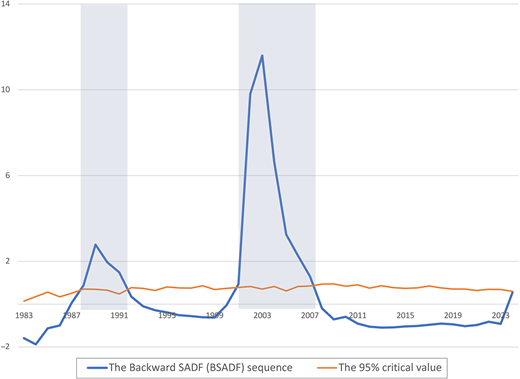
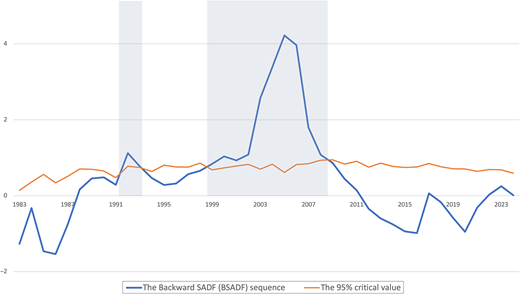
Figures 3 and 4 illustrate the detected bubble episodes for both series, plotting the BSADF statistic sequence against the 95% critical value sequence (derived from 500 Monte Carlo replications). Shaded areas show the periods of significant explosivity.
For , Figure 3 identifies exuberance periods from 1988 to 1991 (coinciding with economic expansion before the 1992 Barcelona Olympics and Seville Universal Exposition) and from 2001 to 2007 (preceding the subprime mortgage crisis and coinciding with the “Spanish housing boom”). For , Figure 4 detects two exuberance episodes from 1992 to 1993 after the economic expansion, the 1992 Barcelona Olympics and the Seville Universal Exposition and from 1999 to 2008 preceding the subprime mortgage crisis and coinciding with the “Spanish housing boom”. These findings reinforce the interconnected dynamics of housing prices and housing credit.
4.3 Evidence of co-explosivity
To examine co-explosive behavior between the series of housing credit and housing prices in Spain (1971–2024), we applied the methodology proposed by Evripidou et al. (2022). Their KPSS-based test enables the assessment of both simultaneous and lead/lag co-explosivity. We analyzed the relationship in both directions: housing prices leading housing credit and housing credit leading housing prices.
For our empirical analysis, we applied the KPSS test to the linear combination of the series, accounting for residual autocorrelation using a Bartlett kernel with a lag length selected by the “long” method , following the recommendations of Kwiatkowski et al. (1992) and Newey and West (1994).
Lags and leads i (ranging from −5 to +5 years) were computed by temporally shifting the series, aligning housing credit at time t with housing prices at for positive lags (credit leading prices) and prices at for negative lags (prices leading credit), following Evripidou et al. (2022). Robust critical values were obtained via wild bootstrap with 1,000 iterations, as proposed by Hafner and Herwartz (2009), ensuring robustness to heteroskedasticity and residual autocorrelation. Additionally, lag selection was further supported by Schwert (1989), who advocates for -type rules in stationarity tests.
Table 2 presents critical values at the 5% significance level, derived from wild bootstrap with 5,000 Monte Carlo replications, compared to the modified KPSS-type statistic for co-explosivity (S) calculated as (13). The null hypothesis H0 posits that the linear combination is stationary, indicating co-explosivity and a persistent bubble relationship between the series [7]. Conversely, the alternative hypothesis H1 suggests non-stationarity, implying no co-explosivity and no stable long-term bubble relationship, even if the series are individually explosive. Table 2 also reports residual variance estimates (). The optimal delay () is identified by minimizing the residual variance in the regression, with lower variances indicating stronger co-movement.
First, when housing prices precede housing credit, the KPSS test statistics consistently exceed the critical values across all lags and leads, leading to the rejection of H0. This outcome indicates non-stationarity of the linear combination, suggesting no co-explosivity in this direction.
Second, for housing credit leading housing prices, the results are mixed. For lags from −5 to −1 years, as well as at lag 0, the statistics exceed the critical values, resulting in the rejection of H0. However, for leads of +2 to +5 years, the statistics fall below the critical values, leading to the non-rejection of H0. In these cases, housing credit leads housing prices, with co-explosivity observed within this range, indicating a stable long-term bubble relationship driven by housing credit. The optimal lead, determined by the minimum residual variance (see Table 2), is suggesting that explosive behavior in housing credit anticipates explosive behavior in housing prices by 4 years.
Furthermore, the long-run variance is estimated using the Newey and West (1994)HAC estimator with Bartlett kernel and automatic lag selection. While this is a widely used approach, it is known to be susceptible to prewhitening bias and size distortions in finite samples (Sul, Phillips and Choi, 2005). Recent contributions, such as the self-normalized KPSS tests developed by Peng-Zhou and Song (2026), offer potential improvements in power and robustness against various forms of persistence and heteroskedasticity. Although we rely on the conventional Newey and West (1994) estimator for comparability with the existing literature, future extensions of this analysis could incorporate these self-normalized procedures to strengthen the inference on co-explosive dynamics.
4.4 Policy recommendations
Based on our empirical finding that housing credit dynamics precede house price bubbles in Spain by approximately four years, this section outlines a comprehensive set of policy interventions aimed at mitigating credit-driven “co-bubbles.” The recommendations are organized around four complementary pillars – macroprudential, microprudential, fiscal and structural policies – highlighting the importance of timely and coordinated action to contain systemic risks in the real estate sector. The overarching objective is to restrain excessive leverage and unsustainable credit expansion while simultaneously addressing structural supply constraints, thereby enhancing financial stability and fostering a more sustainable housing market.
4.4.1 Macroprudential policies.
Macroprudential instruments play a central role in preventing the accumulation of systemic risks that can amplify housing and credit cycles. Given the leading role of housing credit identified in our analysis, policies that directly target credit growth and leverage are particularly well suited to mitigating emerging co-bubbles at an early stage.
Among these tools, loan-to-value (LTV) limits restrict the maximum proportion of a property’s value that can be financed through mortgage borrowing. By lowering borrower leverage, LTV caps reduce the volume of credit available for housing purchases and make price increases more dependent on households’ own resources. In doing so, they enhance the resilience of both borrowers and financial institutions to adverse price corrections.
Similarly, debt-service-to-income (DSTI) or loan-to-income (LTI) limits constrain the share of income that households can devote to mortgage repayments or the maximum income multiple that can be borrowed. These measures ensure that borrowers maintain sufficient repayment capacity, reducing default risks in the face of interest rate increases or income shocks and dampening excessive credit-fueled demand for housing.
Capital-based tools further complement borrower-based measures. Countercyclical capital buffers (CCyB) require banks to accumulate additional capital during periods of rapid credit expansion, increasing the resilience of the banking system should the bubble burst and discouraging excessive lending by raising its marginal cost. In the same vein, sectoral capital surcharges on real estate exposures penalize excessive concentration of risk in housing-related lending and limit banks’ incentives to disproportionately expand mortgage credit during boom phases.
Finally, restrictions on wholesale funding reliance or maturity mismatches can reduce vulnerabilities arising from the financing of long-term mortgage assets with short-term funding. By strengthening banks’ funding structures, these measures lower the probability that housing market corrections translate into broader financial instability.
4.4.2 Microprudential policies.
While macroprudential measures target system-wide risks, microprudential policies remain essential for safeguarding the soundness of individual financial institutions. Standard capital and liquidity requirements, together with close supervisory scrutiny of mortgage underwriting standards and asset quality, complement macroprudential tools by ensuring that banks internalize risks at the institutional level. Although narrower in scope, these measures reinforce the overall effectiveness of the policy framework.
4.4.3 Fiscal policies.
Fiscal instruments can directly influence investment incentives and help moderate speculative behavior in housing markets. Property taxes and capital gains taxes, particularly when adjusted countercyclically, can reduce the attractiveness of speculative real estate investment by lowering the expected returns from rapid price appreciation. Similarly, removing or scaling back fiscal incentives for nonproductive housing investment, such as tax deductions favoring secondary residences, can redirect capital toward more productive uses and cool excess demand.
In addition, financial or real estate transaction taxes increase the cost of frequent buying and selling, thereby discouraging short-term speculative activity and contributing to smoother price dynamics over the housing cycle.
4.4.4 Structural and supply-side policies.
While demand-side measures are crucial in the short to medium run, addressing the structural roots of housing bubbles requires policies that enhance supply responsiveness. Expanding housing supply through streamlined permitting processes, increased availability of buildable land and investment in supporting infrastructure can mitigate price pressures arising from demand surges, even in the presence of ample credit.
Complementary land market reforms aimed at reducing bureaucratic constraints and regulatory rigidities can further lower construction costs and improve market efficiency. Moreover, promoting the rental housing sector through targeted incentives and stable regulatory frameworks provides a viable alternative to homeownership, alleviating pressure on house prices and reducing incentives for speculative purchases.
4.4.5 Timing, calibration and coordination.
The effectiveness of the proposed policy mix critically depends on appropriate timing and calibration. Interventions should be implemented when clear signs of excessive credit growth and housing market overheating emerge, while avoiding overly restrictive measures that could unduly hamper economic activity or trigger abrupt market corrections. Furthermore, close coordination among macroprudential authorities, financial supervisors and fiscal policymakers is essential, as the combined impact of these instruments is substantially greater than the sum of their individual effects.
In light of our finding that housing credit leads house prices by approximately four years, policies aimed at curbing excessive credit supply and leverage – particularly LTV and DSTI/LTI limits and CCyB – emerge as the most direct and effective tools for mitigating housing credit co-bubbles before they reach their peak.
5. Conclusions
This study is the first to apply the methodology of Evripidou et al. (2022) to investigate co-explosivity in the Spanish housing market, using annual data from 1971 to 2024. We use this methodology to examine co-explosivity between housing credit and house prices, analyzing both the univariate explosiveness of these series and their interdependence. The KPSS-based test developed by Evripidou et al. (2022) enables us to assess simultaneous and lead/lag co-explosivity behaviors.
First, to examine explosiveness in individual series, we use recursive unit root tests proposed by Phillips et al. (2011) and Phillips et al. (2015a) to assess whether NHP and housing credit exhibit bubble-like behavior. These tests identify periods of exuberance in 1988–1991 and 1992–1993 (coinciding with economic expansion before the 1992 Barcelona Olympics and Seville Universal Exposition) and 2001–2008 (preceding the subprime mortgage crisis and the “Spanish housing boom”).
Second, regarding co-explosivity, the KPSS test for co-explosivity reveals no co-explosivity when house prices lead housing credit, which as the null hypothesis of stationarity is rejected across all lags (−5 to +5 years). However, a significant co-explosivity pattern emerges when housing credit leads house prices, with a stable bubble relationship observed for leads of 2–5 years. The strongest relationship occurs at a 4-year lead, indicating that credit dynamics precede and drive housing price bubbles.
This finding is central to our analysis, highlighting the critical role of credit in triggering housing price bubbles. It underscores the importance of addressing the leading effect of credit is essential for effective policy and market interventions aimed at mitigating real estate bubbles. The empirical evidence, particularly at the 4-year lead, reveals a feedback mechanism in which credit growth drives subsequent price increases.
Given that our econometric analysis identifies credit dynamics as a key driver of housing bubbles, policy interventions should encompass macroprudential and microprudential measures, alongside fiscal and structural policies.
Regarding macroprudential policies, Royal Decree-Law 22/2018 and Royal Decree-Law 102/2019 provide for the Bank of Spain to set limits on the standards applied by banks in new lending to households. For instance, for mortgages, the Banco de España could set limits on loan-to-price, LTI and loan service-to-income ratios and establish the maximum terms for new mortgages, among other measures (Bank of Spain, 2025b).
Notes
On the origins of Spanish housing boom, see Jimeno and Santos (2014) and Santos (2017).
The null hypothesis can be expressed using (2) in several ways such that , , or .
Phillips and Shi (2018) showed that, while the GSADF procedure is designed to detect the bubble behavior, it can also identify crisis periods, as further explored in Phillips and Shi (2019, 2020). These periods are frequently observed in empirical applications.
Data are available upon request from the authors.
Data from BIS (2025).
Non-housing credit was influenced by factors such as declining interest rates following the euro’s introduction and population growth.
The KPSS statistic can be viewed as a generalization of the statistic proposed by Nabeya and Tanaka (1988). Therefore, rejection of the null hypothesis implies that the analyzed series is not stationary around a fixed deterministic component.
Erratum: It has come to the attention of the publisher that the article, Esteve, V., Blanco-Arroyo, O., Prats, M.A. (2026), “Testing for co-explosive behavior between mortgages loans and house prices in the Spanish economy”, Applied Economic Analysis, Vol. 34 No. 100 pp. 61–77, Link to Testing for co-explosive behavior between mortgages loans and house prices in the Spanish economyLink to the cited article, omitted part of the funding information.
The complete funding information should read “Omar Blanco-Arroyo acknowledges financial support of the Generalitat Valenciana (grant CIGE/2023/039). Vicente Esteve acknowledges the financial support from the Generalitat Valenciana through the project CIPROM/2022/50. Maria A. Prats acknowledges financial support of the Dirección General de Universidades e Investigación de la Consejería de Medio Ambiente, Universidades, Investigación y Mar Menor de la Comunidad Autónoma de la Región de Murcia (programa Movind Minds-CMN, R-376/2025)”
This error was introduced during the article publication process, for which the publisher apologises.