This study examines asymmetric associations between economic diversification, bank-based financial development and per-capita CO2 emissions in Saudi Arabia, a hydrocarbon-dependent and electricity-intensive economy undergoing structural transformation under Vision 2030.
Using annual data for 1995–2020, converted to quarterly observations through quadratic-match average interpolation, the study estimates a nonlinear autoregressive distributed lag (NARDL) model. Economic diversification is measured by the Economic Complexity Index and bank-based financial development by private-sector bank credit. The model controls for electricity consumption, GDP per capita, industrial activity, urbanization and trade openness. Positive and negative changes in diversification and bank-based financial development are decomposed to estimate distinct short- and long-run associations with CO2 emissions.
Positive diversification changes are associated with lower CO2 emissions in the short run but higher emissions in the long run. Positive bank-based financial-development changes are associated with higher emissions across both horizons. Negative changes in both variables display distinct short- and long-run adjustment patterns. Electricity consumption and trade openness are positively associated with emissions, urbanization is negatively associated with emissions and GDP per capita and industrial activity are statistically insignificant.
The study jointly examines economic complexity and bank-based credit in a Saudi Arabian NARDL framework. As quarterly observations are interpolated from annual data, short-run estimates require cautious interpretation. The findings represent conditional asymmetric associations rather than causal effects or direct evidence of sectoral, technological, or policy mechanisms.
1. Introduction
Economic diversification is a primary policy goal in resource-dependent economies, as it mitigates vulnerability to commodity price fluctuations, expands the production base and alters the environmental impacts of growth (Ferraz, Falguera, Mariano, & Hartmann, 2021; Sharma, Sinha, & Kautish, 2021). In Saudi Arabia, this issue is particularly relevant because the country has historically depended on oil revenues for the majority of its fiscal receipts and export earnings, and diversification has proceeded slowly despite successive development plans (Albassam, 2015; Banafea & Ibnrubbian, 2018; Bokhari, 2017). The transition away from this dependence is now being pursued under Vision 2030, which commits Saudi Arabia to structural transformation across non-oil sectors and to broader sustainability objectives (Al Naimi, 2022; Al-Sarihi, 2019). The environmental implications of this transition, however, are not straightforward, since diversification may either lower emissions by expanding less carbon-intensive activities or increase them if it stimulates energy-intensive production and transport demand (Jiang et al., 2022; Sharma et al., 2021). Recent evidence for Gulf petroleum economies similarly shows that the emissions impact of diversification depends on which sectors expand and how energy-intensive they are (AlSabbagh, 2025)
This process is closely linked to bank-based financial development. A deeper financial system can support diversification by reallocating capital toward new sectors, easing financing constraints and promoting private investment (King & Levine, 1993; Bloch & Tang, 2003; Durusu-Ciftci, Ispir, & Yetkiner, 2017). At the same time, financial expansion may intensify environmental pressure if credit growth disproportionately supports pollution-intensive activities rather than cleaner technologies, leading to increased greenhouse gas emissions and degradation of natural resources (Ahmad, Khan, Rahman, & Khan, 2018; Lahiani, 2020). Recent work for Saudi Arabia and other economies also finds that financial deepening can intensify environmental degradation when it is not accompanied by green allocation mechanisms and regulatory safeguards (Tahir, Hayat, & Burki, 2021; Wang, Dong, & Taghizadeh-Hesary, 2024). The net association between financial development and carbon emissions is therefore an empirical question (Neog & Yadava, 2020; Kibria, Jahan, & Mawa, 2021; Khan et al., 2021), and its sign may depend on whether the economy is responding to positive or negative shocks—a distinction that linear specifications are unable to capture (Majeed, Samreen, Tauqir, & Mazhar, 2020; Raggad, 2020).
Economic diversification and bank-based financial development may affect CO2 emissions through scale, composition and technique effects. Diversification can increase emissions by expanding energy-intensive production, infrastructure and transport but may reduce them when structural change favours less carbon-intensive activities. Similarly, bank credit may increase emissions when it finances polluting investment or reduce them when it supports clean technology, energy efficiency and lower-carbon production. Their net association is therefore theoretically ambiguous and may vary across adjustment horizons.
The Environmental Kuznets Curve (EKC) provides a conceptual reference: emissions may initially rise with economic expansion before composition and technique effects reduce them at later development stages. The study does not test the EKC formally because the model excludes squared income and GDP per capita is insignificant. Instead, the EKC helps explain why diversification and financial deepening may be associated with either higher or lower emissions under differing energy, regulatory and structural conditions. This perspective is relevant to Saudi Arabia's simultaneous decarbonization, financial reform and diversification under Vision 2030 (Mar’i, Seraj, & Tursoy, 2023).
Existing research commonly treats the finance–environment and diversification–environment relationships separately and assumes symmetric adjustment (Lahiani, 2020; Jiang et al., 2022; Kibria et al., 2021). Yet positive and negative shocks may have distinct emissions associations (Shin, Yu, & Greenwood-Nimmo, 2014), particularly in Saudi Arabia, where Vision 2030 links financial deepening, productive transformation and decarbonization (Al-Sarihi, 2019; Al Naimi, 2022). Although nonlinear finance–emissions relationships have been examined for Saudi Arabia (Raggad, 2020), and diversification effects are known to depend on structural conditions (Jiang et al., 2022; Ferraz et al., 2021), joint asymmetric evidence remains limited.
The study investigates asymmetric dynamic associations between economic diversification, bank-based financial development and per-capita CO2 emissions in Saudi Arabia from 1995 to 2020. Following Shin et al. (2014), it applies NARDL with energy consumption, GDP per capita, industrial activity, urbanization and trade openness as controls. Wald tests and dynamic multiplier analysis distinguish positive from negative shocks and short-run from long-run adjustment.
Diversification is measured using the Economic Complexity Index (ECI), which reflects export diversity, ubiquity and productive sophistication (Hidalgo & Hausmann, 2009). Unlike concentration and structural-share indicators used in earlier Saudi studies (Albassam, 2015; Guendouz & Ouassaf, 2020), ECI better aligns with Vision 2030's emphasis on productive upgrading and knowledge-intensive growth. However, it remains a partial proxy because it does not capture non-oil sector size, employment composition, or domestic structural balance (Khaliq & Mamkhezri, 2023a).
This study contributes by jointly modelling asymmetric diversification– and bank-credit–emissions associations in a GCC economy, rather than treating these channels separately (Raggad, 2020; Lahiani, 2020; Jiang et al., 2022). It also applies ECI as a diversification proxy and multiplier analysis to distinguish short- and long-run adjustment, providing Saudi-specific evidence on whether Vision 2030's diversification and financial-deepening objectives are environmentally complementary or potentially in tension (Ahmad et al., 2018; Majeed et al., 2020; Shin et al., 2014).
2. Literature review
The literature on diversification, financial development and CO2 emissions centers on two unresolved debates. Diversification may be associated with lower emissions when structural change shifts activity toward less carbon-intensive sectors but it may also be associated with higher emissions when productive upgrading raises energy use, infrastructure expansion and trade-related emissions (Jiang et al., 2022; Sharma et al., 2021; Ferraz et al., 2021). Financial development may improve environmental outcomes by supporting investment in cleaner technologies but it may also intensify emissions when credit is allocated to pollution-intensive activities, construction and fossil-fuel-based expansion (Ahmad et al., 2018; Lahiani, 2020; Kibria et al., 2021). Nonlinear evidence also shows that positive and negative shocks can generate different short-run and long-run environmental responses (Majeed et al., 2020; Shin et al., 2014; Raggad, 2020). The environmental implications of diversification and finance are therefore conditional on economic structure, energy composition and the direction of adjustment.
2.1 Financial development and CO2 emissions
The broader finance–environment literature reports mixed findings; however, the present study focuses specifically on the bank-based financial-development channel represented by private-sector bank credit. One strand argues that financial development can reduce environmental degradation by mobilizing savings, easing access to capital and supporting investment in cleaner technologies. Another strand reaches the opposite conclusion, showing that financial deepening may raise emissions when credit expansion primarily finances consumption, construction, transport and energy-intensive industrial activities. Empirical work using nonlinear models reinforces this ambiguity. More recent studies emphasize that the environmental effect of finance depends on the design of green financial instruments and regulatory frameworks, rather than on financial expansion alone (Andreeva, Vovchenko, Ivanova, & Kostoglodova, 2018; Wang et al., 2024). For China, Ahmad et al. (2018) and Lahiani (2020) show that financial development affects emissions asymmetrically but the estimated signs and long-run implications differ across specifications, indicating that the environmental role of finance is conditional rather than uniform.
Studies on developing economies show that positive and negative shocks to financial development can affect CO2 emissions asymmetrically, which exposes the limits of symmetric models (Neog & Yadava, 2020; Majeed et al., 2020; Kibria et al., 2021). These studies, however, treat financial development separately from broader structural transformation. For Saudi Arabia, Raggad (2020) identifies asymmetric links among financial development, energy use, growth and emissions but does not include economic diversification. Recent evidence also shows that the environmental effect of finance depends on the energy mix: fossil-fuel-based electricity increases emissions, whereas cleaner energy reduces them (Khaliq, Atique, Hina, & Bilal, 2024). In Saudi Arabia, financial development is therefore unlikely to reduce CO2 emissions unless cleaner electricity generation and green credit allocation accompany it. Tahir et al. (2021) similarly show that financial development, trade and foreign direct investment exacerbate environmental degradation in Saudi Arabia in the absence of stringent environmental policies.
Recent evidence further indicates that the finance–environment relationship depends materially on the definition of financial development. Halaç, Dermenci, Gören Yargı, and Gultekin Aslan (2025) examine 21 emerging economies over 2001–2023, construct separate banking-sector and stock-market financial-development indices using principal component analysis, and apply a panel ARDL approach. Their results indicate that financial development is associated with improved environmental quality. This finding differs from studies reporting an emissions-increasing association of financial deepening and suggests that results may vary according to whether finance is measured through bank intermediation, capital-market development, or a broader composite index. The present study therefore focuses specifically on bank claims to the private sector as a proxy for bank-based financial development, which is more appropriate to Saudi Arabia's bank-dominated financial system than a broad financial-development measure.
2.2 Economic diversification and CO2 emissions
The diversification-environment literature is equally inconclusive. Recent findings suggest that for Bahrain, a diversification strategy centered on the services sector aligns more effectively with emission reduction objectives compared with the growth of manufacturing industries with high energy consumption. This observation emphasizes the critical role of sectoral composition in diversification efforts (AlSabbagh, 2025). Some studies suggest that diversification can be associated with lower environmental pressure by reducing dependence on extractive activities, encouraging technological upgrading and broadening production toward less carbon-intensive sectors. Others reach the opposite conclusion, showing that export diversification and rising economic complexity may increase ecological pressure when structural upgrading is associated with energy-intensive production, infrastructure expansion and greater trade-related emissions. Jiang et al. (2022), Sharma et al. (2021) and Ferraz et al. (2021) collectively indicate that the environmental consequences of diversification depend on the composition of output, the carbon intensity of new sectors and the stage of development.
Montagna, Huang, Long, and Yoshida (2025) show that the complexity–emissions relationship varies across sectors and development stages. Using a Sectoral Complexity Index for 127 countries over 1995–2020, their cross-sectional quantile-regression analysis indicates that productive sophistication does not have a uniform environmental association. This evidence supports treating the Economic Complexity Index as a partial proxy for diversification, since Saudi Arabia's emissions association may depend on the energy intensity of expanding activities under Vision 2030.
When diversification is proxied by economic complexity, its environmental effects become even more ambiguous. Under asymmetric conditions, greater productive sophistication may raise CO2 emissions in both the short and long run if cleaner technologies and environmental governance do not keep pace with structural change (Khaliq & Mamkhezri, 2023b). This is directly relevant to Saudi Arabia, whose diversification strategy seeks higher productive sophistication within a carbon-intensive energy system. The literature therefore implies that positive and negative diversification shocks may have different environmental effects. Saudi-specific studies, however, mainly address diversification policy and its structural constraints rather than its direct emissions effects. While Vision 2030 is shown to have strengthened diversification efforts, formal econometric evidence on how diversification affects emissions in Saudi Arabia remains limited.
2.3 Sources of disagreement in previous studies
Mixed findings on finance–emissions and diversification–emissions relationships may reflect differences in empirical design, country context, data frequency, sample period, structural-break treatment and estimation method. These differences may generate distinct short- and long-run estimates.
Linear models impose symmetric responses to positive and negative changes, whereas NARDL models allow these changes to have distinct short- and long-run associations. Linear estimates may therefore obscure asymmetric adjustment patterns.
Proxy selection also affects estimated relationships. Broad diversification measures capture the distribution of economic activity, whereas the Economic Complexity Index reflects productive sophistication and knowledge intensity rather than domestic sectoral balance. Similarly, private-sector bank credit captures bank-based intermediation, while market-based and composite indicators represent broader financial-system development. Accordingly, this study treats the Economic Complexity Index and private-sector bank credit as focused proxies rather than comprehensive measures of diversification or the financial system.
2.4 Methodology and research gap
Saudi evidence remains limited because most studies examine diversification or financial development separately, use linear models, or rely on cross-country samples that do not reflect Saudi Arabia's hydrocarbon dependence, electricity intensity and Vision 2030 transformation (Lahiani, 2020; Jiang et al., 2022; Raggad, 2020). This study addresses this gap by using NARDL to jointly examine asymmetric short- and long-run associations of economic diversification and bank-based financial development with CO2 emissions.
Recent Saudi NARDL studies support nonlinear analysis but do not examine these variables. Moustafa and Alomran (2025) find cointegration but no conventional EKC relationship, while Benzerrouk, Abid, Ghandri, Hamed, and Ahmed Ali Adam (2026) report nonlinear emissions associations for globalization and trade openness. The present model extends this work by assessing economic complexity and bank-based credit while controlling for energy use, income, industry, urbanization and trade openness.
2.5 Conceptual framework and asymmetric expectations
Diversification and bank-based credit may affect emissions through scale, composition and technique effects. They may raise emissions by expanding energy-intensive output, infrastructure, transport, consumption and electricity demand but may reduce emissions by supporting cleaner sectors, energy efficiency, renewable energy and technological upgrading.
Because these channels may operate differently following expansions and contractions and across time horizons, NARDL decomposes diversification and bank-based financial development into positive and negative partial sums to estimate distinct short- and long-run CO2-emissions associations.
2.6 Conceptual basis of asymmetric responses:
Positive diversification or credit changes may initially increase energy demand and investment, while their longer-run emissions association may depend on sectoral composition, efficiency and technology adoption. Negative changes may temporarily reduce energy-intensive expenditure but can also constrain structural transformation and cleaner investment.
Saudi Arabia's hydrocarbon dependence, carbon-intensive electricity system, bank-dominated finance and state-led diversification provide a relevant setting for such asymmetric adjustment. These factors motivate the specification but are contextual explanations, not mechanisms directly identified by the NARDL model.
3. Empirical modeling
3.1 Data
The study covers the period 1995–2020 because this window provides the longest consistent sample for constructing a quarterly time series that combines CO2 emissions, electricity consumption, GDP per capita, trade openness, urbanization, industrial activity, bank-based financial development and the Economic Complexity Index for Saudi Arabia from the selected data sources.
This period is also appropriate for the study's objective because it captures the pre-Vision 2030 structure of the Saudi economy as well as the years immediately preceding and surrounding the launch of Vision 2030, thereby allowing the analysis to evaluate the underlying long-run and short-run dynamics of diversification, financial development and carbon emissions within a unified framework. The variables used in the analysis are defined and justified below.
Replication note: Table 1 reports annual Saudi Arabian series for 1995–2020. The data were harmonized across the World Development Indicators, Saudi Central Bank and Harvard Atlas of Economic Complexity and variables specified in the model were transformed using natural logarithms. Annual observations were converted to quarterly data for 1995Q1–2020Q4 using quadratic-match average interpolation. Because this procedure generates, rather than observes, quarterly variation, short-run estimates should be interpreted cautiously.
3.2 Methodology
Following Shin et al. (2014), the NARDL model estimates asymmetric short- and long-run associations among CO2 emissions, economic diversification and bank-based financial development. It permits positive and negative changes in the explanatory variables to have distinct coefficients and accommodates variables integrated of order zero or one, provided that none is integrated of order two.
Let denote the logarithm of CO2 emissions per capita. Let denote bank-based financial development, measured by bank claims on the private sector as a share of GDP and let denote economic diversification, measured by the Economic Complexity Index. Let represent the vector of control variables, including electricity consumption, GDP per capita, industrial activity, urbanization and trade openness.
The quarterly observations used in the NARDL estimation were generated from annual series using the quadratic-match average procedure. This temporal conversion permits the analysis of dynamic adjustment but may smooth short-run variation. The estimated short-run coefficients and dynamic multipliers should therefore be interpreted cautiously.
3.2.1 Positive and negative partial sums
The NARDL framework decomposes changes in bank-based financial development and economic diversification into cumulative positive and negative partial sums:
Here, and represent the cumulative increases in bank-based financial development and economic diversification, respectively. Conversely, and represent their cumulative decreases. The positive and negative components are estimated separately to test whether expansions and contractions are associated with CO2 emissions differently in the short run and the long run.
3.2.2 Final NARDL error-correction specification
The final NARDL error-correction specification is:
In Equation (3), is the intercept; is the error-correction coefficient; , , and are conditional level coefficients; is the vector of level coefficients for the controls; and is the error term. The coefficients , , , , and capture short-run associations. The indices , , and denote lags, whereas , , and denote the maximum lag orders.
A negative and statistically significant indicates convergence towards the estimated long-run equilibrium. The long-run coefficients are normalized multipliers, not raw conditional level coefficients. They are calculated as:
Thus, , , and are conditional error-correction level coefficients and must not be interpreted as long-run multipliers unless they have been normalized using Equations (4) and (5).
Because the negative partial sums are constructed as cumulative negative changes, and . Accordingly, the association of a negative shock with CO2 emissions must be interpreted by considering both the sign of the normalized multiplier and the negative sign of the shock. A positive coefficient on a negative partial sum implies that a negative change is associated with a reduction in CO2 emissions, whereas a negative coefficient implies that a negative change is associated with an increase in CO2 emissions.
The Augmented Dickey–Fuller (ADF), Phillips–Perron (PP) and Lee and Strazicich Lagrange multiplier (LM) tests are used to verify that no variable is integrated of order two. The Pesaran, Shin, and Smith (2001) bounds test then assesses the joint null hypothesis of no long-run relationship among the level variables in Equation (3).
Long-run asymmetry is assessed using Wald tests of and . Short-run asymmetry is tested using and . Rejection of the relevant null hypothesis indicates asymmetric adjustment.
Lag orders are selected using the Akaike information criterion within a parsimonious general-to-specific procedure. Diagnostic tests assess serial correlation, heteroskedasticity, residual normality, functional-form adequacy and parameter stability through CUSUM and CUSUMSQ tests. Dynamic multipliers illustrate adjustment from short- to long-run associations following positive and negative shocks. The estimates represent conditional asymmetric associations, not causal mechanisms.
4. Results
This section reports unit-root and bounds-test results. The NARDL framework accommodates variables integrated of order zero, I(0), or one, I(1) but not order two, I(2). After verifying the integration orders, the Pesaran et al. (2001) bounds test evaluates the null hypothesis of no level relationship. The null is rejected when the F-statistic exceeds the upper critical bound, retained when it falls below the lower bound and inconclusive when it lies between the bounds.
Stationarity was assessed using ADF, PP and Lee and Strazicich (2003) LM unit-root tests, with intercept-only and intercept-and-trend specifications. The results in Table 2 indicate that no variable is integrated of order two, satisfying the NARDL requirement. Lag orders were selected using the Akaike information criterion within a parsimonious general-to-specific procedure. Table 4 reports the NARDL estimates.
The Pesaran et al. (2001) bounds test assesses the null hypothesis of no long-run relationship among the variables in the NARDL model. As reported in Table 3, the F-statistic is 5.07. This value exceeds the upper critical bound at the 1% significance level (4.37) and also exceeds the upper bounds at the 3%, 5% and 10% levels. The null hypothesis of no level relationship is therefore rejected, providing evidence consistent with a long-run relationship among the model variables.
4.1 NARDL results
In this study, after assessing stationarity, we conduct an asymmetric cointegration analysis utilizing the NARDL model. The authors employed the approach of Shahbaz, Van Hoang, Mahalik, and Roubaud (2017) from a general to specific method to determine a convenient NARDL specification, utilizing an optimal lag length of: p = q = 3. Table 3 reports the main NARDL estimation results.
The diagnostic results in Table 4 support the retained specification. The adjusted R2Rˆ2R2 is 0.824, the Durbin–Watson statistic is 2.08, and residual diagnostics indicate no significant serial correlation, non-normality, or heteroskedasticity. These results support model adequacy but do not establish causal relationships or unobserved mechanisms.
The BDS test does not reject independently and identically distributed residuals across dimensions 2–5 and provides no independent evidence of residual nonlinearity. The NARDL specification is assessed through asymmetric partial-sum coefficients, Wald symmetry tests and dynamic multipliers.
The Wald tests reject symmetric adjustment for economic diversification and bank-based financial development in the reported short- and long-run specifications, supporting the asymmetric NARDL framework.
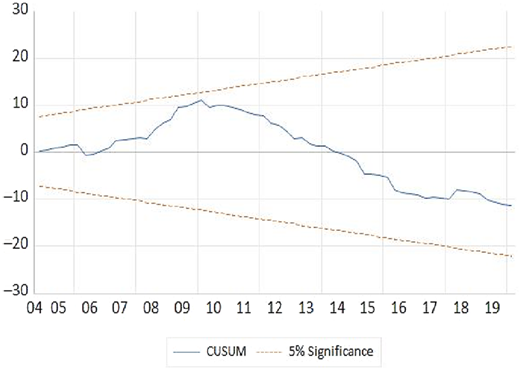
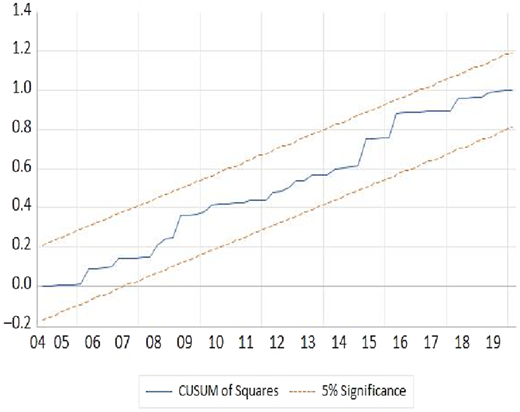
Figures 1 and 2 present the cumulative sum (CUSUM) and cumulative sum of squares (CUSUMSQ) tests, which support the stability of the NARDL model. In addition, the negative and statistically significant coefficient on the lagged dependent variable is consistent with convergence toward the long-run equilibrium. (Shahbaz et al., 2017).
4.2 Results discussion
The discussion distinguishes estimated conditional associations from contextual mechanisms and literature-based explanations. The model does not measure sectoral credit allocation, construction or household finance, clean-technology investment, environmental expenditure, infrastructure, logistics, urban efficiency, sectoral carbon intensity, or capital-stock modernization.
Electricity consumption and trade openness are positively associated with CO2 emissions, whereas urbanization is negatively associated; GDP per capita and industrial activity are statistically insignificant. These aggregate estimates do not identify sectoral sources or mechanisms. In Saudi Arabia's carbon-intensive context, positive electricity and trade associations may reflect higher energy demand and trade-related activity, while the urbanization result may be consistent with efficiency gains from denser settlement. These interpretations remain contextual because urban form, infrastructure quality and urban energy efficiency are not observed.
Because quarterly observations were generated from annual data using quadratic-match average interpolation, short-run coefficients and dynamic multiplier paths represent approximate adjustment patterns rather than directly observed quarterly responses. The long-run estimates remain informative as conditional associations, although interpolation-related smoothing cannot be excluded.
Positive diversification changes are associated with lower CO2 emissions in the short run, as indicated by the negative short-run coefficient on . However, the normalized long-run multiplier for positive diversification changes is positive , indicating that sustained increases in economic complexity are associated with higher CO2 emissions over the long run. This pattern is consistent with the possibility that initially more efficient productive reallocation may be followed by scale expansion in energy-intensive activities.
Negative diversification changes display a different adjustment pattern. Because is defined as a cumulative negative component, the positive short-run coefficient on indicates that a negative diversification shock is associated with lower CO2 emissions in the short run. In contrast, the negative normalized long-run multiplier indicates that sustained negative diversification changes are associated with higher CO2 emissions in the long run. These are conditional asymmetric associations, not directly observed sectoral mechanisms. The relationship may depend on output composition and the energy intensity of expanding activities, which the model does not observe (AlSabbagh, 2025).
The results partly align with Khaliq and Mamkhezri (2023b), who report lower short-run emissions following positive complexity shocks but higher long-run emissions following both positive and negative shocks. Differences may reflect Saudi Arabia's hydrocarbon-dependent energy system, the ECI proxy, controls, sample composition and the single-country NARDL design.
They also differ partly from AlSabbagh (2025), whose Bahrain ARDL results link manufacturing and real estate growth to higher emissions but hospitality, transport and communications to lower emissions. Since the present study uses ECI rather than sectoral output, energy, or carbon-intensity measures, its positive long-run diversification association cannot be attributed to any specific sector.
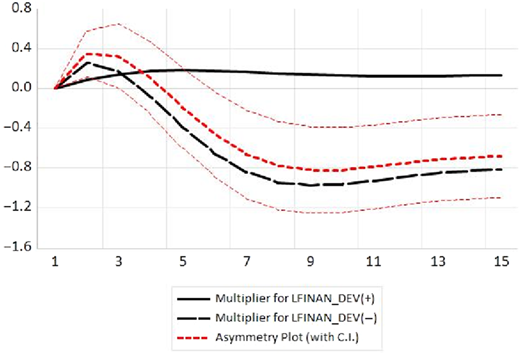
Positive bank-based financial development changes are associated with higher CO2 emissions in both the short and long run. The short-run coefficient on is positive and statistically significant , while the normalized long-run multiplier is also positive . These findings indicate that expansions in bank-based credit are conditionally associated with higher CO2 emissions over both adjustment horizons (Figure 4).
Negative changes in bank-based financial development exhibit a different pattern. Since is constructed as a cumulative negative component, the negative short-run coefficient on indicates that a negative credit shock is associated with higher CO2 emissions in the short run. By contrast, the positive normalized long-run multiplier indicates that sustained negative credit changes are associated with lower CO2 emissions over the long run. These estimates indicate asymmetric conditional associations rather than sector-specific mechanisms. Positive bank-based financial-development changes are associated with higher CO2 emissions in the short run (0.090972) and long run (0.096854), unlike the pattern reported by Raggad (2020). Differences may reflect the sample, controls, energy conditions, inclusion of economic complexity and the bank-credit proxy.
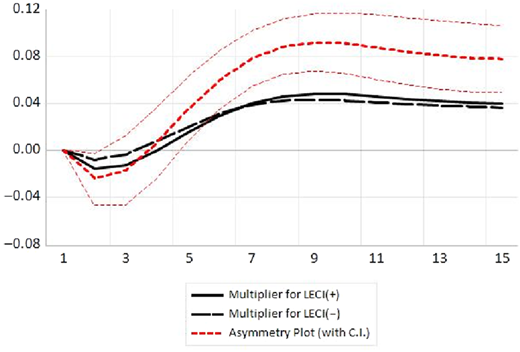
Positive diversification displays a reversal: its short-run coefficient is negative (−0.019970), while its normalized long-run multiplier is positive (0.029508). Multiplier paths therefore show adjustment toward long-run associations, not causal sectoral effects as shown in Figure 3.
Policy discussion should focus on the allocation of credit and diversification activity. Green lending standards, environmental screening of large loans, supervisory attention to carbon-intensive exposure and support for cleaner manufacturing, knowledge-intensive services, energy efficiency and cleaner electricity may help align financial deepening and diversification with lower-emission development (see Figure 4).
5. Conclusion and policy implications
This study examined the asymmetric short-run and long-run relationships between economic diversification, financial development and CO2 emissions in Saudi Arabia using a NARDL framework and quarterly data for 1995–2020. It assessed whether positive and negative shocks to diversification and financial development are associated with different environmental outcomes after controlling for electricity consumption, GDP per capita, industrial activity, urbanization and trade openness.
The findings should be interpreted cautiously because quarterly data were generated from annual series using the quadratic-match average procedure, which may smooth within-year variation and affect short-run dynamics.
Long-run estimates are normalized multipliers from the conditional error-correction specification, not raw lagged-level coefficients. Because negative partial sums represent cumulative decreases, the results indicate conditional asymmetric associations between directional changes in diversification and credit and CO2 emissions, rather than direct evidence of specific mechanisms.
Economic diversification and financial development are asymmetrically associated with CO2 emissions in Saudi Arabia. Positive diversification shocks are associated with lower CO2 emissions in the short run but higher emissions in the long run, whereas positive financial-development shocks are associated with higher emissions and negative shocks with lower emissions in the short run but higher emissions in the long run. Among the control variables, electricity consumption and trade openness are positively associated with emissions, urbanization is negatively associated with emissions and GDP per capita and industrial activity are not statistically significant in the preferred specification.
This study adds Saudi-specific evidence that diversification and bank-based financial development have asymmetric, horizon-dependent associations with CO2 emissions. The findings suggest that emissions outcomes may depend on the composition and energy intensity of expanding and credit-financed activities, while not establishing causality or evaluating specific interventions.
The results can therefore inform discussion of green lending, climate-risk screening, cleaner electricity and lower-emission productive capabilities but the effectiveness of these policies requires separate empirical evaluation.
6. Limitations of the study
This study has several limitations. First, the sample covers the period 1995–2020. As a result, the study captures the broader structural conditions surrounding Saudi Arabia's economic transformation but it does not allow for a separate evaluation of the full effects of Vision 2030 over a longer post-launch period. Second, environmental pressure is measured only by CO2 emissions per capita. Although this is a widely used indicator in the literature, it does not capture all dimensions of environmental degradation, such as ecological footprint, air quality, or broader carbon-related indicators.
Third, the quarterly observations were generated from annual series using the quadratic-match average procedure. Although this approach preserves annual averages and permits dynamic modeling, it may smooth within-year variation and limit the precision of estimated short-run coefficients and multiplier paths. The available annual sample is insufficient for a parameter-rich annual NARDL specification; therefore, the potential consequences of temporal interpolation cannot be fully excluded.
Future research could extend the analysis by using alternative environmental indicators, incorporating more disaggregated variables such as sectoral energy consumption and non-oil GDP and applying alternative nonlinear methods such as the QARDL model. Such extensions would provide a more comprehensive understanding of the links among diversification, financial development and carbon emissions.
Declaration of generative AI use
Authors used AI tools to enhance the quality of writing only.