


Crop suitability analysis is vital for identifying a piece of land’s potential for sustainable crop production and aids in the formulation of an effective agricultural management plan. This study aims to conduct crop suitability analysis of prominent Kharif (rice and maize) and Rabi (potato and wheat) crops in Sirajganj district, a flood-prone area of Bangladesh, and recommend a suitable cropping pattern to mitigate the detrimental effects of flooding.
Various factors such as soil drainage, soil depth, soil moisture, soil texture, soil permeability, soil pH, erosion hazard, nutrient status and flooding risk were considered for this study. For all four crops, the weights of each factor were determined using the analytical hierarchy process approach, and the scores of each subfactor were assigned on the basis of favorable circumstances of crop cultivation. Using the weighted overlay analysis in the ArcGIS 10.3 environment, the crop suitability maps were generated and were divided into four suitable classes. Geographic information system integration of crop suitability for all the crops determined the suitable cropping pattern of the study area in Kharif and Rabi seasons.
A vast portion of the study area covering 64.80% of the total land is suitable for cultivating either rice or maize in Kharif season followed by either potato or wheat in Rabi season. Other suitable cropping pattern for Kharif and Rabi seasons found in the study area are rice-wheat, rice-wheat/potato, rice/maize-wheat and rice/maize-potato, which covers a little portion of the study area.
This research validates the suitable location of crop cultivation on the basis of flooding occurrences in the locality.
1. Introduction
When plants of a similar type are grown in one location on a big scale for profit or sustenance, this is referred to as a crop. Food for the people and feed for the livestock are derived from crop yield. In addition, crop products are utilized as raw materials of plant origin in a variety of sectors, including the culinary, textile, pharmaceutical and energy industries (Mamai, Parsova, Lipatova, Gazizyanova, & Mamai, 2020). Thus, the prosperity of a nation is highly dependent on its crop output. Land suitability is the compatibility of a given category of land with a particular category of usage (Jamil, Sahana, & Sajjad, 2018). It is vital to assess cropland suitability in order to identify a portion of land’s potential for sustaining crop production (Bandyopadhyay, Jaiswal, Hegde, & Jayaraman, 2009). It is an effective tool for assisting decision-making in land use planning (Roy & Saha, 2018). More than three-quarters of the world’s total land is unsuited for agricultural production due to severe restrictions such as extreme cold (13%), extreme dry (27%), extreme steepness (12%) or poor soils (40%) (Bhagat et al., 2009). Furthermore, rapid population expansion and migration, particularly in metropolises, necessitate additional spaces for providing basic necessities. As a result, natural resources like forests, meadows, wetlands and agricultural lands are changed into settlements or industrial zones, and these areas are exploited in ways that are not commensurate with their capacity. Thus, it is critical to design land use plans which permit the transmission of natural assets to future generations as well as the managed and sustainable utilization of these assets in ways commensurate with their capacity (Akinci, Özalp, & Turgut, 2013). Moreover, as the world’s population is growing quickly yet land is scarce, crops must be planted in places where they are most suited to fulfill the expanding food demand as well as to ensure food security (Kamau, Kuria, & Gachari, 2015).
Bangladesh, a predominantly agricultural nation, is home to the world’s largest delta (Ganga-Brahmaputra and Sundarbans), which is crisscrossed by thousands of rivers and inlets. The land is covered with alluvial soil that is rich in nutrients. The soil and environment are optimal for growing a variety of crops throughout the year. Approximately 57% of the total land is agricultural. The lion's share of the overall land has been cultivated to meet the needs of millions of people. Despite this accomplishment, a large population's restricted access to the sufficient area under its jurisdiction makes agriculture a difficult alternative. In contrast, the annual conversion of 0.47% of agricultural land to non-agricultural purposes is a major issue for the agricultural community due to population pressure, urbanization and other non-agricultural objectives. Even with improvements to the existing agricultural system, obtaining more food from less land would be one of the country's most difficult challenges. Despite the decline in reliance on agriculture as a whole, 45% of the country's total workforce and 16% of GDP are still dependent on it (Nasim et al., 2018). Bangladesh has a tropical monsoon climate that is marked by a wide range of rainfall patterns. The distribution of precipitation in this country is not uniform. On average, the northwest of the country receives about 1,400 mm of precipitation each year, whereas the northeast receives more than 4,400 mm. The monsoon season accounts for greater than 75% of Bangladesh's precipitation (Alamgir et al., 2015). The crop-growing season in Bangladesh is separated into the Kharif and Rabi seasons. Kharif season begins in May, when rainfall provides sufficient moisture to sustain rain-fed or unirrigated crops, and concludes in October. Rabi season includes months (November to April) with no or minimal precipitation. It begins at the end of the humid period and continues until the beginning of the monsoon season. The country is very susceptible to flood dangers due to its geographic location, topography, the abundance of rivers and monsoon climate. Sirajganj district is considered one of the most vulnerable regions in Bangladesh. During the wet monsoon, floods occur nearly every year, and disastrous ones every 5–10 years. The floods of 1954, 1955, 1974, 1987, 1988, 1998, 2004, 2007, 2014 and 2016 caused extensive property damage and fatalities. In the event of the most catastrophic floods, 68% or more of the country's land area is impacted; in an ordinary year, 25% of the land area is inundated (Ali et al., 2019). The majority of flood impacts are related to agricultural losses. However, a suitable variety of crops may aid in mitigating the devastation caused by floods' erratic nature.
The existence of various and diverse factors affecting the compatibility of land makes land use suitability analysis exceedingly challenging. Wang (1994) stated that the suitability assessment of agricultural land entails the comprehensive examination of physiographic, climatic (rainfall and temperature), internal soil (moisture, texture, depth, aeration, salinity and natural fertility) and external soil (slope, accessibility and flooding) data. Kalogirou (2002) considered 17 elements categorized under three principal criteria such as “soil mechanics and toxicities, slope, erosion hazards, rooting conditions,” “excess of salts” and “water level, flood hazard and drainage.” Rahman and Saha (2008) used factors such as soil texture, soil depth, drainage, soil moisture holding capacity, organic matter, soil pH, slope and flooding hazard to prepare a crop suitability map and to suggest a suitable pattern of cropping in a flood-prone region. Bhagat et al. (2009) used elevation, rainfall, temperature, soil property and land use as the factors. Kihoro, Bosco, and Murage (2013) used factors such as climate (temperature and humidity), soil (soil texture, soil drainage and soil pH) and elevation (slope) for the suitability analysis of rice cultivation area. Akinci et al. (2013) used great soil group (GSG), land use capability class (LUCC), land use capability sub-class (LUCS), soil depth, slope, elevation, erosion-level and other soil properties (OSP) as the parameters. Sarkar, Ghosh, and Banik (2014) considered soil data (depth, texture, drainage and pH), climate data (rainfall) and Digital Elevation Model (DEM) (slope) for analyzing the land suitability of wheat. Kamau et al. (2015) used parameters such as soil pH, soil texture, soil depth, soil drainage, rainfall, mean temperature and slope. Jamil et al. (2018) used the factors such as rainfall, drainage, soil texture, soil depth, slope, pH, erosion hazard, risk of flooding, distance to road and distance to town. Roy and Saha (2018) used a broad variety of factors for the land suitability assessment of paddy such as climatic factors (rainfall and temperature), hydro-geomorphological factors (geology, elevation, slope, distance from river and groundwater depth), soil physical properties (soil texture and soil depth) and soil chemical properties (pH, copper, iron, manganese, nitrogen, organic carbon, phosphorus, potassium, sulfur, zinc and boron). Iliquín Trigoso et al. (2020) used criteria such as climatological (mean annual temperature and mean annual precipitation), topographical (elevation, terrain slope and terrain aspect), socioeconomical (land use/land cover, distance to rivers and distance to roads), edaphological (texture, pH, organic matter, nitrogen, phosphorus, potassium, cation exchange capacity and electrical conductivity). Sarkar, Saha, Maitra, and Mondal (2021) considered factors such as nitrogen, potassium, phosphate, sulphate, boron, pH, organic carbon, zinc, manganese, copper, iron, soluble salt, bulk density, cation exchange capacity, moisture index, elevation, slope, rainfall, groundwater level, lithology, geomorphology, LULC, soil, distance from the river and distance from road for assessing the soil fertility and suitability of land for growing Tulaipanji rice in eastern India's semi-humid climatic zone. Saha, Sarkar, Mondal, and Goswami (2021) used parameters such as rainfall, temperature, soil texture, soil pH, organic carbon, soil cation exchange capacity, bulk density, slope, elevation, aspects, distance from the river, distance from the road, geology, modified soil adjusted index, modified normalized difference water index and LULC for suitability assessment of agricultural land in an anabranching site of spoon river of India.
There are several methods for estimating the area of land suitable for cultivation. Because crop suitability analysis necessitates the need for diverse information and data, a geographic information system (GIS) provides a more powerful and versatile tool than traditional data management systems by allowing users to take large volumes of disparate datasets and manipulate and combine them to create latest datasets that can be presented as thematic maps (Foote & Lynch, 1996). Various GIS-based crop suitability study techniques, such as Boolean overlay and modeling for analyzing land suitability, need a precise method for integrating decision-maker choices into GIS techniques (Mustafa, Singh, Sahoo, Ahmed, Khanna, Sarangi, et al., 2011). GIS along with multi-criteria evaluation (MCE) methodologies may be used to overcome this problem. Analytical hierarchy process (AHP) is a widely known MCE technique for assessing the relative relevance of the factors (Kamau et al., 2015). Saaty (1980) was the first to establish AHP in order to build a hierarchical model for outlining difficult land management issues along with the most effective solutions (Malczewski, 2006; Cengiz & Akbulak, 2009; Roig-Tierno, 2013).
Hence, the present study aimed to conduct a land suitability analysis of major crops in the Sirajganj district using a multi-criteria decision with AHP and GIS technique for agricultural land use planning, with a focus on flood effect. This study attempted to recommend suitable cropping patterns during flood and post-flood seasons based on chosen crop suitability maps with suitability prioritization, current land use patterns and expert knowledge.
2. Methods and materials
2.1 Study area profile
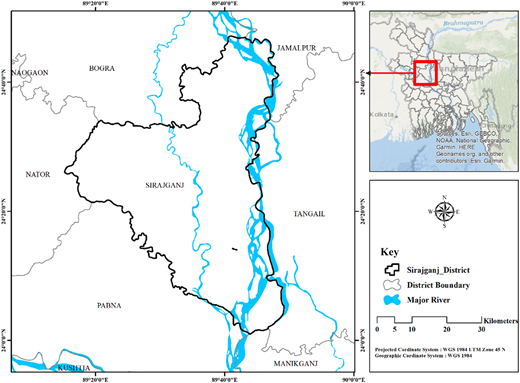
Sirajganj district in the Rajshahi division of Bangladesh which is renowned as the “Gateway to North Bengal” was selected as the study area. The overall area of the district is 2,497.92 km2 (964.45 square miles) and is located between latitudes 24°01' and 24°47' N and longitudes 89°15' and 89°59' E (Chanda, Khan, Sarkar, Sarwar, & Paul, 2021). It is surrounded by Bogra District and Natore District to the north, Natore District and Pabna District to the west, Pabna District and Manikganj District to the south and Tangail District, Jamalpur District and Manikganj District to the east. The district comprises 6 municipalities, 6 parliamentary seats, 9 upazilas, 82 unions and 2016 villages. The population is 3,215,873 (Ali et al., 2019). It is the 9th most populous and the 25th biggest district by area in Bangladesh. It is one of the most economically significant districts of Bangladesh. Agriculture is the area's principal economic activity (Ali et al., 2019). Sirajganj has a very low elevation as compared to the rest of the country (Siddik & Rahman, 2013). The average elevation of the district is 7 m (Chanda et al., 2021). In the year 2020, the average maximum and minimum temperatures are 35.5°C (March) and 11°C (January), respectively, with total precipitation of 12,967 mm (Chanda et al., 2021). Sirajganj district is situated on the bank of the Brahmaputra River, often known as the Jamuna River locally. Other rivers in this district include the Baral, Ichamati, Karatoa and Phuljuri, in addition to the Brahmaputra River (Jamuna) (Siddik & Rahman, 2013). The Jamuna's monsoon discharge is so high that it often breaches its banks, causing floods in the majority of Sirajganj's upazilas. Almost every year, Sirajganj gets flooded, with the most catastrophic floods in 1949, 1956, 1961, 1962, 1966, 1968, 1974, 1979, 1987, 1988, 1996, 1998, 2002, 2004, 2007, 2008, 2014 and 2016. The most vulnerable sites in Sirajganj are low, flat parts of deposited silt in the river often called “char” (island) areas (Ali et al., 2019) (Figure 1).
2.2 Selection of land utilization types
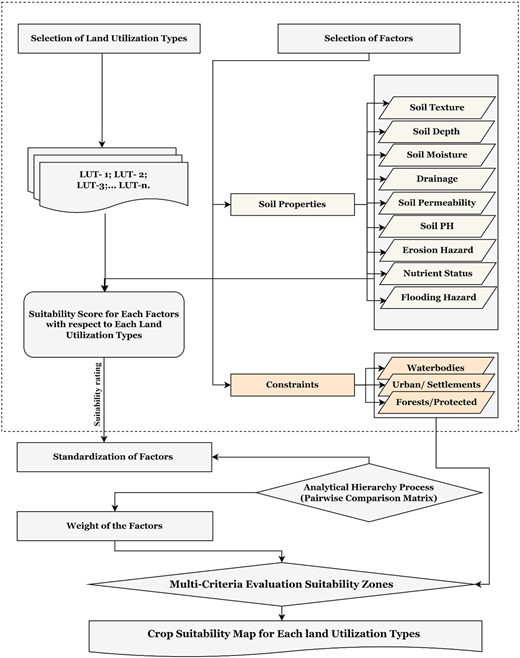
Land utilization type (LUT) refers to a form of land use that is more specifically or thoroughly defined than a primary category of land use (Rahman & Saha, 2008). Possible land utilization types were selected through the investigation of the study area. Kharif (May-October) and Rabi (November-April) are the two crop-growing seasons of the flood-prone district, Sirajganj. Rice and maize are the two major crops grown in the study area during the Kharif season. On the other hand, potato and wheat are the two major crops grown in the study area during the Rabi season. Thus, four distinct LUTs such as Rice (Aman-Kharif/Flood season-LUT-1), Maize (Kharif/Flood season-LUT-2), Potato (Rabi/Post Flood season-LUT-3) and Wheat (Rabi/Post Flood season-LUT-4) were chosen for the crop suitability analysis (Figure 2).
2.3 Selection of factors
Factors for crop suitability analysis at various scales have differed in past research. Literature review of several references and desk search of accessible data assisted in the identification of assessment factors. Soil drainage, soil depth, soil moisture, soil texture, soil permeability, soil pH, erosion hazard, nutrient status and flooding risk were the factors considered for delineating the areas suitable for cultivating rice, maize, potato and wheat. In ArcGIS 10.3, the thematic maps of these factors were prepared from the shape file which is available in Bangladesh Agricultural Research Council (BARC) (Table 1).
Details of data used in extraction of thematic layers
| Data type | Data detail | Sources | Layer extracted |
|---|---|---|---|
| Soil Data | Land Resources Appraisal of Bangladesh for Agricultural Development (BGD/81/035) | Bangladesh Agricultural Research Council (BARC) (Available at http://www.barc.gov.bd/) | Soil permeability |
| Soil texture | |||
| Soil depth | |||
| Soil moisture | |||
| Soil drainage | |||
| Soil pH | |||
| Erosion hazard | |||
| Nutrient status | |||
| Flooding hazard | |||
| Land Use | Sentinel-2 10-Meter Land Use/Land Cover | ESRI Land Cover (Available at https://livingatlas.arcgis.com/landcover/) | LULC |
| Acquisition Date: 2021/12/20 | |||
| Platform: SENTINEL-2A | |||
| Tile Number: T45QYG, T45RYH |
2.4 Analytical Hierarchy Process (AHP)
For assigning the relative importance or weight of factors to determine the suitable areas for cultivating crops such as rice, maize, potato and wheat, AHP was used. It is a multi-criteria decision-making approach established by Saaty in order to choose the criteria for achieving the objectives through the hierarchical structure. (Saaty, 1980, 1994; Saaty & Vargas, 2001). The useful mathematical characteristics of AHP have drawn the attention of numerous researchers (Akinci et al., 2013). Factor weights were generated by comparing two factors through a Pairwise Comparison Matrix (PWCM). The PWCM was implemented using Saaty's scale with values ranging from 9 to 1/9. A score of 9 means that the row element is more significant than the column element. On the other side, a grade of 1/9 means that the row element is less significant than the column element (Mustafa et al., 2011). When both the row and column elements are significant equally, a score of 1 is given to them (Table 2).
Intensity of relative importance scale developed by Saaty
| Intensity of importance | Definition |
|---|---|
| 1 | Equal importance |
| 3 | Moderate prevalence of one over another |
| 5 | Strong or essential prevalence |
| 7 | Very strong or demonstrated prevalence |
| 9 | Extremely high prevalence |
| 2, 4, 6, 8 | Intermediate values |
| Reciprocals | For inverse comparison |
By normalizing the pairwise comparison matrix, weights or priorities are established. For this normalization, a “normalized pairwise comparison matrix” is generated by dividing the matrix's column elements by the total of each column. The row elements of the resulting matrix are summed and the total is then divided by the number of rows. In this manner, a priority vector or weight vector is produced (Tombuş, 2015). Weights vary from 0 to 1, and their combined value is 1 (Lobo, Lozano, & Delgado, 2005; Öztürk & Batuk, 2010). There may be some degree of inconsistency when doing pairwise comparisons of the factors in the AHP technique. Therefore, it is important to verify the logical consistency of pairwise comparisons. Saaty's proposed consistency ratio is used to evaluate the coherence of a pairwise comparison matrix and is calculated using equation (1).
where CI = Consistency index and RI = Random consistency index. CI can be calculated using equation (2).
where λmax = The largest eigenvalue of the matrix and n = Order of the matrix. RI can be calculated using equation (3).
For consistency ratio, Saaty suggested 0.10 as its upper limit. Consistency ratios of less than 0.10 are regarded to indicate that the judgements are consistent enough to proceed ahead with the assessment. The judgements are deemed inconsistent if the consistency ratio exceeds 0.10. In this instance, the judgements' caliber needs to be raised. By reviewing the judgments, the consistency rate can be decreased (Öztürk & Batuk, 2007) (Tables 3–6).
Pairwise comparison matrix of selected factors for rice crop
| Sl. No. | Criteria | 1 | 2 | 3 | 4 | 5 | 6 | 7 | 8 | 9 | Weight |
|---|---|---|---|---|---|---|---|---|---|---|---|
| 1 | Soil drainage | 1 | 2 | 2 | 1/3 | 3 | 3 | 7 | 1/2 | 1/2 | 0.13 |
| 2 | Soil depth | 1/2 | 1 | 1/3 | 1/3 | 5 | 1 | 5 | 1/2 | 1/3 | 0.08 |
| 3 | Soil moisture | 1/2 | 3 | 1 | 1/5 | 2 | 2 | 4 | 1/2 | 1/3 | 0.09 |
| 4 | Soil texture | 3 | 3 | 5 | 1 | 7 | 2 | 8 | 3 | 1/2 | 0.24 |
| 5 | Soil permeability | 1/3 | 1/5 | 1/2 | 1/7 | 1 | 1/5 | 3 | 1 | 1/4 | 0.04 |
| 6 | Soil pH | 1/3 | 1 | 1/2 | 1/2 | 5 | 1 | 4 | 2 | 1/2 | 0.10 |
| 7 | Erosion hazard | 1/7 | 1/5 | 1/4 | 1/8 | 1/3 | 1/4 | 1 | 1/3 | 1/4 | 0.02 |
| 8 | Nutrient status | 2 | 2 | 2 | 1/3 | 1 | 1/2 | 3 | 1 | 1/2 | 0.10 |
| 9 | Flooding risk | 2 | 3 | 3 | 2 | 4 | 2 | 4 | 2 | 1 | 0.20 |
| Max. eigenvalue (λmax) = 10.08 n = 9 | |||||||||||
| Consistency index (CI) = 0.13 | |||||||||||
| Random index (RI) = 1.45 | |||||||||||
| Consistency ratio (CR) = 0.09 | |||||||||||
Pairwise comparison matrix of selected factors for maize crop
| Sl. No. | Criteria | 1 | 2 | 3 | 4 | 5 | 6 | 7 | 8 | 9 | Weight |
|---|---|---|---|---|---|---|---|---|---|---|---|
| 1 | Soil drainage | 1 | 2 | 1 | 1/2 | 1 | 2 | 2 | 2 | 1 | 0.12 |
| 2 | Soil depth | 1/2 | 1 | 1/2 | 1/3 | 1/2 | 1/2 | 1 | 1/3 | 1/3 | 0.05 |
| 3 | Soil moisture | 1 | 2 | 1 | 1 | 2 | 2 | 2 | 2 | 1 | 0.14 |
| 4 | Soil texture | 2 | 3 | 1 | 1 | 3 | 3 | 3 | 4 | 2 | 0.22 |
| 5 | Soil permeability | 1 | 2 | 1/2 | 1/3 | 1 | 1 | 1 | 1/2 | 1/3 | 0.07 |
| 6 | Soil pH | 1/2 | 2 | 1/2 | 1/3 | 1 | 1 | 2 | 1 | 1/3 | 0.8 |
| 7 | Erosion hazard | 1/2 | 1 | 1/2 | 1/3 | 1 | 1/2 | 1 | 1/4 | 1/4 | 0.05 |
| 8 | Nutrient status | 1/2 | 3 | 1/2 | 1/4 | 2 | 1 | 4 | 1 | 1/2 | 0.10 |
| 9 | Flooding risk | 1 | 3 | 1 | 1/2 | 3 | 3 | 4 | 2 | 1 | 0.17 |
| Max. eigenvalue (λmax) = 9.48 n = 9 | |||||||||||
| Consistency index (CI) = 0.06 | |||||||||||
| Random index (RI) = 1.45 | |||||||||||
| Consistency ratio (CR) = 0.04 | |||||||||||
Pairwise comparison matrix of selected factors for potato crop
| Sl. No. | Criteria | 1 | 2 | 3 | 4 | 5 | 6 | 7 | 8 | Weight |
|---|---|---|---|---|---|---|---|---|---|---|
| 1 | Soil drainage | 1 | 2 | 1/2 | 1/3 | 2 | 3 | 4 | 3 | 0.13 |
| 2 | Soil depth | 1/2 | 1 | 1/3 | 1/4 | 3 | 4 | 3 | 1/3 | 0.09 |
| 3 | Soil moisture | 2 | 3 | 1 | 1/2 | 4 | 5 | 5 | 4 | 0.21 |
| 4 | Soil texture | 3 | 4 | 2 | 1 | 6 | 7 | 6 | 6 | 0.33 |
| 5 | Soil permeability | 1/2 | 1/3 | 1/4 | 1/6 | 1 | 2 | 3 | 1/2 | 0.06 |
| 6 | Soil pH | 1/3 | 1/4 | 1/5 | 1/7 | 1/2 | 1 | 2 | 2 | 0.05 |
| 7 | Erosion hazard | 1/4 | 1/3 | 1/5 | 1/6 | 1/3 | 1/2 | 1 | 1/4 | 0.04 |
| 8 | Nutrient status | 1/3 | 3 | 1/4 | 1/6 | 2 | 1/2 | 4 | 1 | 0.09 |
| Max. eigenvalue (λmax) = 8.94 n = 8 | ||||||||||
| Consistency index (CI) = 0.13 | ||||||||||
| Random index (RI) = 1.41 | ||||||||||
| Consistency ratio (CR) = 0.09 | ||||||||||
Pairwise comparison matrix of selected factors for wheat crop
| Sl. No. | Criteria | 1 | 2 | 3 | 4 | 5 | 6 | 7 | 8 | Weight |
|---|---|---|---|---|---|---|---|---|---|---|
| 1 | Soil drainage | 1 | 2 | 1/2 | 1/2 | 2 | 3 | 3 | 3 | 0.15 |
| 2 | Soil depth | 1/2 | 1 | 1/3 | 1/3 | 1/2 | 2 | 2 | 1/3 | 0.07 |
| 3 | Soil moisture | 2 | 3 | 1 | 1 | 3 | 4 | 3 | 4 | 0.23 |
| 4 | Soil texture | 2 | 3 | 1 | 1 | 4 | 5 | 4 | 5 | 0.26 |
| 5 | Soil permeability | 1/2 | 2 | 1/3 | 1/4 | 1 | 2 | 2 | 1/2 | 0.08 |
| 6 | Soil pH | 1/3 | 1/2 | 1/4 | 1/5 | 1/2 | 1 | 2 | 2 | 0.06 |
| 7 | Erosion hazard | 1/3 | 1/2 | 1/3 | 1/4 | 1/2 | 1/2 | 1 | 1/4 | 0.05 |
| 8 | Nutrient status | 1/3 | 3 | 1/4 | 1/5 | 2 | 1/2 | 4 | 1 | 0.10 |
| Max. eigenvalue (λmax) = 8.80 n = 8 | ||||||||||
| Consistency index (CI) = 0.06 | ||||||||||
| Random index (RI) = 1.41 | ||||||||||
| Consistency ratio (CR) = 0.08 | ||||||||||
2.5 Assigning scores to sub-factors
A scale between 1 and 9 is used for allocating scores to the subcategory of factors on the basis of favorable circumstances for crop suitability. The most appropriate subcriteria received the highest score (9), the least appropriate sub-criteria received the lowest score (1) and the moderately appropriate subcriteria received intermediate ratings for delineating suitable areas for crops. The scores were consequently given for selected factors such as soil drainage, soil depth, soil moisture, soil texture, soil permeability, soil pH, erosion hazard, nutrient status and flooding risk in the case of crops such as rice, maize, potato and wheat (Table 7).
Weights of the factors and scores of the sub-factors
| Factors | Rice weight | Maize weight | Potato weight | Wheat weight | Sub-factors | Rice score | Maize score | Potato score | Wheat score |
|---|---|---|---|---|---|---|---|---|---|
| Drainage | 0.13 | 0.12 | 0.13 | 0.15 | Poorly drained | 9 | 2 | 2 | 3 |
| Mostly poorly drained | 7 | 3 | 3 | 4 | |||||
| Mixed imperfectly drained and poorly drained | 6 | 4 | 4 | 5 | |||||
| Mostly imperfectly drained | 5 | 5 | 5 | 6 | |||||
| Imperfectly drained | 4 | 6 | 6 | 7 | |||||
| Soil depth | 0.08 | 0.05 | 0.09 | 0.07 | >1.22 m | 9 | 9 | 9 | 9 |
| Mostly >1.22 m | 8 | 8 | 8 | 8 | |||||
| Mixed >1.22 m and 0.90-1.22 m | 6 | 5 | 7 | 6 | |||||
| Mostly 0.90-1.22 m | 5 | 4 | 6 | 5 | |||||
| 0.90-1.22 m | 4 | 3 | 5 | 4 | |||||
| Soil moisture | 0.09 | 0.14 | 0.21 | 0.23 | 300–400 mm | 9 | 9 | 9 | 8 |
| 200–300 mm | 7 | 8 | 8 | 7 | |||||
| 100–200 mm | 5 | 5 | 7 | 6 | |||||
| <100 mm | 3 | 4 | 6 | 5 | |||||
| Soil texture | 0.24 | 0.22 | 0.33 | 0.26 | Clay | 9 | 5 | 2 | 5 |
| Clay loam | 8 | 7 | 9 | 8 | |||||
| Silty clay | 7 | 4 | 3 | 4 | |||||
| Silt loam | 5 | 8 | 8 | 6 | |||||
| Silt | 4 | 3 | 4 | 2 | |||||
| Sandy loam | 3 | 9 | 7 | 7 | |||||
| Soil permeability | 0.04 | 0.07 | 0.06 | 0.08 | Mixed moderate and rapid | 8 | 3 | 9 | 3 |
| Mixed rapid and slow | 7 | 4 | 7 | 4 | |||||
| Moderate | 6 | 5 | 5 | 5 | |||||
| Mixed moderate and slow | 5 | 6 | 4 | 6 | |||||
| Slow | 3 | 7 | 3 | 7 | |||||
| Soil pH | 0.10 | 0.08 | 0.05 | 0.06 | 4.5–5.5 | 7 | 3 | 7 | 4 |
| 5.5–7.3 | 5 | 8 | 9 | 6 | |||||
| Mixed 7.3–8.4 and 5.5–7.3 | 4 | 6 | 6 | 7 | |||||
| 7.3–8.4 | 3 | 4 | 5 | 9 | |||||
| Erosion hazard | 0.02 | 0.05 | 0.04 | 0.05 | None | 9 | 9 | 9 | 9 |
| High | 3 | 3 | 5 | 5 | |||||
| Nutrient status | 0.10 | 0.10 | 0.09 | 0.10 | High | 9 | 9 | 9 | 9 |
| Mostly high | 7 | 8 | 7 | 8 | |||||
| Mixed low and high | 5 | 5 | 5 | 7 | |||||
| Low | 3 | 3 | 3 | 6 | |||||
| Flooding risk | 0.20 | 0.17 | - | - | No flooding | 9 | 9 | ||
| Low river flooding | 8 | 8 | |||||||
| Moderate river flooding | 5 | 5 | |||||||
| Severe river flooding | 3 | 2 |
2.6 Generation of crop suitability maps
Raster maps of nine factors were overlaid using the weighted sum overlay analysis, and crop suitability maps for rice, maize, potato and wheat were produced after factor weights and subfactor scores were assigned to the corresponding layers in the ArcGIS 10.3 environment. The analysis layers (crop suitability maps of rice, maize, potato and wheat) were categorized into four classes such as highly suitable (S1), moderately suitable (S2), marginally suitable (S3) and not suitable (N) according to the land suitability classification of FAO (1976). Thus, the crop suitability maps of the Sirajganj district for rice, maize, potato and wheat were obtained.
2.7 Recommending suitable cropping pattern
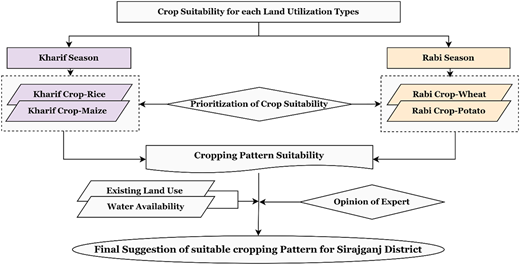
In the analysis of crop suitability, flood (Kharif) and post-flood (Rabi) crops were taken into account, and the analysis of cropping pattern suitability was conducted solely for the flood and post-flood seasons. The crop suitability maps were only employed for each LUT when they were either highly suitable (S1) or moderately suitable (S2). Due to their poor productivity, the marginally suitable (S3) and not suitable (N) sites were disregarded in the analysis of land use conflicts. For the analysis of cropping pattern suitability, land suitability for Kharif crops was initially determined by GIS integration of two LUTs (Rice-LUT-1 and maize-LUT-2). It was then overlaid with land suitability for Rabi crops which was determined by GIS integration of two LUTs (potato-LUT-3 and wheat-LUT-4) to generate a map of cropping pattern suitability for both the Kharif and Rabi seasons. Interviews with key informants such as crop-growing farmers, agronomists and extension workers were undertaken for the final recommendation of the suitable cropping pattern in the district. Figure 3 depicts the process for recommending a suitable cropping pattern for the Kharif and Rabi seasons.
2.8 Sensitivity analysis
The connections between a modeling application's output and inputs are investigated using sensitivity analysis (Chen, Yu, & Khan, 2010). It is “the study of the dependence of a model on the information given into it and how the variation in the output of a model (numerical or otherwise) may be allocated, quantitatively or qualitatively, to distinct sources of variation” (Saltelli, Chan, & Scott, 2000). It may be used to determine if the final result is resilient to minor modifications in the input data (Newham, Norton, Prosser, Croke, & Jakeman, 2003; Ticehurst, Cresswell, & Jakeman, 2003; Zoras, Triantafyllou, & Hurley, 2007). The three most popular methods for analyzing the sensitivity of a set of factors are modifying the factors' values, their relative importance and their weights (Shaloo et al., 2022). Based on modifying weights of the factors using the “what-if” technique, sensitivity analysis has been performed in this study. Final maps, which show the spatial variations in suitability class, were created for each LUT after each factor was given equal weights by weighted overlay analysis.
3. Result and discussion
3.1 Spatial variations of factors
Spatial variations of each of the nine criteria for land suitability analysis of crops such as rice, maize, potato and wheat are described below.
3.1.1 Soil drainage
Soil drainage of the Sirajganj district is categorized into poorly drained, mostly poorly drained, mixed imperfectly drained and poorly drained, mostly imperfectly drained and imperfectly drained. Poorly drained soil is frequently wet for extended periods of time as water is removed very slowly. In contrast, the imperfectly drained soil stays moist at shallow depths for lengthy periods of time due to the sluggish removal of water. The soil drainage map of the study area depicts that 38.45% and 49.78% of the study area has poorly drained and mostly poorly drained soil, respectively.
3.1.2 Soil depth
When it comes to the growth of plant roots, soil depth is a crucial factor. The estimated depth of the soil within which root development is not impeded because of either physical or chemical substances, such as an impermeable or poisonous stratum, is referred to as the soil depth (Kamau et al., 2015). Based on how deep the environment for plant root growth is, the variety of cultivable species rises. It is anticipated that soils with greater depth would have a greater variety of cultivable species, while soils with exposed parent rock and delayed soil formation will have a lower variety of cultivable species (Akinci et al., 2013). Regarding soil depth, the study area has been categorized into five subclasses such as >1.22 m, mostly >1.22 m, mixed >1.22 m and 0.90–1.22 m, mostly 0.90–1.22 m and 0.90–1.22 m which covers 108,132.5 acres (19.52%), 98,331.96 acres (17.75%), 62,303.02 acres (11.25%), 253,193.9 acres (45.70%) and 32,082.31 acres (5.79%) of the area, respectively.
3.1.3 Soil moisture
The water retained in the gaps between soil particles is referred to as soil moisture. Adequate soil moisture is a necessary prerequisite for healthy plant development and good crop harvests. The moisture contents of the soil in the study area are divided into four categories such as <100 mm, 100–200 mm, 200–300 mm and 300–400 mm for delineating suitable production areas for major crops. From the soil moisture map of the Sirajganj district, it can be depicted that soil moisture content of 300–400 m, 200–300 mm, 100–200 mm and <100 mm covers 53.89%, 15.89%, 19.51% and 10.71% of the study area, respectively.
3.1.4 Soil texture
The majority of the soil's physical qualities are determined by its texture class (Mustafa et al., 2011). The texture of the soil is essential because it affects the quantity of water the soil can contain, the pace of water flow through the soil and the workability and fertility of the soil. According to the soil textural categorization, the Sirajganj district is made up of many types of soil, including clay, clay loam, silty clay, silty loam, silt and sandy loam. The soil texture map of the study area depicts that silty clay covers 53.98% and silty loam covers 33.12% of the area, while clay soil, sandy loam and clay loam texture cover only 12.67%, 0.09% and 0.06% of the study area (Figure 4).
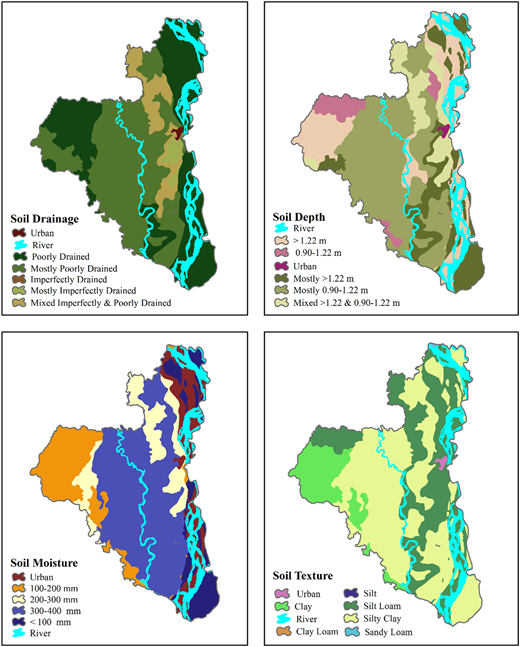
Spatial variations of soil drainage, soil depth, soil moisture, and soil texture
Spatial variations of soil drainage, soil depth, soil moisture, and soil texture
3.1.5 Soil permeability
A soil's permeability is a measure of its capacity to enable water to move through it. The porosity of soil (the spaces between the soil particles) is most directly linked to its permeability, although the form of the pores and the way they are (or are not) interconnected also impact permeability. As a result, it may be regarded as one of the critical elements for cropland suitability analysis. Soil permeability of the study area is classified into five categories such as mixed rapid and moderate, mixed rapid and slow, moderate, mixed moderate and slow and slow for determining the suitable area for crops. From the soil permeability map of the Sirajganj district, it can be depicted that 48.88%, 32.75% and 5.35% of the area has soil with moderate, slow and mixed moderate and slow permeability, respectively, whereas mixed rapid and moderate soil and mixed rapid and slow soil covers 3.22% and 9.815% of the area, respectively.
3.1.6 Soil pH
The solubility of elements and their possible availability or phytotoxicity for crops are determined by soil pH, which also establishes the appropriateness of the soil for a given crop (Halder, 2013). The soil pH in the study area varies from 4.5 to 8.4 and is classified into four categories such as 4.5–5.5, 5.5–7.3, mixed 7.3–8.4 and 5.5–7.3, and 7.3–8.4. The soil pH map of the Sirajganj district depicts that about 61% of the area has soil pH values ranging from 5.5 to 7.3. Other soil pH categories such as 7.3–8.4, mixed 5.5–7.3 and 7.3–8.4, and 4.5–5.5 covers 23.02%, 8.19% and 7.86% of the study area, respectively.
3.1.7 Erosion hazard
Because erosion has a detrimental impact on the soil's physical and chemical qualities as a result of its impacts on soil depth, the variety of crops that may be grown there is reduced (Akinci et al., 2013). Most of the area that is 77.65% of the study area do not experience erosion hazard, whereas only 22.35% of the study area is exposed to river erosion hazard. According to the erosion hazard map, a vast portion on the western side of the district experiences no erosion hazard at all and a tiny portion on the eastern side of the district is subject to river erosion hazard.
3.1.8 Nutrient status
A significant source of the nutrients required by plants for development is soil. The three essential nutrients are potassium, phosphorus and nitrogen. Together, they make up the trio known as NPK. Sulfur, calcium and magnesium are essential nutrients as well. In addition, plants need trace quantities of a number of other elements, notably iron, manganese, zinc, copper, boron and molybdenum, all of which are present at minute levels. These soil nutrients play a huge part in the development of healthy plants. The nutrient status of the Sirajganj district is classified into four categories and graded as high > mostly high > mixed low and high > low for the land suitability analysis of the crops. The nutrient status map of the district implies that high and mostly high nutrient status of soil covers 72.47% and 19.03% of the study area, respectively, and a tiny portion on the north-western side covering only 8.41% of the district has a low status of nutrient in the soil (Figure 5).
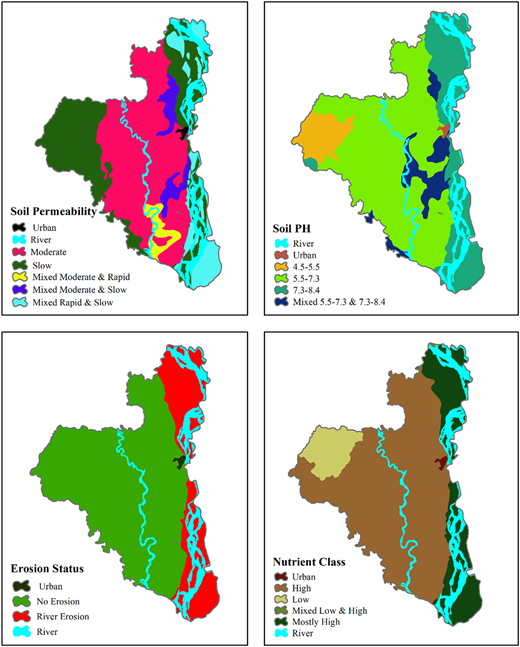
Spatial variations of soil permeability, soil pH, erosion hazard and nutrient status
Spatial variations of soil permeability, soil pH, erosion hazard and nutrient status
3.1.9 Flooding risk
The risk of flood in the Sirajganj district is classified into four categories such as no flooding, low river flooding, moderate river flooding and severe river flooding. For delineating areas suitable for crop production, the categories are scored as no flooding > low river flooding > moderate river flooding > severe river flooding. The flooding risk map of the district depicts that 304,368.70 acres of land which is 54.75% of the study area has a moderate risk of flood. A very little portion of the study area which is only 15.59 acres of land has a low risk of flooding. Besides these, no flooding and severe river flooding cover 122,408 acres (22.02%) and 129,173.4 acres (23.23%) of the district (Figure 6).
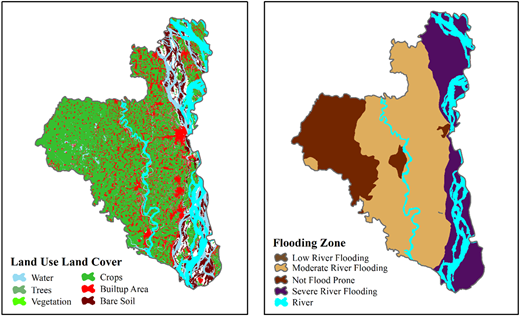
3.2 Land suitability for crop cultivation
For persistent agricultural development, the land suitability study is a crucial source of information. Using a multi-criteria decision approach, nine geographical datasets, including soil drainage, soil depth, soil moisture, soil texture, soil permeability, soil pH, erosion hazard, nutrient status and flooding risk, were used to determine the land area most suitable for cultivation of major crops (rice, maize, potato and wheat) in Kharif and Rabi seasons. In terms of crop suitability, the land has been divided into four categories namely, “highly suitable,” “moderate suitable,” “marginally suitable” and “not suitable.”
3.2.1 Rice (LUT-1, flood/Kharif season)
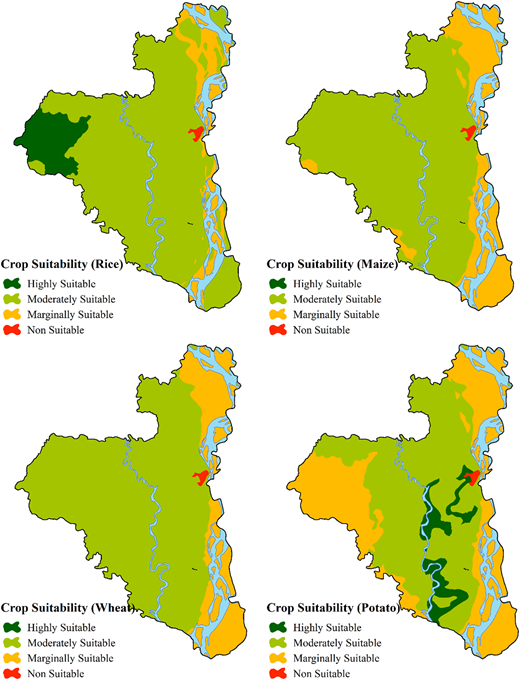
The land suitability map for rice cultivation depicts that only 9.13% of the total area in the north-western part of the district is highly suitable for cultivating rice. The majority part of the study area which covers 80.96% of the total area is moderately suitable for cultivating rice crops. The map also shows that only 9.57% of the study area has marginally suitable land for growing rice across the eastern boundary of the district and a very less amount that is only 0.35% of the total land in the study area is not suitable for growing rice. These findings collectively show that the study area has a high capability for cultivating rice (Table 8).
3.2.2 Maize (LUT-2, flood/Kharif season)
The land suitability map for maize cultivation depicts that a significant part of the study area which covers 78.20% of the total area is moderately suitable for maize cultivation. Only 21.46% of the study area has land which is marginally suitable for producing maize. A very insignificant portion of Sirajganj district which covers only 0.35% of the total area is not suitable for growing maize crops. The map also shows that there is no land in the study area which is highly suitable for cultivating the crop (Table 9).
3.2.3 Potato (LUT-3, post-flood/Rabi season)
The land suitability map for potato cultivation depicts that a very tiny portion of the study area which is only 6.64% of the total area is highly suitable for potato cultivation. Moderately suitable land for growing potatoes covers a considerable portion of the study area which is 55.91% of the total area. The map also shows that the eastern and western portion of the district covering 37.10% of the study area has land which is marginally suitable for potatoes. Only 0.35% of the study area is not suitable for the crop (Figure 7) (Table 10).
3.2.4 Wheat (LUT-4, post-flood/Rabi season)
The land suitability map for wheat cultivation depicts that there is no highly suitable land for wheat cultivation in the study area. A vast portion of the Sirajganj district which covers 80.71% of the total area has moderately suitable land for cultivating wheat. Marginally suitable land for wheat covers 18.94% of the study area in the eastern portion of the district. Besides, a negligible percentage of the research area which is 0.35% of the total land is not suitable for wheat production (Table 11).
3.3 Cropping pattern suitability and recommended cropping pattern
Through the GIS integration of the derived land suitability map of the four crops of Kharif and Rabi seasons cropping pattern suitability map of the Sirajganj district was obtained. Table 12 shows the area covering different cropping patterns for rice, maize, wheat and potato in Kharif and Rabi seasons (Figure 8).
Cropping pattern suitability (Kharif-Rabi)
| Crops | Rice | Maize | Wheat | Potato | Area (Acres) | % Of total Area |
|---|---|---|---|---|---|---|
| Suitability | S1 | S2 | S2 | S3 | 50744.30 | 9.13% |
| Total | 50744.30 | 9.13% | ||||
| S2 | S2 | S2 | S1 | 36934.22 | 6.64% | |
| S2 | 308589.34 | 55.51% | ||||
| S3 | 36940.89 | 6.64% | ||||
| S3 | S2 | S3 | 13514.26 | 2.43% | ||
| S3 | S2 | 226.40 | 0.04% | |||
| S3 | 53881.37 | 9.69% | ||||
| Total | 450086.5 | 80.95% | ||||
| S3 | S2 | S2 | S2 | 1526.08 | 0.27% | |
| S3 | S2 | S2 | 483.49 | 0.09% | ||
| S3 | S3 | 51174.60 | 9.21% | |||
| Total | 53184.17 | 9.57% | ||||
| Urban | 1928.16 | 0.35% | ||||
| Total Area of Crop land | 555943.08 | 100.00% | ||||
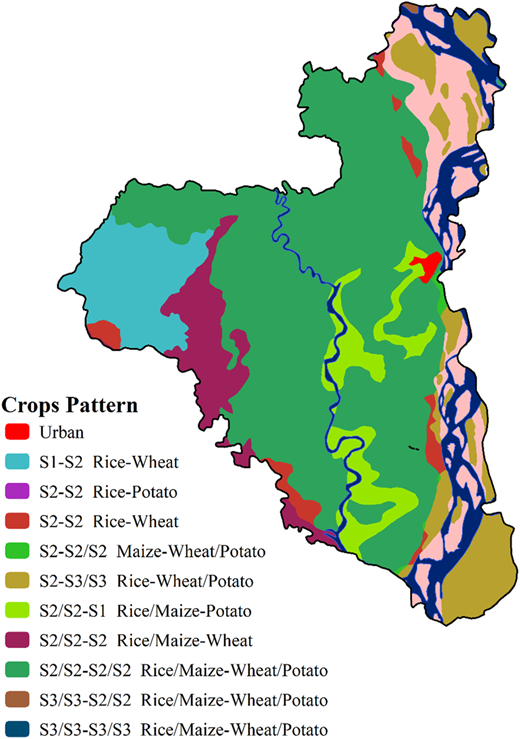
For recommending the suitable cropping pattern for the research area, crop suitability maps were utilized for each LUT if they were highly suitable (S1) or moderately suitable (S2), while marginally suitable or not suitable areas were disregarded. The spatial distribution of the recommended cropping pattern of the Sirajganj district depicts that rice or maize in Kharif season accompanied by potato or wheat in Rabi season would be a suitable cropping pattern for a vast portion of the study area covering 64.80% of the total area. Again, cultivating rice in Kharif season and then wheat in Rabi season would be a suitable cropping pattern for 11.56% of the total study area. Rice in Kharif season and then wheat or potato in Rabi season would be a suitable cropping pattern for 9.69% of the total land in the eastern part of the district. Rice or maize in Kharif season followed by wheat in Rabi season would be a suitable pattern in the western part of the district covering 6.64% of the total area. Another 6.64% of the total area would be appropriate for cultivating rice or maize in Kharif season and cultivating potato in Rabi season. Besides these, very tiny portion of the study area covering 0.04% and 0.27% of the total land is suitable for cultivating rice in Kharif season followed by potato in Rabi season and maize in Kharif season followed by potato or wheat in Rabi season, respectively (Figure 9 and Table 13).Table 14
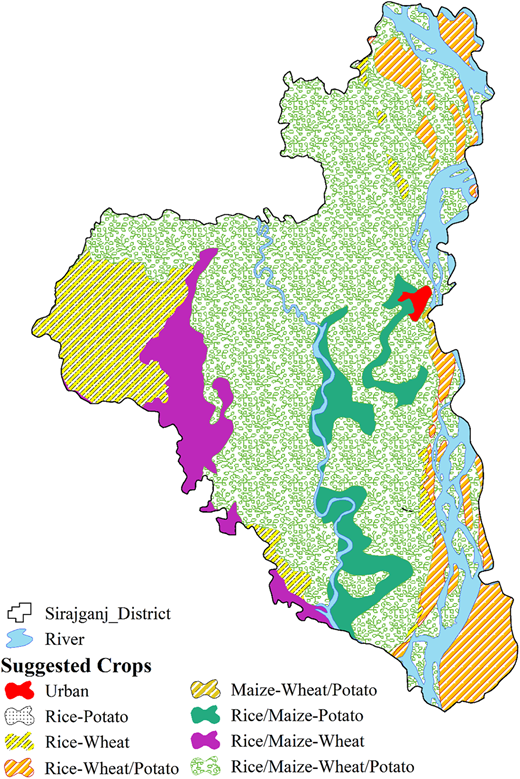
Area statistics of recommended cropping pattern
| Recommended cropping pattern | Area (Acres) | % Of total land | |
|---|---|---|---|
| Kharif (flood season) | Rabi (post-flood season) | ||
| Rice | Wheat | 64258.56 | 11.56% |
| Rice | Potato | 226.3981 | 0.04% |
| Rice | Wheat/Potato | 53881.37 | 9.69% |
| Rice/Maize | Wheat/Potato | 360247.4 | 64.80% |
| Rice/Maize | Wheat | 36940.89 | 6.64% |
| Rice/Maize | Potato | 36934.22 | 6.64% |
| Maize | Wheat/Potato | 1526.075 | 0.27% |
| Urban | 1928.16 | 0.35% | |
Area distribution (in percentage) of different suitability classes with AHP and equal weights
| Suitability class | Rice | Maize | Potato | Wheat | ||||
|---|---|---|---|---|---|---|---|---|
| AHP | Equal weights | AHP | Equal weights | AHP | Equal weights | AHP | Equal weights | |
| Highly suitable (S1) | 9.13 | 0 | 0 | 0 | 0 | 4.7 | 6.64 | 0 |
| Moderately suitable (S2) | 80.96 | 88.6 | 78.2 | 77.8 | 80.71 | 70.9 | 55.91 | 99.7 |
| Marginally suitable (S3) | 9.57 | 11 | 21.46 | 21.9 | 18.94 | 24.1 | 37.1 | 0 |
| Not suitable (N) | 0.35 | 0.3 | 0.35 | 0.3 | 0.35 | 0.3 | 0.35 | 0.3 |
3.4 Sensitivity analysis
The crop suitability analysis produced different results for the suitability classes in the case of each LUT when the sensitivity analysis was conducted using the same weights for all the factors. The result of the sensitivity analysis depicts that for the crops such as rice, maize and wheat, there is no highly suitable area in the district and for potatoes, only 4.7% of the study area is highly suitable. It also depicts that a little portion of the land covering only 0.3% of the study area is not suitable for growing any of the four crops considered in this study. For cultivating rice, 88.6% of the study area is moderately suitable, accompanied by 11% of the area is marginally suitable. For cultivating maize, 77.8% of the study area is in a moderately suitable class, whereas 21.9% of the study area is in a marginally suitable class. Again, 70.9% and 24.1% of the study area is moderately suitable and marginally suitable, respectively, for cultivating potatoes. A vast portion of the study area which covers 99.7% of the land is moderately suitable for growing wheat, whereas no area is marginally suitable for growing the crop in the study area (Table 14).
4. Conclusion
The paper assessed the cropland suitability of Kharif season crops (rice and maize) and Rabi season crops (potato and wheat) and also recommended suitable cropping patterns in the two crop seasons for Sirajganj, a flood-prone district in Bangladesh. The study used AHP and GIS methodology and also considered nine factors which reflected the soil properties of the area. The analysis reveals that 9.13% of the study area is highly suitable for growing rice, whereas no land in the study area is highly suitable for growing maize in the Kharif season. Similarly, 4.7% of the study area is highly suitable for growing potatoes, whereas no land in the study area is highly suitable for growing wheat in the Rabi season. Besides these, for the two Kharif season crops such as rice and maize, the moderately suitable class covers 80.96% and 78.92% of the study area, respectively. On the other hand, for the two Rabi season crops such as potato and wheat, the moderately suitable class covers 80.71% and 55.91% of the study area, respectively. The marginally suitable class covers 9.57%, 21.46%, 18.94% and 37.1% of the study area for rice, maize, potato and wheat crops, respectively. Again, a minuscule piece of the study area, comprising 0.35% of land in the eastern portion of the district, is unsuitable for any of the four crops. Thus, from the crop suitability analysis, it can be concluded that during the Kharif season, the greater portion of the study area is suitable for growing rice and during the Rabi season, the greater portion of the study area is suitable for growing potatoes. Analysis of cropping pattern suitability depicts that a vast portion of the study area covering 64.80% of the total land is suitable for cultivating either rice or maize in Kharif season followed by either potato or wheat in Rabi season. Again, in the western part of the district covering 11.56% of the study area, it is suitable for growing rice in Kharif season followed by wheat in Rabi season. Rice in Kharif season followed by wheat/potato in Rabi season covers 9.69% of the study area extending the eastern border of the district. The suitable cropping patterns of rice/maize-wheat and rice/maize-potato for the Kharif and Rabi seasons, both cover 6.64% of the study area in the western and central part of the district, respectively. Other suitable cropping patterns for the Kharif and Rabi seasons found in the study area are maize-wheat/potato and rice-potato which cover a very little portion of 0.27% and 0.04% of the study area. In the worst-affected regions of the district, floods obliterate entire communities and sweep vast tracts of agriculture into the river. In floods of this magnitude, the deposits are typically infertile sand as opposed to silt, and when the water level recedes, large areas become barren. These outcomes have substantial socioeconomic effects. The results of the study provide information at a local level that could be utilized by farmers to select their cropping pattern in both Kharif and Rabi seasons which will enable sustainable and efficient cropland management, food security and income generation in the area by resolving the flooding issue. Furthermore, the outcomes of this study might be valuable to other researchers, who could apply them to a variety of investigations. The methods used in this research may be applicable for analyzing crop suitability and recommending suitable cropping patterns in other regions at different spatial scales. In this research, only a restricted number of factors were taken into account considering the crop requirements and data availability. For further improvement of the method in the future, more factors such as socioeconomic conditions, irrigation arrangements and other environmental variables can be taken into account in order to get the best outcome. In addition, climate change may have a substantial impact on agricultural output in Bangladesh and the present focus region. Consequently, future research must include the impact of climate change on crop yield.
Declaration of interest: The authors declare that they have no known competing financial interests or personal relationships that could have appeared to influence the work reported in this paper.

