


The purpose of this study is to test and prove how the quality of innate accruals can make a significant contribution to the prospect of future market value for manufacturing industries.
This research used multiple regression method by gathering all observation data on a go public company in the industrial manufacturing sector.
The results of this test can show that the dividend policy helps reduce the use of accruals to increase investor perceptions about the prospects of the company's future period, especially the value of earnings informativeness, including valid information about the actual fundamental conditions. These results reflect high innate accruals quality, so the use of low accruals, especially in reporting earnings.
This test uses a measurement of a constant growth rate with the calculation of the indicator g in the next five-year period, and the proof has secondary data abnormalities reflecting a very high level of variation in the use of accruals. As an implication of the data that is not normal, it causes a large amount of data pruning through outlier tests. Samples that qualify for processing are 180 from 384 data.
By calculating the value of the dividend payout with the growth rate, the estimated future market price can be done with reasonable accuracy.
1. Introduction
Elayan et al. (2016) revealed the phenomenon of an increase in capital market players' demands on the level of quality of financial statements that are getting better, as an implication of helping investors predict future companies. Lebert et al. (2019) declared that the high accruals quality paves out the investor's way to predict the prospect in the future period precisely, including determining the expected return in the future and obtaining the low cost of capital. Eskandari and Foumani (2016) suggested that the influence of useful information reflects the ability of management to influence market reactions, to create a feedback process between management and investors. Dempster and Oliver (2019) revealed that material misstatements of earnings are priced risk factors that have persistent (long-run) impacts on equity returns.
Jonathan and Machdar (2018) had strengthened the previous research, when there is a phenomenon of earnings quality in Indonesia, especially using the high level of accruals. By ignoring the implication of low earnings quality, the management uses the accruals for sending a good signal. Sari and Utama (2014) found that the probability of accruals had existed, it was distinguished by efficient contracting's motive or opportunity behavior. Martínez et al. (2016) stated the management has a proclivity to cover up the high level of accruals by releasing out the meaningless disclosure, it sent out the pseudo signal about the high obedience, because of the high complexity of accounting treatment.
Shah et al. (2010) showed that dividend policy has the benefit of reducing the level of risk and conflict of interest when this policy can encourage increased investor involvement in monitoring the company's operational activities. Chaudhary et al. (2016) showed that as the implication of agency theory, the dividend policy can be used as an indicator to predict the future performance, when the management sent a cash flow signal about the firm on the right track. This reflects that the dividend payout indicator acts as “active signaling” as a sign of management to manage the company for future period, when this policy had fulfilled the investor's expectation, it treated as “good news” (Brav et al., 2005). Lilian et al. (2012) stated that companies tend to implement dividend payout policies to give an excellent signal to the company's prospects, including the ability to expand in the coming period. Harymawan and Nurillah (2017) revealed that corporate reputation has a positive and significant relationship with earnings quality. This indicates that a reputable company will be encouraged to produce an earnings quality in an effort for the company to maintain investor confidence in the company so that the company's image and reputation can be maintained.
Kato et al. (2002) showed that when there was an increase in dividend payments, there was a tendency for an increase in free cash flow, on the other hand, high-yield dividend payments did not reflect an increase in company performance. This one strengthened Ibrahim (2005) when found an implication of opportunistic behavior. Based on average dividend payout ratio for Indonesia listed company in manufacturing industry sector during period 2000–2018 at the level of 28.26%, then the average of growth sales at point 19.21% and net margin profit at point 20.21%, this data pointed out the dividend payout ratio has been higher than the growth of sales and earnings. The management has a proclivity to implement the high-yield dividend policy as the bird in the hand theory, it supported Baker and Powell (2015) and Wardhana et al. (2014), who stated that this policy is used to reduce the level of intensity of agency conflicts. As a phenomenon in the capital market, Nekhili et al. (2016) showed that this empirical testing used the dividend policy as a moderation variable. As a novelty in this research, the indicator for measuring the future prospect is to modify the H model, it called as future market value.
2. Literature review
2.1 Positive accounting theory
Positive accounting theory is very dominant in coloring current accounting research, which is the implication of agency theory explaining the separation between management functions by management and the ownership function by shareholders in a company, including the imposition of agency costs. Watts and Zimmerman (2003) show that there are weaknesses of the normative approach and emphasize the existence of a positive attitude oriented to empirical research in the development of a new future model through three hypotheses, related to positive accounting theory, as follows:
The bonus plan hypothesis
Management companies that have bonus programs related to accounting numbers tend to choose accounting policy procedures that shift reported earnings from the future period to the current period (increasing reported earnings).
(2)The debt covenant hypothesis
Companies that are increasingly approaching violations of debt covenants (debt contract agreements) tend to choose accounting policy procedures that shift reported earnings from future periods to current periods (increase reported earnings).
(3)The political cost hypothesis
The greater the political cost of a company, then management tends to choose accounting procedures that suspend reported earnings from the current to the future period (reduce earnings reported now).
This positive accounting theory is influenced by the assumptions or approach of calculating contracting and monitoring costs associated with the agreed company contract agreement. With the company's engagement with the public and regulatory authorities, it encourages management to be careful in choosing profit reporting procedures, especially in incentive systems, debt agreements and administrative costs. There is a need for management to obtain the approval of shareholders in business development. The determination of accounting policies is a company's need to minimize contract costs.
2.2 Prior research
Martínez et al. (2016) found that management tends to cover up the earnings management by publishing the useless information, this aimed to distract the investor's attention on the actual earnings; finally, the investor could not detect this behavior. Because of opportunistic behavior in inserting misleading information, the chance has been always opened. The corporate governance only reduces this opportunity and could not take this one into zero points; on the other hand, the accruals have been the widely open chance.
Ke (2019) developed a measurement of abnormal accruals with a sample of companies that had problems with shareholders (civil lawsuit action) from 1996 to 2010. Tests showed a negative reaction of shareholders when there were high abnormal accruals when there was bad news in the form of violations of shareholder rights. This illustrates that the quality of corporate performance reporting is low. Shin and Kim (2019) pointed out that accruals quality indicators are the level of management consistency in determining earnings. Investors can react to low earnings quality; this is related to the estimated level of expectations in the coming period, including encouragement for management to perform high earnings quality. Dempster and Oliver (2019) show that investors focus on measuring earnings quality, including negative perceptions of the use of accruals. A positive attitude is seen in positive movements of the market price.
Lilian et al. (2012) show that an internal company pays dividends aiming to provide a signal of attention to avoid personal control and high-quality reporting. The company conducts profit to prevent the entry of other parties to exercise control over the company. Dividends signal the quality of accruals, especially in countries with high and asymmetrical information, a strong desire for destructive actions toward the interests of minority shareholders.
Mahdiye et al. (2013) showed that dividends were closely related positively to fluctuations in stock market prices, where this policy increased accruals quality. Dividends are conducted on companies that have a low level of discretionary accruals when the quality of earnings is high. Dividends reflect the quality of corporate earnings when dividends yield are high, the relationship of dividends to the quality of performance reporting becomes stronger.
Chaudhary et al. (2016) showed that there was a fluctuation in stock prices ahead of the day of the dividend announcement within the 15 days. This research shows asymmetrical information in dividend policy so that it can cause abnormal returns. Fluctuations in market prices show a positive signal to the company's performance, and the market reacts positively to dividend announcements (see Figure 1).
2.3 Framework
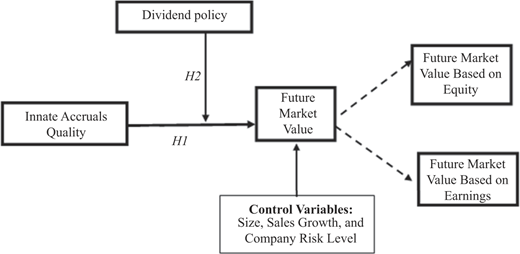
Based on previous research, the following research framework can be designed:
2.4 Hypothesis development
Based on Callao et al. (2016), Elayan et al. (2016) and Bassiouny et al. (2016), the high-quality accounting information plays a critical role to predict the prospect, where the accruals have the effect of the cross period, essentially the accruals quality has the positive effect on the expected return significantly in the future period. Therefore, the development of some hypotheses is organized systematically as follows:
2.4.1 Hypothesis testing with innate accruals quality
Referring to Martínez et al. (2016) and Dichev et al. (2016), the accruals have misleading information and distortion in financial reporting, so the investor has been alert of opportunistic behavior. Shin and Kim (2019), Dempster and Oliver (2019) and Pompili and Tutino (2019) underlined that the high obedience on accounting standard consistently illustrates the real condition; theoretically this research uses innate accruals quality values as an indicator of the company's fundamental ability to maintain the level of existence. Lebert et al. (2019) stated that by using a proxy of earnings quality with innate accruals quality, this value is at a high standard, reflecting the low level of use of accruals. The higher the amount of earnings quality, the higher the accuracy of the prediction of future market value. In this test using two variables of equity value and income level, the hypothesis is carried out in two stages, as follows:
First: The equity value-based hypothesis
By looking over Kojima et al. (2017), the accruals have influenced on the cost of equity negatively, so this research uses the innate accruals quality as an indicator of high obedience in the recording of the market value of company assets (Chiang et al. 2017); this indicates the ability to expand the future performance on the right track. The first hypothesis can be arranged statistically, as follows:
Innate accruals quality has a positive effect on future market value based on equity.
Second: The earnings value-based hypothesis
Referring to Diri (2018) and (Beyer et al. (2019), the management has a proclivity of disseminating the signal effect, so this research uses innate accruals quality as an indicator for the high probability of the better prospect. By carrying out the accounting standard at a high level, the actual earnings can be used to predict the future return accurately, because of the low risk as an effect of high earnings quality. The second hypothesis is arranged statistically, as follows:
Innate accruals quality has a positive effect on future market value based on earnings.
2.4.2 Hypothesis moderation testing with innate accruals quality
By examining Lilian et al. (2012), the dividend has a signal of high obedience on accounting standard, because of the high involvement of shareholders in monitoring and checking the strategic decision. He et al. (2017) found that the relationship between dividend and actual return has a positive effect; it strengthens Lawson and Wang (2016) by stressing on this policy as a guideline for nonmanipulation activity. Considering the advantages of dividend to level up the positive investor's perception maximally, so this research uses this policy as a moderation variable. The hypothesis can be done in two stages, as follows:
First: The equity value-based hypothesis
Eliwa et al. (2016) stated that the accruals have a negative contribution on equity value, and Bushman et al. (2016) underlined that the implication of accruals is on the component balance sheet, the research combined (Deng et al., 2017) when the dividend policy has a positive influence on the management to provide the real performance, especially the value of assets in the future period can be predicted accurately. The third hypothesis can be arranged statistically, as follows:
Dividend policy reinforces the positive influence of innate accruals quality on future market value based on equity.
Second: The earnings value-based hypothesis
Referring to Chansarn and Chansarn (2016) and Chaudhary et al. (2016), the dividend payout ratio is an indicator to estimate the required return in the following period, including the impact on obtaining the low risk and cost of capital. The dividend policy encourages investor involvement in the level of flexibility in accounting records of company performance, so it is a push for management to be prudent in designing the accounting treatment.
When innate accruals quality is in a high position, it helps companies to reduce the use of accruals and improve the quality of company performance reporting. The fourth hypothesis can be arranged statistically, as follows:
Dividend policy reinforces the positive influence of innate accruals quality on future market value based on earnings.
3. Methodology
3.1 Sample and data collection
This study uses purposive sampling, with the criteria of research objects, as follows:
The company makes dividend payments within the observation period.
The company has a positive average annual growth rate between the previous and subsequent periods.
Data collection used in this study is the financial statements of manufacturing companies from 2015 to 2019 taken from Indonesia Capital Market Directory (ICMD). Samples that qualify for processing are 180 from 384 data. We designed average future market value (value based on equity and value based on earnings) over the period with dependent variable and independent variable being innate accrual quality and dividend policies (see Figure 2).

3.2 Future market value
To facilitate the calculation of estimated market prices through the life cycle and multistage growth model, according to Damodaran (2012) with the H (two-stage model for growth) approach, it can be arranged, as follows:
This model is the adoption of the H model (two-stage model for growth):
(1)Estimated period 2018–2019, where the value is:
g = ROE*b, gk = average growth period 2015–2019
k = free risk + beta (market return-free risk) ….. (CAPM Model)
(2)Estimated period 2020–2022 uses the assumptions:
Div20 = Div21 = Div22 and Price20 = Price21 = Price22
The estimated price = Dividend Yield + Capital Gain
Price estimated 16 = Div17 + Div18 + Div19 + Div20 + Price20 for data period of 2015
Price estimated 17 = Div18 + Div19 + Div20 + Div21 + Price21 for data period of 2016
Price estimated 18 = Div19 + Div20 + Div21 + Div22 + Price22 for data period of 2017
The accuracy of the prediction range −2.0 <Tracking Signal <2.5 through indicators of cumulative forecast error and mean average deviation Heizer et al. (2017).
Note: This adopted model from Damodaran (2012)
To measure the positive investor's perception, this research uses the future market value, which can be distinguished by future market value on equity and earnings.
3.3 Future market value based on equity
Future market value based on equity is the development of the yield book instrument model Hu et al. (2015) in calculating the market value of bonds. This ratio illustrates the probability of marketable level in the following period when it indicates the higher ratio (more than zero), absolutely it can be categorized into a marketable share as a good signal to invest in this company. Therefore, the formula is arranged mathematically, as follows:
Future market value based on equity = Equity per share t / Estimated price t + 1 (1)
3.4 Future market value based on earnings
Future market value based on earnings is the development of the calculation of earnings yield instruments, developed by Wilcox (2007) and modified by Abraham et al. (2017) through adjusted earnings yield. This ratio illustrates the probability of liquidity in the following period when it indicates the higher ratio (more than zero), purely it can be categorized into a high liquidity share as a good signal for an investment decision. Therefore, the formulas can be arranged mathematically, as follows:
Future market value based on earnings = Earnings per share t / Estimated Price t + 1 (2)
To understand more the process of calculating all operating variables, the presentation of this measurement can be arranged in Table 1, as follows:
The measurement of operating variables
| Variable | Formula measurement | Scale |
|---|---|---|
| Dependent variable by using the future market value variable estimation indicator measurement | The Estimated Priced = Divt+1 + Divt+2 + … + Divt+5 + PriceTV (1 + k)t+1 (1 + k)t+2 (1 + k)t+5 (1 + k)t+5 Future Market Value On Equity = Equity t / The Estimated Price t+1 Future Market Value On Earnings = Earnings t / The Estimated Price t+1 | Ratio |
| Independent variable with innate accruals quality measurement = (absolute predictive value j, t.) X – 1 | (Accruals Quality)j,t = σ (εj,t) σ (εj,t) = α + λ1 Log (Size)j,t + λ2 σ (Cash Flow Operational)j,t + λ3 σ (Cash Flow Operational) j,t+1 + λ4 σ (Account Receivables)j,t + λ5 σ (Account Payables)j,t + λ6 (Margin Profit)j,t + λ7 (Modal Kerja)j,t + λ8 σ (Fixed Asset)j,t + υj,t | Ratio |
| Moderation variable using the dividend policy indicator | Dividend t = Dividend t / Net Income t-1 Measurement of Period Dividend Policy t and Net Income period t-1 | Ratio |
| First control variable with size | Book Value = Value Total Asset current period Size = Log (Natural Book Value) | Ratio |
| The second control variable with sales growth | Delta Sales = Sales period t - Sales period t-1 Sales Growth t = Delta Sales / Sales (t) | Ratio |
| Third control variable with risk (debt-to-equity ratio) | Total Debt = Short-term Debt + Long-term Debt Then the formula was developed Debt to Equity Ratio = Total Debt Value / Equity Value | Ratio |
4. Analysis and findings
4.1 Primary testing
By doing the statistical testing, the significant level had been treated as one tail form. In doing outlier testing, this testing had the treatment by winzorize model or reduction data with −1.5 > Z Score > 1.5 Gujarati (2004), it is to level up the validity level of regression model. After doing the data panel testing with two models, this research provides the summary in Table 2.
The summary of data panel testing
| The phase-in | FMV on equity | FMV on earnings |
|---|---|---|
| Testing data panel | First model | Second model |
| Chow testing | H0 accepted Common effect model | H0 rejected Fixed effect model |
| Hausman testing | Not done | H0 rejected Fixed effect model |
| Lagrange multiplier testing | H0 rejected Random effect model | Not done |
Based on Table 2, it is pointed out that the data panel for the first model is a random effect model and the second model is the fixed effect model. Therefore, there is no need to fulfill an assumption of classic testing model, because of the highly dispersed distribution data. This supported Lebert et al. (2019) when testing on accruals quality has abnormality distribution because the accruals have so many patterns and many unidentified variables contribute to the pattern of accruals. A model regression has some or more than one coefficient of constant, so this value has a meaningless indicator.
4.2 Model of future market value on equity
Table 3 shows that the independent variables have a simultaneous influence on the dependent variable so that the primary model has a high level of significance. This model meets the predictive modeling requirements.
The regression formulation model
| The independent variables | Future market value based on equity | Future market value based on earnings | ||
|---|---|---|---|---|
| Description | Unstandardized coefficient | Sig one tail | Unstandardized coefficient | Sig one tail |
| 1. Constant | −0.005 | 0.467 | −0.121 | 0.189 |
| The dependent variables | ||||
| 2. Innate Accruals Quality | 0.058 | 0.012 | 0.225 | 0.009 |
| 3. Dividend Pay Out | 0.107 | 0.006 | 0.336 | 0.001 |
| 4. Innate Accruals Quality X DPR | 0.208 | 0.010 | 0.810 | 0.017 |
| The control variables | ||||
| 5. Log Total Asset | 0.006 | 0.014 | 0.027 | 0.011 |
| 6. Growth Sales | 0.027 | 0.007 | 0.021 | 0.003 |
| 7. Risk | −0.129 | 0.001 | −0.243 | 0.016 |
| F Value | 4.123 | 4.399 | ||
| Significant | 0.000 | 0.000 | ||
| F Table | 0.504 | 0.504 | ||
| Adjusted R Square | 0.109 | 0.118 | ||
First: Innate accruals quality against future market value on equity
First model equation: Testing through innate accruals quality
In Table 3, the first model shows the statistical analysis as follows:
The variable innate accruals quality has a Sig level of 0.012 less than the value of 0.058 and a coefficient of positive 0.058, then the H1a hypothesis is accepted. This result reflects innate accruals quality, which has a positive effect on future market value based on equity.
The outcome moderation variable dividend policy with innate accruals quality has a Sig level of 0.010 less than the value of 0.05 and a coefficient of positive 0.208, then the H2b hypothesis is accepted. This shows that dividend policy strengthens the positive effect of innate accruals quality on future market value based on equity.
This test shows that each increase in earnings quality indicators will increase future market value on equity. With high earnings quality, innate accruals quality shows the company's fundamental ability to maintain the level of existence, especially in the pattern of recording the company's book value. In this condition, innate accruals quality shows a form of improvement in the quality of corporate performance reporting for the current period, to increase investor perceptions positively in the coming period. The results of this test strengthen Povolotskaya (2014) regarding the use of accruals to measure company value.
With the high innate accruals quality, the use of low accruals can be ascertained; this has a positive influence on the ability of investors to make future predictions. The results of this test reinforce Ke (2019) regarding the difficulty of predicting future company value when the use of accruals is high. With high-quality accruals reflecting the pattern of recording book values, all company assets have followed accounting standards; this provides a sign that management is doing the right level of asset management, especially the ability to expand the capacity of future periods; of course, this gives a positive perception. With high-quality accruals through the use of low accruals patterns, the estimation of prospects has a high degree of accuracy.
This test shows that the moderating variable dividend policy with innate accruals quality has a positive effect on the future market value on equity. The dividend policy strengthens a positive relationship of improving earnings quality with future market value on equity. The results of this test can show that the dividend policy helps reduce the use of accruals to increase investor perceptions about the prospects of the company's future period, especially the value of earnings information, including valid information about the actual fundamental conditions.
By implementing a dividend policy, investors can calculate market prices for the coming period, so the picture of the company's fundamental situation can be known precisely, including the chances of success in expanding future periods. This test also shows there is a dividend role to reduce the cost of capital so that positive perception becomes a belief, including lowering the level of risk. When dividend policy can strengthen the positive influence of innate accruals quality on future company performance, this result strengthens Myers (2001) and Deshmukh (2005), who say dividend policy helps companies in obtaining funding for business development through getting low capital costs. This moderation model has supported Chaudhary et al. (2016), who mentioned this policy as a valid indicator for investors to trace the actual condition, including the level of business risk.
4.3 Model of future market value based on earnings
Second: Dividend policy moderates the effect of innate accruals quality on future market value on earnings
Second model equation: Testing through innate accruals quality
In Table 3, the second model shows the statistical analysis as follows:
The variable innate accruals quality has a Sig 0.009 level <0.05 and a positive coefficient is 0.225, then the H2a hypothesis is accepted. This result reflects innate accruals quality, which has a positive effect on future market value based on earnings.
The moderation variable between dividend policy with innate accruals quality has a Sig level of 0.017 < 0.05 and a positive coefficient is 0.810, then the H2b hypothesis is accepted. This result shows that dividend policy strengthens the positive effect of innate accruals quality on future market value based on earnings.
This test shows innate accruals quality has a positive effect on the future market (FMV) on earnings. These results reflect high innate accruals quality, so the use of low accruals, especially in reporting earnings. With a profit value that has a high informational value, this helps investors to calculate the expected rate of return with a high degree of accuracy. This test proves Zuo (2015) regarding these accruals, which have a negative effect on the calculation of company profits. Innate accruals quality is a measurement. That indicates the use of accruals in earnings reporting, this testing proves that when the indicators of earnings quality are high, it can be ensured that the quality of reporting is high, including the good management capability for the future period. By having informative earnings that are high, the company will have the convenience to conduct financing; this result proves Johnston (2009), when management can obtain funding easily.
This test proves Shin and Kim (2019) regarding the negative investor responses on the earnings distortions, so there are negative stock price movements. When the investor could have predicted the expected return in the following period with high accuracy, there is a positive investor perception on the actual earnings on the current period (Hu et al. 2015). Innate accruals quality indicators have reflected the management's obedience to carrying out the accounting standard at a high level, the actual earnings give the fundamental condition, including the company's existence in long run; this strengthens Pompili and Tutino (2019).
This moderation variable has a positive effect on future market value, the dividend policy plays a role in improving the quality of accruals, including reducing opportunistic behavior in financial reporting. There is a push to increase the involvement of investors to monitor and check the strategic policy. By leveling up the investor involvement, it encourages management to provide the valid accounting information about the current performance, where it involves the process of sending the valid messages about the fundamental condition, including the company's performance for the coming period. Thus, the results of this test strengthen Mahdiye et al. (2013) regarding the effect of stock prices with earnings reporting. This test shows that the dividend policy can encourage management to improve earnings quality by reducing the use of accruals, especially the valuation of fixed assets.
4.4 Summary of testing analysis
By measuring the company's prospects with future market value as the development of the H growth two-stage model, it shows that by calculating the amount of the dividend payout with the growth rate, the estimated future market price can be obtained with reasonable accuracy. This test proves previous research regarding the quality of performance reporting, as follows:
Pompili and Tutino (2019) have shown that a high level of accruals quality has played a critical influence on the expected return, including the positive movement on market price. There are significant relationships between the earning quality and rate of return during the publication period. The high earnings quality pointed out the high level of implementing the accounting standard at the maximum level of consistency.
Elayan et al. (2016) and Bassiouny et al. (2016) pointed out a strong pressure on management to level up the financial statement's quality. It related to a protective action for investing in a safe area, because of low risk and misleading information. The implication of high reporting quality is to predict the expected return in the following period with high accuracy level.
Dichev et al. (2016) mentioned that management has a strong tendency to send misleading information, so dividend policy can be used as a signal for monitoring the prospect in the future period. This policy drives out the management to level up the obedience on the accounting standard at maximum level; this has supported Nekhili et al. (2016) regarding the structural function of dividend policy.
4.5 Mapping of profit quality with dividend policy
Mapping management behavior and investor reaction through a decision tree model is illustrated in Figure 3 as follows:
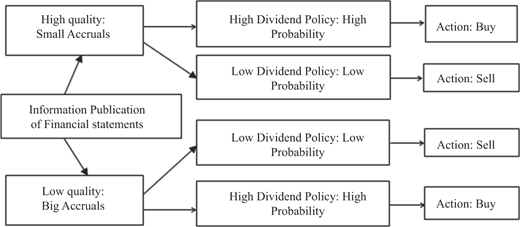
By using the Bayes theorem approach, the opportunity for investor behavior toward the publication of financial statements can be predicted. The development of predictive models for estimating the probability of buying action is organized as follows:
where:
a P(InnQ>) is the probability of innate accruals quality in high level
P(DivT) is the probability of a high-yield dividend being implemented.
P(DivR) is the probability of a low-yield dividend being implemented.
P(InnQ>|DivT) is the probability of innate accruals quality being at a high level when the high-yield dividend has been implemented.
P(InnQ>|DivR) is the probability of innate accruals quality being at a high level when the low-yield dividend has been implemented
P(DivT|InnQ>) is the probability of high-yield dividend being implemented when innate accruals quality is at a high level.
The development of predictive models for estimating the probability of selling, when innate accruals are low, particularly the high-yield dividend has been implemented. This model can be formulated as follows:
where:
P(InnQ<) is the probability of innate accruals quality at a low level
P(DivT) is the probability of a high-yield dividend being implemented.
P(DivR) is the probability of a low-yield dividend being implemented.
P(InnQ<|DivT) is the probability of innate accruals quality being at a low level when the high-yield dividend has been implemented.
P(InnQ<|DivR) is the probability of innate accruals quality being at a low level when the low-yield dividend has been implemented
P(DivT|InnQ<) is the probability of high-yield dividend being implemented when innate accruals quality is in low level.
P(DivT) and P(DivR) indicate a measurement of management probability in implementing the high- or low-yield dividend policy for leveling of the internal conflict. It reflected how the dividend policy plays a role as a communication channel for predicting future performance. The indicator of P(DivT|InnQ) pointed out the probability of obtaining the positive or negative investor's perception of the financial statements' quality when the management implemented the high-yield dividend policy. This research has proven the positive perception of the high innate accruals quality when the accruals are low, the positive perception making a strong pressure on “to sell” much more than a pressure for “to buy.” The management has a proclivity to use the earning quality to change the pressure for “to sell” much less than pressure for “to buy,” including a communication process from “bad news” into “good news.”
5. Conclusion
Based on the testing that has been done, the formulation of conclusions in detail can be presented, as follows:
Earnings quality through innate accruals quality has a positive effect on future market value based on equity and earnings. The existence of this positive relationship reflects an increase in the quality of accruals to help improve the ability of investors to predict prospects with high accuracy level in the future period.
Dividend policies strengthen the positive influence of innate accruals quality, which is significant to future market value based on equity and earnings. The results of this test show that dividend policy encourages management to give a picture of the company's actual fundamental abilities, due to the encouragement of control to have a high level of compliance with accounting standards. With a high level of respect, this high innate accruals quality indicator can increase investors' positive perceptions.
5.1 Research limitation
Based on the previous description, some of the limitations of conducting this research can be arranged as follows:
This test uses a measurement of a constant growth rate with the calculation of the indicator g in the next five-year period.
This test has secondary data abnormalities reflecting a very high level of variation in the use of accruals. As an implication of the data that is not normal, it causes a large amount of data pruning through outlier tests. Samples that qualify for processing are 180 from 384 data.
5.2 Recommendation for future research
Some recommendations for further research are formulated as follows:
In measuring earnings quality for future research, researchers suggest using an approach with probability, especially modeling the predictions of investor reactions to the quality of financial statements. Future models can be developed through the development of nonlinear regression models.
In measuring the level of risk, researchers are aware of several limitations of beta instruments in the measurement of risk levels. In measuring risk in subsequent studies, a more comprehensive risk level calculation can be used to estimate the company's ability to maintain its existence in the long-run development of a prediction indicator of the level of management behavior tendency in publishing financial statements.
We thank all lecturers in Perbanas Institute and Universitas Binaniaga Indonesia for valuable comments, critical and feedbacks.

