


The study aims to analyze and compare the influence of country-specific fundamentals and global conditions on sovereign risk of Sri Lanka within the sample period of 2006–2019 while employing Treasury bond rates as proxy for sovereign risk.
The determinant powers of the variables are assessed using the auto regressive distributed lag (ARDL) model to verify both short- and long-run effects on sovereign spreads.
The study finds that Sri Lanka's sovereign spreads are shaped by both country fundamentals and global factors, though local determinants tend to have greater influence when the directions of coefficients are ignored. While the impact of most variables was in line with the researchers' expectations, fiscal deficit was found to have an unconventional negative coefficient which may be explained by investors' optimistic take on Government's involvement in post-war economic development drive during the sample period, enabling Sri Lanka to attract low-cost funding.
The study excludes of impact of the ongoing coronavirus disease-2019 ( COVID-19) health crisis which may unduly distort the data. Further, the research does not capture the impact of change in sentiment owing to market information, debt dynamics and policy changes in Sri Lanka.
The study reveals that a sound monetary policy directed at preserving both the internal and external value of currency as well as a disciplined fiscal policy are imperative to manage Sri Lanka's sovereign risk, particularly in the face of global uncertainties.
The study adds to the literature by investigating the timely importance of a country's internal fundamentals against the global events. Furthermore, the research would complement the scarcity of research regarding that subject focused on the Sri Lankan economy, capturing the rapid variations in the fundamentals that the country has undergone since the end of the civil war while recognizing the growing influence of globalization over the recent years.
1. Introduction
Ever-rising globalization and continued deregulation of financial markets have made foreign investments increasingly attractive, encouraging global investors to diversify their portfolios particularly into the fast-growing developing nations to make a sizable return while diluting overall risk (Bernoth and Herwartz, 2021). Foreign investments have thus become an integral source of funds that are used in the development process of developing economies and Sri Lanka is no exception.
Sri Lanka has gone through a rapid variation of fundamentals over time since the end of the three-decade-long civil war in 2009 that allowed significant inflows of foreign funds, enabling accelerated growth of the country together with a phase of extensive improvements in infrastructure funded by foreign capital (Weerakoon, 2013). The economic growth averaged at 7.0% from 2006–2012 while the external debt stock tripled in a span of six years, growing from just US$ 12bn in 2006 to US$ 37bn in 2012. However, the growth has moderated to an average of 3.8% since 2013 but the foreign debt stock continued to pile up to US$ 55bn by the end of 2019 (Central Bank of Sri Lanka, 2021a, b), raising the risk level of the country significantly.
Simultaneously, the ever-changing geopolitical trends and volatilities in the global market seem to increase in size and influence. As explained by Daehler et al. (2021), developing countries in particular were faced with several and frequent headwinds in the recent decade, including the Federal Reserve's (FED) taper tantrum that led to a slowdown in emerging markets since 2013, the 2015 oil and commodities shock and the ongoing COVID-19 health and economic crisis, all thanks to the increased flow of cross-border investment and trade.
As the sovereign risk of a country is seemingly reliant on both domestic fundamentals and global market conditions (Maiti, 2019), this context begs the questions as to how much of the dynamics in the domestic fundamentals have influenced foreign investments of Sri Lanka and to what extent the country's risk level and the reflective borrowing cost has been affected by global challenges. This is a particularly important and timely question for Sri Lanka and its significance is most visible in the Government's rupee securities market where the foreign investments increased from just 1.5% of total securities stock in 2007 to 11% by 2012 before its decline to near zero by the end of 2020 [1] while Sri Lanka's international sovereign bonds were trading at highly discounted prices in the secondary market (Central Bank of Sri Lanka, 2021a, b).
While there have been a number of studies on sovereign risk and its determinants, very few have investigated the timely importance of a country's internal fundamentals against the global events affecting all nations alike and differently [2]. The impacts of such factors on Sri Lanka's sovereign risk also have not been sufficiently investigated either – see, for limited examples, Cosset and Roy (1991), Gomez-Gonzalez et al. (2021) and Daehler et al. (2021). This study attempts to bridge the gap by assessing and comparing the impact of the country fundamentals and global factors on Sri Lanka's sovereign risk while using the sovereign bond spread as a proxy.
The rest of the paper is structured as follows. The second section evaluates the past literature that has investigated the risk related to bonds issued by sovereign nations, the determinants of such risk and the validity of the theory related to sovereign risk across the world. The third section describes the proposed model of the study and provides justification for each of the independent variables chosen. The fourth section explains the data used for the model and the methodology employed to analyze the data. The fifth section discusses the empirical findings of the research and the sixth contains concluding remarks.
2. A brief literature review
After the severe financial crises around the world in the 1980 and 1990s, many economists surveyed the reasons for such turbulence and the relevant risk factors, of which sovereign risk plays a significant role. Literature related to the above relationship can be summarized under two themes: providing insight into its theoretical background and demonstrating the empirical evidence of the same.
2.1 Theoretical background
Sovereign risk is a form of credit risk that measures the ability of a sovereign nation to honor its international obligations (Saunders and Cornett, 2007). However, Eaton et al. (1986) and later, Saunders and Cornett (2007) distinguish sovereign risk from general credit risk related to individuals or corporate entities in terms of the lender's inability to seize the assets of a borrower (sovereign nation) in default. Unlike in corporate debt defaults, where the lenders may recover at least some of their money through distributions at liquidation or collateral assets, an investor can do very little to recover his money when it is a country in question. Furthermore, in contrast to corporates that file bankruptcy when their debt obligations far exceed their value of assets, sovereign nations do not become insolvent; in default, the value of the nation's assets are almost always much higher than the sovereign debts.
The theoretical literature on the determinants of sovereign risk can be investigated under two broad categories: country-specific fundamentals and global factors.
2.1.1 Country-specific fundamentals
In early literature, primary determinants of sovereign risk were thought to be represented by a country's macro-economic and political fundamentals. Therefore, any yield differentials among nations were said to reflect the additional risk taken by the investor in investing in a less-creditworthy country with poor fundamentals. As this is similar to a corporate's credit risk, which is essentially determined by the inherent characteristics of the company and its industry, factors contributing to a country's credit risk may also be considered as inherent to it. Hence, generalizing the basic model put forward by Feder and Just (1977) for risk-related interest rate in capital markets, many authors view a nation's sovereign risk as a function of its probability of default and its determinants.
Along the same line of thinking, Avramovic (1966) argue that default is primarily a function of the borrower's ability to generate future cash flows. Unless a country is able to utilize the foreign funds to increase its growth rate above the cost of capital, it will eventually run into default. Eaton et al. (1986) confirms this view by recognizing trade balance and national savings as significant determinants of probability of a country's debt default. The study explains that a nation's foreign debt repayments ) will equal its trade deficit () plus interests on the debt ). Further, the repayment must be made out of the country's government savings and private savings . Formally,
The relationship built upon the above function provides a macro-definition for understanding possible barriers/risks of how a country meets its foreign debt obligations. Nevertheless, the above theory only captures the final effects of the demand-side aggregates on sovereign risk without defining the impacts of policies that actively manage them. In an attempt to close this knowledge gap, Uribe (2002) puts forward the concept of the inevitable trade-off between stabilizing inflation and suppressing default ( Trade-off) according to which policymakers are forced to choose between defaulting its debt payments to achieve price equilibrium and inflating away the real value of its liabilities to avoid sovereign default. Okano and Inagaki (2016) present a third possibility; under Optimal Monetary and Fiscal (OMF) policy, where the monetary authority and the Government seek to minimize the welfare costs, both sovereign risk and inflation may be stabilized simultaneously. These theories broadly capture the effects of domestic contributors on sovereign risk.
2.1.2 Global factors
With expanding global financial interconnectedness, many authors recognize the significant influence imposed by the global developments in determining a country's sovereign risk. Haugh et al. (2009) explain international investments with the primary concept of Theory of Relativity: the costs and/or benefits of investing in one country in relation to another. The study conceptualizes that sovereign risk premium is decided by both credit risk of a country – determined mostly by country fundamentals – and to a lesser extent by liquidity risk (degree of an asset's tradability) that arises due to the mere presence of alternatives in the international market. Thus, liquidity risk is inversely proportional to the market size as the larger the market, the higher the number of participants and transactions.
The liquidity risk also has a time-specific characteristic where, in times of volatility, risk-averse investors' preference for illiquid (risky) assets such as private investments or emerging market debts would deplete and assign a higher premium for their perceived risk (Vayanos, 2004). This behavior is also known as flight-to-liquidity (or flight-to-quality/safety). Accordingly, in the event of adverse global developments, the investors would become more risk-averse and move their funds to safe havens (less risky economies like the USA), expecting moderate returns at lower-risk levels. This may eventually raise the demand for bonds in less-risky countries and force down the bond rates, leading to an increase in sovereign risks of developing countries – in spite of their constant and steady macro-economic fundamentals throughout the period (Nogués and Grandes, 2001).
On the other hand, Tobin (1958) identifies that the developed countries could autonomously influence the risk level of developing countries by way of their policy decisions – a phenomenon explained by extending the substitution effect. Diminishing supply of investment funds would then raise the sovereign risk levels (Nogués and Grandes, 2001). Likewise, a reduction in risk-free rates will dilute the risk-averseness of the investor, encouraging search-for-yield – higher-yielding assets with lower-credit quality. These theories emphasize the impact of economic developments in industrial countries and economic interconnectedness on the sovereign spreads of emerging markets.
2.2 Empirical literature
Edwards (1984) is one of the earliest known empirical studies that surveyed on the country's risk of borrowing nations. Despite acknowledging their insufficiency in explaining the whole of spread variations, the study concludes macro-economic fundamentals to be the major determinant of country's risk. His conclusion was supported by Cantor and Packer (1996) and Calvo and Mendoza (1999), as those studies find sovereign ratings, which measure sovereign risks of countries, to be broadly consistent with the macro-economic fundamentals of a country. Haugh et al. (2009), a study conducted during the period of the global financial crisis (GFC), finds that country performance, both past and expected, tend to be crucial during times of crises, thus emphasizing the ability of country fundamentals to overpower the global volatilities. Bernoth and Erdogan (2010) and more recently Fedderke (2021) clarified that even in the time of stability in the global environment, investors are largely concerned about country fundamentals.
In contrast to these findings, Cosset and Roy (1991), a study that included Sri Lanka in its sample, finds that global conditions and market sentiment tend to overpower the effects of economic fundamentals on spread movements over time. This thesis is supported by Ciarlone et al. (2007) and González-Rozada and Yeyati (2008), whose studies find that the sizable fraction of the bond spread variability in emerging markets is owing to the evolution of global scenarios reflected by global liquidity, risk-appetite and contagion from systematic events. Further evidence was found more recently by Stolbov (2016), Bernoth and Herwartz (2021) and Cerutti et al. (2019) in studies which conclude that global financial conditions are gaining more importance in the dynamics of sovereign spreads. In fact, Cerutti et al. (2019) goes on to explain that though global factors do not affect all nations equally, the impact depends on their level of exposure and access to global financial channels and macro-fundamentals have little influence over the perceived level of risk.
In the light of growing financial crises emerging on national, regional and global levels, researchers have attempted to identify time-varying characteristics of the two major types of determinants. Studies such as Hilscher and Nosbusch (2010), Csonto and Ivaschenko (2013) and Dachraoui et al. (2020) argue that global factors tend to be the major determinant of sovereign spreads in the short run, though they agree that country fundamentals are more likely to shape the spreads and related risk in the long run. In a more recent investigation, Ordoñez-Callamand et al. (2017), together with Özatay et al. (2009) and Dumicic and Rizdak (2011), conclude that country fundamentals are not a significant predictor of long-run sovereign spreads but are shaped by global factors.
Contrastingly, Aizenman et al. (2016) find that the latest financial crises have shifted the importance from external factors to internal fundamentals that would give sufficient capacity to adjust to adverse shocks. These findings were echoed by Daehler et al. (2021) in the most recent study amid the COVID-19 global pandemic, where sovereign spreads of the emerging markets were found to be largely driven by the nations' macro-economic stability and the strength to absorb shocks even during the health emergency that brought the entire world economy to a halt within a matter of months.
Regardless of the countless number of articles that contribute to the subject, the primary determinant between the two categories still remains inconclusive. In addition, there appears to be very few studies that have included Sri Lanka in the sample for their investigation on sovereign credit risk and its determinants. Thus, this research attempts to fill this gap and provide evidence with regards to the same while evaluating the validity of the prior theories in the Sri Lankan context.
3. The proposed model
Prior studies have incorporated a variety of variables for their investigations under the two broad categories of determinants: country-specific fundamentals and global factors. The variables are selected for this research based on their relevance and applicability to the Sri Lankan context and the availability of data. The rationale for the selection of each variable is elaborated below.
3.1 Country-specific fundamentals
Rising debt with no corresponding rise in growth is a key sign of future default – leading to widening spreads (Dumicic and Rizdak, 2011). Accordingly, many scholars [3] have used debt-to-GDP (gross domestic product) as a primary measure of a country's debt sustainability and default risk.
Meanwhile, numerous studies reveal evidence suggesting the positive association between debt levels and sovereign risk to be dependent upon expected fiscal deficit, as financing government budget deficit is one of the primary reasons for government debt requirements (Nogués and Grandes, 2001; Haugh et al., 2009; Gomez-Gonzalez et al., 2021). It also indicates a government's willingness and ability to meet its present and future debt obligations.
Although empirical evidence relating to its significance remains inconclusive, external trade deficit is another important cause of foreign debt obligations. Edwards (1984) and, subsequently, Presbitero et al. (2016) cite evidence for significant positive influence of current account balance over sovereign spreads, while Nogués and Grandes (2001), Ciarlone et al. (2007) and Fedderke (2021) find no significant influence. Nevertheless, given Sri Lanka's less-developed status and long-lasting trade deficit, it has been decided to include trade deficit as an independent variable in the proposed model.
As a country that is heavily dependent upon imports while running large trade deficits, the foreign reserves ratio is an important liquidity indicator measuring its ability to pay for foreign goods imported for consumption and investments. As such, Ciarlone et al. (2007), Petrova et al. (2010) and Daehler et al. (2021) find a significant negative association between foreign reserves ratio and perceived default risk. In that light, a country's exchange rate also plays an important role. Depreciation or devaluation of a currency would increase the local currency cost of foreign debt and thereby reduce the debt service capacity of a country, resulting in declining investor confidence and widening of spreads and vice versa (Ebner, 2009; Bernoth and Herwartz, 2021; Fedderke, 2021; Gomez-Gonzalez et al., 2021).
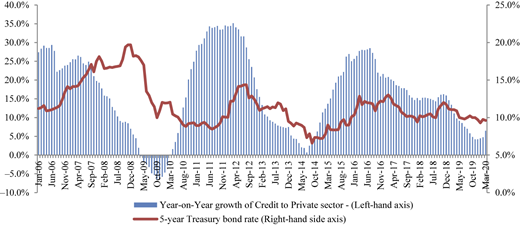
In determining sovereign credit risk, domestic financial conditions play a crucial role as well. Mian and Sufi (2018) explains that excess in the financial system or a “savings glut” could lead to a higher-credit supply and a decline in domestic interest rates with income inequality exacerbating the effect – leading to higher spreads. Investigating into the matter further, Brůha and Kočenda (2018) argues that expansion of private sector credit beyond a certain threshold can raise the sovereign risk significantly, particularly via channels of bank crises, adjustment of banks' balance sheets and credit-led economic growth. This seems particularly true in the case of Sri Lanka, as private sector credit is seen to lead the movements of the domestic risk-free rate (Figure 1).
In addition, it is expected that rising inflation would raise the country's risk. Empirical evidence finds a significant positive association between inflation and sovereign spreads (Dumicic and Rizdak, 2011; Csonto and Ivaschenko, 2013; Fedderke, 2021). Inflation has been included in the proposed model of this study too, as it seems to play a crucial role in determining sovereign spread in the Sri Lankan context.
3.2 Global factors
As a measure of the substitution effect [4], global liquidity captures the effects of both monetary policy actions by major central banks in the world and the reactions of the international investors. Several studies have found a positive association between global liquidity and spreads (Kodres et al., 2008; Cerutti et al., 2019). However, Min (1998) and Nogués and Grandes (2001) discovered evidence to suggest no substitution effect, as the variable was found to exert significant negative influence over sovereign spreads.
Global volatility is another factor that may capture investor risk-aversion sentiment. Though many a studies have found evidence in favor of the flight-to-safety theorem [5], Gadanecz et al. (2018) and Miyajima et al. (2015) find that after the 2008 GFC, the direction of the association has changed, especially since the crisis emerged from the “safe haven,” the USA market.
The macro-economic conditions of the advanced economies, particularly the USA, often affect the rest of the world considerably, prompting a number of researchers to study the impact of USA monetary policy on bond spreads of other nations and regions. Kodres et al. (2008) reveals a significant positive effect of USA monetary policy on emerging market spreads as explained by the substitution effect. However, Csonto and Ivaschenko (2013) and Daehler et al. (2021) find that in times of global volatility, easing of monetary policy in the USA is strongly related with rising spreads encouraging further flight-to-safety.
Although the directions of association to be expected by these variables are ambiguous, all three variables seem to play a significant role in explaining a country's sovereign risk and, therefore, have been included in the proposed model.
Consequently, the following functional relationship can be established to meet the objectives of the study:
Here, sovereign risk () is illustrated as a function of country-specific fundamentals () and global factors (). The selected variables under each category are as follows:
Country fundamentals are represented by a country's fiscal balance (), the indebtedness of the Government (), the domestic credit cycle (), Current Account balance () the foreign exchange reserves position (), exchange rate () and inflation rate (). The global situation is characterized by global risk-free rate (), global liquidity (), investor risk aversion and global volatility (). Accordingly, sovereign risk may be presented as follows:
The following basic regression model is used to represent the relationship between the dependent variable (sovereign risk) and independent variables (country fundamentals and global factors):
Sovereign risk is expected to be positively related to inflation rate (), exchange rate (), government debt position () and its fiscal deficit () and investor risk-aversion (). This is because the increase in these factors would reflect macro-economic instability of the country and/or reduce utility derived from high-risk–reward investments, leading to rise in the perceived risk. The relationship also demonstrates negative association of sovereign risk with the foreign exchange reserves position () and current account balance () and the improvements of which would reflect the country's growing ability to meet its foreign obligations. The expected signs for private sector credit growth (PC), global liquidity () and global risk-free rate () are ambiguous and dependent upon the circumstance as explained in the literature review.
4. Data and methodology
4.1 Data
For the purpose of the study, monthly data are used for the selected sample period from 2006 to 2019, which are limited by the availability of data and the change in bases for certain indexes where rebasing calculations may alter results. The most recent year 2020 has been omitted owing to the extraordinary event of the COVID-19 health crisis and the related economic impacts which may unduly distort the data. Nevertheless, the period fully captures several major incidents domestically as well as globally, including the end of the three-decade civil war and the 2008/2009 global financial recession.
As mentioned earlier, in the model, sovereign risk is proxied by sovereign bond spread, which is generally measured as the difference between a country's ten-year sovereign bond rate and the USA ten-year Treasury bond rate. However, as Sri Lanka's ten-year Treasury bond is traded rarely in the secondary market, this study has replaced the ten-year bond rate with the five-year bond rate of both Sri Lanka and the USA. As such, Equation (5) will be estimated using five-year spreads () as the dependent variable.
In the study, fiscal balance as a percentage of () is expected to represent the financial discipline of the country's rulers, which determines the ability and willingness of the Government to meet the external obligations. The Government's debt position is measured against () to represent the country's ability to settle its liabilities by generating sufficient resources. Growth in credit to private sector (PC) is expected to capture the movements of the credit cycle and domestic financial stresses owing to overheating of the economy. Inflation () and exchange rates () represent the movement of the internal and external value of the rupee. is used in absolute terms to represent Sri Lanka's ability to earning foreign exchange. The foreign reserve variable as a percentage of imports () represents the country's ability to pay for its foreign goods and services. The USA Federal funds target rate () is used to measure USA monetary policy changes and its impact on domestic sovereign spreads, while investor risk-aversion/global volatility is proxied by the Chicago Board Options Exchange Volatility Index (also known as ), which is a market estimate of future global volatility. The global liquidity position is measured based on the ten-year Treasury bond rates of the USA ().
This research uses secondary data extracted from several sources depending on their availability and accuracy. The main data sources for domestic indicators were the Department of Census and Statistics and the Central Bank of Sri Lanka. The global data, including USA Treasury bill rates, were extracted from the Federal Reserve Bank of St Louis and Investing.com, while the Volatility S&P 500 was extracted from Yahoo Finance.
4.2 Econometric method
The study uses the ARDL bounds test, introduced by Pesaran and Shin (1998), to test for long-run association between the selected variables. The main advantage of the ARDL technique is that it allows cointegration analysis between the time series variables regardless of whether variables are I(0) or I(1), unlike most cointegration techniques which require variables to be integrated of order one. Additionally, ARDL has the facility of automatically capturing the sufficient number of lags required to test the model better (Laurenceson and Chai, 2003), while also including a dynamic error correction model (ECM) that “integrates the short-run dynamics with the long-run equilibrium without losing long-run information” (Shrestha and Chowdhury, 2007, p. 15). Furthermore, ARDL technique estimates small sample data sizes, such as in this study, more efficiently than other techniques (Sehrawat and Giri, 2015).
The unrestricted error correction equation for ARDL model is indicated by Equation (6) as follows;
The first part of Equation (6) with coefficients δ0, δ1, … δ10 represents the long-run relationship, while the terms with the summations show the short-run relationship. The joint null hypothesis (H0) that there is no long-run relationship is represented as follows: .
5. Empirical findings and discussion
5.1 Preliminary analysis
The monthly data include 168 observations. According to the descriptive statistics [6], the mean values are below ten due to data transformation, except for CA, EXR and global volatility (VIX), which are large values to begin with. The standard deviation values of the data series are rather small for most variables, meaning the data are closer to the mean value. The highest deviations are recorded in current account balance and exchanges rates, which are 19,527 and 22.07, respectively. The skewness coefficients of most variables are within the range of +1 and −1, except for 5-month spreads (SP5), Debt-to-GDP, INF, Fed fund rates (FED) and VIX that are positively skewed.
A correlation analysis [7] conducted prior to testing for the hypothesis indicated that the correlations between the explanatory variables were not significant enough to exclude any of the variables from the study. Based on augmented Dickey–Fuller unit root test (ADF) conducted under Schwartz information criteria (SIC), five of the independent variables, namely, CA, foreign reserves (RES) position (in terms of import cover), Debt-to-GDP ratio (DEBT_GDP), FED and VIX indicator, are found to be I(0), while the other independent variables are I(1). The results of the unit root test are reported in Table 1;
Stationarity of data
| Variable | ADF stats for levels | ADF stats for first differences |
|---|---|---|
| SP5t | −1.89 | −11.15*** |
| FISDt | −1.91 | −10.47*** |
| EXRt | 0.63 | −7.85*** |
| INFt | −2.03 | −8.06*** |
| PCt | −2.09 | −6.36*** |
| RESt | −3.01** | −6.97*** |
| CAt | −4.25*** | −6.80*** |
| DEBT_GDPt | −5.57*** | −21.13*** |
| FEDt | −3.83*** | −6.05*** |
| US10t | −1.86 | −12.24*** |
| VIXt | −3.29** | −10.61*** |
Note(s): ***, ** and *, denote the statistical significance at the 1, 5 and 10% significance levels, respectively
However, the traditional unit root tests such as ADF are found to have low power and any corrections in the data based on the above results may not give out an accurate picture of the relationship between dependent and explanatory variables (Shrestha and Chowdhury, 2007). Consequently, the data were used without any corrections as facilitated by the ARDL model.
5.2 Empirical findings and discussion
In the study, the researcher has estimated the ARDL model based on SIC to find the optimal number of lag terms of both the regress and the regressors as restricted by the number of observations available. The statistics of the goodness-of-fit of the model reported in Table 2 suggest that the ARDL model has a very high-explanatory power with high-joint significance of the parameters. As per the bounds test (Pesaran et al., 2001) results of which are reported in Table 3, the computed F-statistic of 5.42 exceeds the upper bound for critical values at 99% confidence level (3.61) by a sufficient margin, suggesting a long-run cointegrating relationship among the variables in the model.
Summary of ARDL equation
| R2 | 95.51% |
| Adjusted R2 | 94.99% |
| F-statistic (p value) | 185.02*** |
Note(s): *** denotes the statistical significance at 1% significance level
ARDL bound test results
| Computed F-statistic | Asymptotic critical value bounds for F-statistic | |||
|---|---|---|---|---|
| 95% | 99% | |||
| 3.44 | I(0) | I(1) | I(0) | I(1) |
| 1.98 | 3.04 | 2.41 | 3.61 | |
The long-run results of the ECM, which are summarized in Table 4, reveal that INF is highly significant at 1%, VIX and US10 show significance at 5% level and RES show marginal significance at 10% level. Beyond these, none of the other independent variables was found to have significant influence over the dependent variable SP5.
Long-run coefficients
| Variable | Coefficient | t-statistic |
|---|---|---|
| CA | 2.47-E−05 | 1.575277 |
| DEBT_GDP | 0.913706 | 1.487405 |
| EXR | −0.020143 | −0.851741 |
| FED | 0.109787 | 0.261817 |
| FISD | −0.126456 | −1.087990 |
| INF | 0.363592*** | 5.630947 |
| PC | 0.028465 | 0.863748 |
| RES | −0.638784* | −1.795792 |
| US10 | −1.743958** | −2.380898 |
| VIX | 0.114987** | 2.415189 |
| C | 6.060299 | 1.067143 |
Note(s): ***, ** and *, denote the statistical significance at the 1, 5 and 10% significance levels, respectively
Both the negative coefficient of the US 10-year rate (global liquidity) and the positive coefficient of VIX may be explained by the flight-to-safety theorem as the sample period under consideration captures the 2008/09 GFC. Rising volatility in the global market, as was seen during the GFC, dilutes risk-appetite of investors, moving them toward safer investments (such as the USA Treasury bonds) and away from relatively risky investments (such as Sri Lankan securities market) while reducing the overall global liquidity level. This leads to an increase in the spreads (and overall risk level) of risky assets. As volatility subsides, investors return to riskier investments for better yield, lowering their prices and narrowing their spreads. The expansion in global liquidity level, as was done through quantitative easing programs by the major central banks since GFC, also increases the funds available for investments in risky assets which contribute to reduce the spreads. Accordingly, global liquidity is found to have an inverse relationship with sovereign spreads of Sri Lanka, while global volatility seems to have a positive correlation with the same. These results corroborate the findings of Min (1998), Kodres et al. (2008), Petrova et al. (2010) and Daehler et al. (2021).
The strong positive correlation found between inflation and sovereign spreads provides further evidence of the significance of price levels as an indicator of macro-economic stability and growth of an economy (Fischer, 1983). In the case of Sri Lanka, the point-to-point inflation rate has ranged between 1 and 26% and moves together with the business cycle. Given such fluctuation, movement of price levels is considered a key indicator of the economic trends by investors and policymakers alike (Athukorala et al., 2017). Rising inflation rate would signal an overheating of the economy which would raise its country's risk level and widen the sovereign spreads – and vice versa. Several studies, such as Dumicic and Rizdak (2011), Csonto and Ivaschenko (2013) and Fedderke (2021), have found similar results.
Negative impact of FES too is as anticipated: growth in reserves-to-import ratio (RES) reflect increased debt service capacity and thereby reducing the sovereign risk level. These findings are in line with those of Ciarlone et al. (2007), Petrova et al. (2010) and Presbitero et al. (2016).
In spite of the rapid growth and political stability achieved following the end of the civil war, most of the variables indicating these substantial developments in country fundamentals do not seem to affect sovereign spreads of the country in the long run.
The short-run coefficients of ECM given in Table 5 confirm that INF, US10 and VIX are significant determinants of sovereign spreads in the short run too. The significant short-run association of the above variables may be explained by higher-financial integration among economies which allows faster capital mobility and expedites crisis contagion (Ahrend and Goujard, 2014).
Short-run coefficients
| Variable | Coefficient | t-statistic |
|---|---|---|
| D(CA) | 4.86E-06 | 1.552731 |
| D(DEBT_GDP) | 0.017947 | 1.392754 |
| D(EXR) | 0.066535* | 1.959259 |
| D(EXR(-1)) | 0.057892* | 1.711771 |
| D(FED) | 0.021565 | 0.267489 |
| D(FISD) | −0.010749 | −1.181610 |
| D(FISD(-1)) | −0.024352** | −2.599209 |
| D(PC) | 0.005591 | 0.923913 |
| D(INF) | 0.071419*** | 4.003410 |
| D(RES) | −0.125474 | −1.478635 |
| D(US10) | −0.342559** | −2.411219 |
| D(VIX) | 0.047549*** | 4.402428 |
| D(VIX(-1)) | 0.027635** | 2.475431 |
| Error correction term | −0.196426*** | −6.657561 |
Note(s): *** and **, denote the statistical significance at the 1 and 5% significance levels, respectively
In addition, the first lag of fiscal deficit [FISD (−1)] and EXR also show significance at 5 and 10% levels, respectively. However, the negative coefficient of fiscal deficit is against the researcher's expectations. This would mean that increase in fiscal deficit at a faster pace than GDP would be viewed as less risky by the investors, which is contradictory to orthodox economic view. A similar paradoxical result was found by Goyal (2004), where he identified that higher-fiscal deficit may not necessarily lead to higher-interest rates if sufficient liquidity is allowed in the market by an expansionary monetary policy or consistent capital inflows. Meanwhile, Gruber and Kamin (2012) cites that an economy's expected growth performance and political stability may result in a negative correlation between fiscal deficit and sovereign spreads. The above may explain the findings of this study as well. Since the end of the civil conflict in 2009, the then Government embarked on a public investment-led mega infrastructure program, most of which were debt-funded, that “pushed new money into the economy” (Weerakoon, 2013). Given the post-war prospects and the Government's apparent commitment toward rapid progress, the economy attracted increasingly more foreign funds into the capital market as well. As such, the growth momentum driven by an apparently inevitable fiscal deficit may have led to a perceived reduction in sovereign risk in the short run.
Regardless, the positive coefficient of direct quotation of the USD/LKR exchange rate is in line with the researcher's expectations. The continuous deterioration of the external value of the currency compromises the debt repayment ability at present and exposes the Government to higher future cost of capital (Ciarlone et al., 2007). Similar results were found in more recent studies such as Aizenman et al. (2016), Bernoth and Herwartz (2021) and Fedderke (2021).
The negative and statistically significant adjustment parameter, which lies between −1 and 0, provides further evidence of a long-run cointegrating relationship among the variables in the model (Banerjee et al., 1998). More specifically, nearly 20% of the previous period's deviation from the long-run equilibrium is corrected during the present period. Finally, an attempt has been made to compare the impacts of local and global determinants of sovereign spread in Sri Lanka. The ARDL model has been reestimated using standardized variables for this purpose. INF was found to be highly significant at 1%, while the first and the second lags of FISD were significant at 5% among the local factors. Out of the global factors, VIX was significant at 1%, while US10 and the second lag of VIX were significant at 5% level. To see whether there is a significant difference between the impacts of local and global factors, the following two null hypotheses are tested using the Wald test:
where represents the relevant coefficient in both cases.
The first hypothesis (H1) states that the difference between the sum of the absolute values of local and global factors is not different from zero. As Table 6 depicts, the hypothesis is rejected at a significance level of 1%. More importantly, the difference between the two sums is positive, meaning that if the signs of the coefficients are neglected, the impact of local determinants on the sovereign spread is more significant than the impact of global determinants on the same.
Summary of residual diagnostic tests
| Test | Test statistic (probability) | Decision |
|---|---|---|
| Breusch-Pagan-Godfrey: Observations*R2 | 15.23 (0.5792) | No heteroscedasticity |
| Glejser: Observations*R2 | 0.88 (0.5993) | No heteroscedasticity |
| LM test: Observations*R2 (2 lags) | 0.56 (0.7560) | No serial correlation |
| Ljung–Box (12 lags) | 15.24 (0.288) | No serial correlation |
| Ramsey RESET | 0.52 (0.5956) | Model is correctly specified |
The second hypothesis (H2) states that the difference between the absolute values of the sums of local and global factors is not different from zero [8]. The results in Table 6 show that the hypothesis is not rejected, which means that when the signs of the coefficients are taken into account, the impact of the local factors is almost totally offset by the impact of the global factors leaving no net impact on the sovereign spread.
5.3 Diagnostic tests
As evidenced by the results of Breusch–Pagan–Godfrey and Glejser tests in Table 7, the residuals are free from heteroscedasticity. Results of the serial correlation Lagrange multiplier (LM) test at two lags reveal the absence of autocorrelation among residuals. Insignificant Ljung–Box statistic at 12 lags corroborates the results of the serial correlation LM test. The results of the Ramsey RESET test imply that the model has been correctly specified.
Test results of H1 and H2
| Hypothesis | Wald statistic | Prob | Decision |
|---|---|---|---|
| H1 | 5.527346 | 1.429e-07 | Rejected |
| H2 | 0.836397 | 0.4043 | Not rejected |
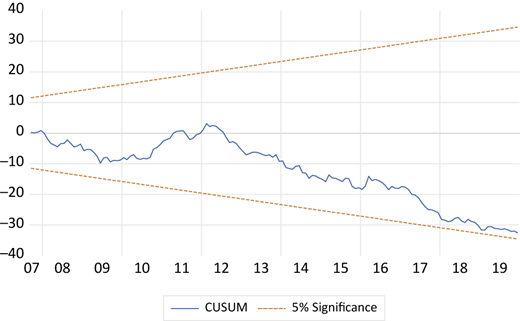
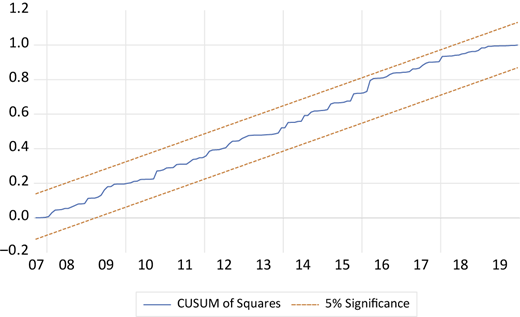
The model was also tested for parameter stability using recursive estimates based on the cumulative sum of recursive residuals (CUSUM) test and cumulative sum of squares of recursive residuals (CUSUM of squares) test. Figures 2 and 3 indicate that the plots of the test statistics do not cross 5% critical lines throughout the period considered. The implication is that structural breaks are unlikely, and the parameters are more likely to remain fixed during the entire sample period.
6. Concluding remarks
This study investigated the impact of country-specific fundamentals and global factors on sovereign risk of Sri Lanka. The results reveal that country-specific fundamentals exert some influence over the sovereign spreads. However, from the seven variables chosen to represent country-specific fundamentals, only four variables have significant influence on spreads, namely, INF, fiscal deficit, RES and EXR.
The spreads are mostly sensitive to inflation rate fluctuations and the overall influence is positive as anticipated. The negative long-run association of foreign reserves, which reflects the country's debt service capacity, is as expected as well. Fiscal deficit and exchange rate seem to be exerting significant influence only in the short run. The positive direction of the influence of exchange rate is in agreement with prior findings and the researcher's expectations. However, the negative coefficient of fiscal deficit is contradictory to conventional theory. It must be noted that the sample period of this study captures a significant period of post-war development with the GDP growth reaching as high as 9.1% in 2012. As explained by Gruber and Kamin (2012), the considerably high fiscal deficit, which funded an economic development drive, combined with post-war confidence may have enabled Sri Lanka to attract low-cost funding, leading to narrow sovereign spreads.
Two of the three variables representing global factors, namely global liquidity and VIX, are found to exert significant influence on overall sovereign risk in both short and long run. This may be reasoned by the overlap of the sample period with the GFC in 2008. The negative coefficient of global liquidity, proxied by US 10-year rate, is argued to reflect the flight-to-safety behavior of investors, especially considering global financial market situation during the sample period under concern. The positive influence of VIX may be attributed to GFC captured in the sample period. Additionally, this study finds that when the directions are neglected, the impact of local determinants on Sri Lanka's sovereign spread is more significant than the impact of global determinants on the same. However, when the directions are taken into account, the impacts of local and global determinants seem to have mutually canceled out leaving no net effect on sovereign spread.
This study has very important policy implications. As Sri Lanka faces yet another balance of payment crisis amidst the COVID-19 related health crisis, the importance of strengthening its macro-economic fundamentals cannot be stressed enough. This weighs down particularly on the key demand policies. A sound monetary policy directed at preserving both the internal and external value of the currency as well as a disciplined fiscal policy are imperative for Sri Lanka to emerge from its current crisis situation.
The study is limited by its exclusion of the most recent year 2020 owing to the ongoing extraordinary event of the COVID-19 health crisis and its related economic impacts which may have unduly distorted the data. This may be an interesting area for further exploration to consider the spill-over effects of the global health emergency that affected all countries but, apparently, to different degrees. Further, this research does not capture the impact of market sentiment owing to changes in sovereign credit ratings as well as market information which seem to have played a role in the trading prices of Sri Lanka's dollar bonds in the secondary market (Central Bank of Sri Lanka, 2021a, b). Investigating the sovereign risk determination in relation to the debt dynamics of Sri Lanka (by debt type and ownership) as well as the drastic changes in policy regimes (in relation to exchange rate, public debt and fiscal rules) over the years may also be a useful avenue for future exploration.
Notes
The most recent year 2020 has been omitted from the study owing to the ongoing extraordinary event of the COVID-19 health crisis and the related economic impacts which may unduly distort the data.
This debate has been recent, since the close recurrence financial crises owing to contagion effect and examples range from Hilscher and Nosbusch (2010), Aizenman et al. (2016) and Daehler et al. (2021).
Eichengreen and Mody (1998), Hilscher and Nosbusch (2010), Bernoth and Herwartz, 2021 and Fedderke (2021) observe that countries with rapid growth rates tend to face lower spreads as it reflects improvements in their debt servicing capacity. This effect is captured by sovereign ratings, as rising GDP growth and decline in debt levels lead to improved ratings and upgrades, implying reduced country risk level (Cantor and Packer, 1996).
Substitution effect related to global liquidity states that the greater the liquidity, the higher the ability for investors to move from one investment opportunity to another, leading to lower-asset prices and higher yields in the exiting market.
Flight-to-safety refers to the phenomenon that rising volatility dilutes the risk-appetite of investors, moving them toward safer investments (see e.g. Grandes, 2007; Ciarlone et al., 2007; Petrova et al., 2010; Cerutti et al., 2019).
See Appendix 1.
See Appendix 2.
Given that the sum of the global factors is negative, this is equivalent to .
References
Appendix 1
Descriptive statistics of the variables
| Mean | Median | Max | Min | Stand. Dev | Skewness | Kurtosis | |
|---|---|---|---|---|---|---|---|
| SP5 | 9.504 | 8.935 | 18.136 | 4.806 | 2.684 | 1.007 | 3.6485 |
| CA | −24,524 | −23,746 | 32,347 | −64,232 | 19,527 | 0.087 | 2.6917 |
| DEBT_GDP | 0.841 | 0.849 | 0.956 | 0.526 | 0.054 | −1.010 | 8.6615 |
| EXR | 130.275 | 129.245 | 182.128 | 102.146 | 22.071 | 0.783 | 2.6544 |
| FISD | −0.072 | −0.068 | 0.064 | −0.192 | 0.041 | −0.011 | 3.6699 |
| GDP | 0.055 | 0.062 | 0.086 | −0.002 | 0.024 | −0.593 | 2.1739 |
| INF | 0.074 | 0.059 | 0.282 | 0.007 | 0.057 | 1.763 | 5.9080 |
| PC | 0.165 | 0.159 | 0.352 | −0.066 | 0.107 | −0.161 | 2.1634 |
| RES | 4.117 | 4.200 | 6.400 | 1.200 | 1.114 | −0.270 | 2.9646 |
| FED | 1.284 | 0.230 | 5.260 | 0.070 | 1.693 | 1.394 | 3.5910 |
| US10 | 2.869 | 2.633 | 5.145 | 1.463 | 0.980 | 0.696 | 2.5095 |
| VIX | 18.797 | 16.227 | 62.639 | 10.125 | 8.662 | 2.498 | 10.9581 |
Note(s): Author's construction: 168 observations
Appendix 2
Correlation between variables
| SP5 | DEBT _GDP | EXR | INF | PC | RES | FED | US10 | VIX | |
|---|---|---|---|---|---|---|---|---|---|
| SP5 | 1 | ||||||||
| DEBT | 0.0554 (0.4753) | 1 | |||||||
| _GDP | |||||||||
| EXR | −0.2006 (0.0091) | 0.3887 (0.0000) | 1 | ||||||
| INF | 0.5663 (0.0000) | 0.0459 (0.5549) | −0.4628 (0.0000) | 1 | |||||
| PC | −0.0510 (0.5118) | −0.0159 (0.8383) | −0.1481 (0.0554) | 0.1355 (0.0799) | 1 | ||||
| RES | −0.6528 (0.0000) | −0.1195 (0.1227) | 0.1588 (0.0398) | −0.4033 (0.0000) | −0.1674 (0.0301) | 1 | |||
| FED | −0.0402 (0.6050) | 0.4309 (0.0000) | −0.1477 (0.0560) | 0.4576 (0.0000) | 0.2608 (0.0006) | −0.3965 (0.0000) | 1 | ||
| US10 | 0.0264 (0.7339) | 0.1418 (0.0667) | −0.5796 (0.0000) | 0.5353 (0.0000) | 0.0135 (0.8621) | −0.2802 (0.0002) | 0.7461 (0.0000) | 1 | |
| VIX | 0.5835 (0.0000) | −0.1603 (0.0379) | −0.3397 (0.0000) | 0.2254 (0.0033) | −0.1861 (0.0158) | −0.3679 (0.0000) | −0.2278 (0.0030) | 0.1157 (0.1353) | 1 |
Note(s): Author's construction: 168 observations. The numbers within parenthesis represent the probabilities

