


The economic development of Bangladesh is heavily reliant on the banking industry, yet it faces numerous hurdles, including liquidity issues, capital shortages, non-performing loans, inefficiencies and so on. Therefore, this study investigated the performance and efficiency of scheduled banks (state-owned, private commercial, foreign commercial and specialized banks) operating in Bangladesh.
The research was conducted using secondary data from annual reports of banks. The CAMELS rating system and Data Envelopment Analysis (DEA) methods were employed to measure the performance and efficiency of banks, respectively.
In the overall bank rankings, results revealed that foreign commercial Standard Chartered Bank and state-owned Sonali Bank Limited came in first and last position, respectively. Among the four categories of banks, foreign commercial banks were the best performer, while state-owned banks were the worst. Only two banks, i.e. Citibank NA and HSBC Bank, were scale efficient while the remaining banks were inefficient. In terms of performance and efficiency, state-owned and specialized banks were deemed wanting.
This study proposes recommendations to the policymakers that could lead to more effective tactics for improving the banking industry's performance and efficiency.
As far as the authors are concerned, this study presents empirical evidence on the performance and efficiency of different types of banks and explores comparisons among them, which has never been done to this extent in the country before.
1. Introduction
In most economies, the banking sector is regarded as the financial system's backbone, and it plays a critical role in attaining economic growth and expansion (Kamarudin et al., 2016). The expansion of trade and commerce, the creation of jobs and the promotion of the industrial revolution in an economy all require the development of the banking sector. The banking system of Bangladesh is evolving and has witnessed unprecedented development during the previous two decades (Ahamed, 2012). However, due to a lack of capital sufficiency, strong governance, rising non-performing loans, liquidity issues and other factors, the pace of development slowed, resulting in unsatisfactory performance and efficiency. These are some of the prime concerns for the banking sector in Bangladesh as they eroded the industry (Zheng et al., 2020; Amir, 2019; Habib, 2018). The financial regularity authority injects capital into the banking sector every year to confront capital inadequacy, but the improvement is not yet visible (Uddin and Bristy, 2014). These issues affect the country's banking system as well as the entire economy.
The introduction of reassuring foreign commercial banks into the local banking system due to the liberalization of monetary policies in recent decades has increased competition (Mirzaei et al., 2013). This may result in a reduction in monopoly power and profits, affecting bank performance and efficiency (Banna et al., 2017). Banks' poor performance and inefficiency can lead to issues such as bank failure and a loss of trust in the banking system, which can lead to economic stagnation (Mahmud et al., 2016). To perform well, however, all Bangladeshi banks are focusing more on cost containment and providing high-quality services and products (Ahmed and Liza, 2013). In this context, effective regulatory rules and rating frameworks for evaluating banking performance in Bangladesh are desperately needed, with a special focus on managerial efficiency, asset and earnings quality, risk mitigation and financial stability (Moudud-Ul-Haq, 2017).
Thus, an imperative issue regarding being efficient is on the rise (Shameem, 1995) and, attention has been paid to improve the efficiency of the banking industry in Bangladesh. As a result of this process, banks are compelled to operate close to the “best-practice” or efficient in terms of providing service (Rashid et al., 2020). However, most of the banks underperform from the intended level due to managerial bottlenecks, capital inadequacy, low earnings, market risk and other factors (Bangladesh Bank, 2019). Contrarily, bank efficiency depends on different elements such as bank capitalization and profitability, inflation rate, economic expansion and real interest rate (Pancurova and Lyocsa, 2013; Banna et al., 2017). Furthermore, the ownership position of banks may have a substantial impact on their efficiency (Kamarudin et al., 2016). The ownership of banks in Bangladesh generally can be categorized into four groups, namely State-Owned Commercial Banks (SCBs), Specialized Development Banks (SDBs), Private Commercial Banks (PCBs) and Foreign Commercial Banks (FCBs) (Jahan and Muhiuddin, 2020; Boubakri et al., 2005). However, the efficiency of all types of banks is critical to the overall banking system's stability and seamless operation (Rashid et al., 2020; Sufian and Kamarudin, 2013).
Since its inception, the banking industry as a whole has faced critical ups and downs in terms of performance and efficiency (Samad, 2008). To investigate the category-wise banks' performance and efficiency level over the years (2011–2018), this study employs the CAMELS rating system and nonparametric Data Envelopment Analysis (DEA) method. Several empirical studies determined the bank's efficiency in developed economies (e.g. Al-Gasaymeh and Samarah, 2020; Mirzaei and Moore, 2019; Henriques et al., 2018). Recently, some studies focused on the efficiency of the banking system in developing and emerging economies (e.g. Moudud-Ul-Huq, 2019; Tamatam et al., 2019; Chaluvadi et al., 2018; Banna et al., 2017). In Bangladesh, some researches were also conducted on the performance measurement (Rahman and Islam, 2018; Moudud-Ul-Huq, 2017; Ahsan, 2016) and efficiency of banks (Ali, 2015; Sufian and Kamarudin, 2014; Ahmed and Liza, 2013; Haque and Rayhan, 2013), but these studies only looked at a part of the banking industry. There is a minimum, or close to none studies assessed overall banking sectors' performance and efficiency in Bangladesh. Besides, no study was conducted evaluating performance and efficiency based on banks' categories which is a decisive factor in the country's banking sector. A research including all types of banks (state-owned banks, private commercial banks, specialized banks and foreign commercial banks) is required to represent a comprehensive assessment of the country's overall banking system.
To bridge the gap, this study aims to investigate the performance and efficiency of different types of banks. However, this study is expected to contribute to the banking literature by helping the authority improve the condition of the banking sector by minimizing the causes responsible for their substandard condition. The authority also would be able take category-based policy rather than for a specific bank to improve overall performance and efficiency of the banking sector. Furthermore, as this study also ranks the banks according to their performance and efficiency, it will also guide the problematic banks to follow the policies of top-ranked banks to overcome their difficulties.
The sections that follow are grouped as follows: Section 2 reviews related literature, whereas Section 3 summarizes the data and methodology employed in this research. Section 4 presents the findings and discusses the outcomes, and Section 5 concludes. Finally, section 6 discusses the policy implications of with future research directions.
2. Literature review
2.1 Theoretical background
Since the country's whole economy relies upon the banking sector, sound banking performance is a requirement for economic success (Eyuboglu, 2016). Economists pay a great deal of attention to banks' performance, which is expressed in terms of effectiveness, productivity and profitability (Bikker and Bos, 2008). According to Rengasamy (2012), banking performance reflects how the resources of a bank are used in a form that enables it to achieve its desired objectives. Furthermore, the term “bank performance” refers to the use of a set of indicators to assess a bank's current state and improve its ability to achieve goals. Since Bangladesh's banking sector is highly competitive in recent days, measuring bank performance in a competitive market is critical because it informs depositors and investors on whether to invest or withdraw cash from the bank (Rayhan et al., 2011). Due to the result of the substantial loan losses and bank failures that happened after the 1980s, the demand for banking supervision has grown in Bangladesh. Following that, banks began to use the CAMEL analysis to measure their performance. A lot of studies have been done in developed countries on the application and utility of the CAMEL model. However, a modified version of the CAMEL model introducing sensitivity of market risk to the original model is used to assess bank financial performance, and the central bank of Bangladesh recommended each of its indicators and components.
On the other hand, Drucker (1977) termed efficiency as “doing things right”. Efficiency refers to how well a system works to produce the maximum outputs for a given input (Alrafadi et al., 2016; Aguenaou et al., 2017). It is not evaluated in terms of success in the marketplace rather operational excellence in utilizing the resources (Kumar and Gulati, 2010). For banks, maintaining efficiency is very crucial as it enhances the capability of a country to compete with its domestic and international affairs more fluently (Uddin and Bristy, 2014). Banks can improve efficiency in their operations by reducing operating expenses, developing branches' technical capabilities and increasing recovery rates (Islam et al., 2017). The early researches on bank efficiency focused mostly on European countries, the United States and Japan (Aissia and Ellouz, 2021). The non-parametric method (DEA) and the parametric approach (Stochastic Frontier Analysis [SFA]) were used in the existing literature to measure bank efficiency. Charnes et al. (1978) developed DEA as a non-parametric method for assessing the efficiency of a set of decision-making units (DMUs) (Emrouznejad and De Witte, 2010). The earliest DEA models assume a constant return to scale (CRS), ignoring the possibility that distinct DMUs (banks) operate at different scales. To address this flaw, Banker et al. (1984) developed the variable returns to scale (VRS) model, which assures that each bank is only compared to other banks of similar size. DEA compares a bank's technical efficiency to that of a peer group of banks' input and output (Anouze and Bou-Hamad, 2019). Both the input- and output-oriented models can be estimated based on suitability.
2.2 Empirical background
Several studies on the measurement of bank's performance and efficiency have been undertaken around the world. Alemu and Aweke (2017) analyzed the performance of six private commercial banks of Ethiopia for the period of 2007–2016 using panel data where CAMEL rating analysis was used to measure the overall performance of banks. In another study, Khatik and Nag (2015) also used the CAMEL model approach to measure the performance of 10 banks operating in India for the period of 2007–2012. In Bangladesh, Rushdi (2009) used the partial and total factor productivity approach instead of the CAMEL approach to measure the performance of banks. However, the majority of the authors used the CAMELS framework (e.g. Sarker, 2005; Islam et al., 2014; Moudud-Ul-Huq, 2017; Rahman and Islam, 2018; Ahsan, 2016) to measure the performance of banks.
Kumar and Gulati (2010) collected cross-sectional data for the financial year 2006–2007 to measure the efficiency of banks using the DEA method because of some advantages of using this method, such as it could simultaneously use several inputs and outputs and any assumptions about the functional form of the production function were not required in this method. The same method was used by Abbas et al. (2016) to measure the efficiency of some selected Islamic and conventional banks operating in Pakistan from 2004 to 2009. Hoque and Rayhan (2013) collected data of 21 banks working in Bangladesh for the year 2009, where the non-parametric DEA technique was used to measure the efficiency of banks. Chaity and Alam (2021) employed both non-parametric DEA and parametric SFA to assess the efficiency of listed private commercial banks in Bangladesh for the period of 2007–2016. Although many researches had been done in Bangladesh on the performance and efficiency measurement of banks' operating in the country, they covered only a part of the banking sector. Research covering all the four sectors of banks (state-owned banks, private commercial banks, specialized banks and foreign commercial banks) had not been done yet. So, this study had been picked up covering all the sectors of banks to have an idea about the overall banking situation in Bangladesh.
3. Data source and empirical approach
3.1 Data
This empirical study examines the performance and efficiency of Bangladesh's banking sector at the individual bank level. Given the challenges of obtaining all available and relevant data from all banks, this study focused on a sample of 20 banks, including three state-owned banks, twelve private commercial banks, two specialized banks and three foreign commercial banks. The annual reports of selected banks were utilized to compile all banking data. This research was mainly based on secondary data collected from the annual reports from the banks. To measure the efficiency and performance of different categories of banks, unlike sampling periods were used. We had no choice but to choose an unlike study period due to unavailability of data. Panel data of state-owned commercial banks and private commercial banks for the period of 2011–2018; specialized banks for 2013–2018; and foreign commercial banks between 2016 and 2018 were collected to achieve the objectives. Table 1 presents the list of banks according to their types considered in this study.
List of banks considered in this study
| SL. No | Bank name | Bank type |
|---|---|---|
| 1 | Sonali Bank Limited | State-owned |
| 2 | Janata Bank Limited | |
| 3 | Agrani Bank Limited | |
| 4 | Al-Arafah Islami Bank Ltd | Private commercial |
| 5 | BRAC Bank Ltd | |
| 6 | Bank Asia Ltd | |
| 7 | Dutch Bangla Bank Ltd | |
| 8 | Dhaka Bank Ltd | |
| 9 | Eastern Bank Ltd | |
| 10 | First Security Islami Bank Ltd | |
| 11 | IFIC Bank Ltd | |
| 12 | Premier Bank Ltd | |
| 13 | Prime Bank Ltd | |
| 14 | Pubali Bank Ltd | |
| 15 | Standard Bank Ltd | |
| 16 | Bangladesh Krishi Bank | Specialized |
| 17 | Probashi Kallyan Bank | |
| 18 | Standard Chartered Bank | Foreign commercial banks |
| 19 | CITI Bank NA | |
| 20 | HSBC Bank |
3.2 Measurement of bank performance
In 1993, the central bank of Bangladesh–Bangladesh Bank first implemented the CAMELS Rating System in Bangladesh to evaluate the performance of banks and financial regulatory institutions using a ranking system (Rahman and Islam, 2018). In this study, 27 indicators from the CAMELS model were used to examine various aspects of performance analysis (Table 2).
Indicators of CAMELS rating against each component
| Component | Indicators |
|---|---|
| Capital adequacy (C) |
|
| Asset quality (A) |
|
| Management soundness (M) |
|
| Earnings ability (E) |
|
| Liquidity (L) |
|
| Sensitivity to market risk (S) |
|
Source(s): Bangladesh Bank (2019)
The six components mentioned above were used to measure the performance of 20 selected banks. Each of the components was ranked based on the ratings of respective indicators, while indicators of all the components were used to calculate the overall ranking of banks. Then a composite rating was given to each bank based on the average ratings of the CAMELS components (Table 3). The performance of banks in CAMELS rating analysis is rated from 1 to 5. A lower value (1) of composite ranking indicates the best performance, while a higher value (5) indicates the worst performance of the banks.
Description of CAMELS rating
| Group rank | Composite range | CAMELS rank | Description |
|---|---|---|---|
| 1–4 | 1.00–1.49 | 1 | Strong |
| 4.1–8 | 1.5–2.49 | 2 | Satisfactory |
| 8.1–12 | 2.5–3.49 | 3 | Fair |
| 12.1–16 | 3.5–4.49 | 4 | Marginal |
| 16.1–20 | 4.5–5.00 | 5 | Unsatisfactory |
Source(s): Huq (2017)
3.3 Efficiency measurement of banks
Many researchers have evaluated the banking sector's efficiency due to advancements in the banking structure. However, most of them used ratios analysis to measure a bank's efficiency (Fatema et al., 2019). But ratios analysis can be misleading the estimation of the bank's efficiency (Rao and Lakew, 2012). To overcome this dilemma, researchers are trying to use frontier analysis methods in past decades (Sufia and Kamarudin, 2013). There are two types of approaches-parametric and nonparametric approaches in measuring the technical efficiency of banks. Among these approaches, the nonparametric DEA technique was used in this research to measure the efficiency of banks as it is capable of managing multiple inputs and outputs and no need to explicitly provide any particular functional form as well as it can deal with small sample size smoothly.
DEA is a nonparametric method for estimating production frontiers in operations research and economics (Sickles and Zelenyuk, 2019; Charnes et al., 1978; Banker et al., 1984)). Several studies have been adopted the DEA approach to measure the efficiency of Bangladeshi banks (e.g. Banna et al., 2017; Ali, 2015; Sufian and Kamarudin, 2014; Ahmed and Liza, 2013; Haque and Rayhan, 2013; Khanam and Nghiem, 2006).
However, technical efficiency through DEA can be measured using two approaches, i.e. output-oriented and input-oriented. An output-oriented method aims to produce the maximum possible outputs from a given set of inputs, whereas an input-oriented approach aims at using minimum possible inputs for producing a given amount of outputs (Alam, 2011). When CRS assesses, these two technical efficiency measurements will coincide, but they are likely to differ otherwise (Alam, 2011). Scale efficiency can be measured by dividing CRS by the VRS, representing pure technical efficiency (Alam, 2011). Since controlling a bank's inputs is relatively easier than controlling its outputs, input-oriented approach was employed to estimate the bank's efficiency in this study. The input-oriented DEA model with variable returns to scale can be described as follows:
Here, f (f = 1, …,F) is the fth bank, where F is the total number of banks; denotes the kth (k = 1, …,K) output for the fth bank; indicates the mth (m = 1, …,M) input for the fth bank and = an intensity variable used to construct the frontier. The scalar θ measures the redial reduction in the input necessary to make the bank technically efficient and is between 0 and 1 in an input-oriented approach. If θ equals 1, it implies that the farm is technically efficient (Mitra et al., 2019).
Since our data analysis is based on the panel data, so we employed the panel DEA. The panel DEA is an extension of the DEA analysis (Chaitip et al., 2014), and the TEit of the panel DEA can be calculated using the equation below.
where TEit denotes the technical efficiency of bank i = 1, …, n (number of bank) and t = 1, …, n (number of year)). However, represents the ratio of technical efficiency belong to this bank(i) at the year (t). Furthermore, the value of TEit ratio ranges from zero to one. When TEit equals zero, it means that bank (i) has no technical efficiency at the time period (t). On the other hand, the TEit equates to one denotes that the bank (i) has the highest technical efficiency during the time period (t).
Each bank was considered as a single decision-making unit (DMU) in the DEA. For example, DMU 1 represented Janata Bank Ltd., DMU 2 represented Agrani Bank Ltd., DMU 3 represented Sonali Bank Ltd. and so on. In DEA, the frontier was constructed for each DMU while a linear program was used to generate an efficient frontier in which each DMU had 100% efficiency against all other DMUs (Hoque and Rayhan, 2013).
It is noteworthy that bank inputs are those cost items that banks incur during the process of making profits, and outputs of the banks are mainly the revenue items. The eight inputs considered for measuring the efficiency of banks have been listed in Table 4. The selection of inputs and output variables was made according to the studies of Sufian and Kamarudin (2015), Ali (2015), Sufian et al. (2012), Ariff and Can (2008), Bader et al. (2008).
4. Empirical results and discussion
4.1 Performance measurement of banks
Before diving into measuring the performance of the banking sector, we need to address the current situation of each bank in light of the components of CAMELS analysis. Thus, the following section delves deeper into each CAMELS indicator.
4.1.1 Capital adequacy of sampled banks
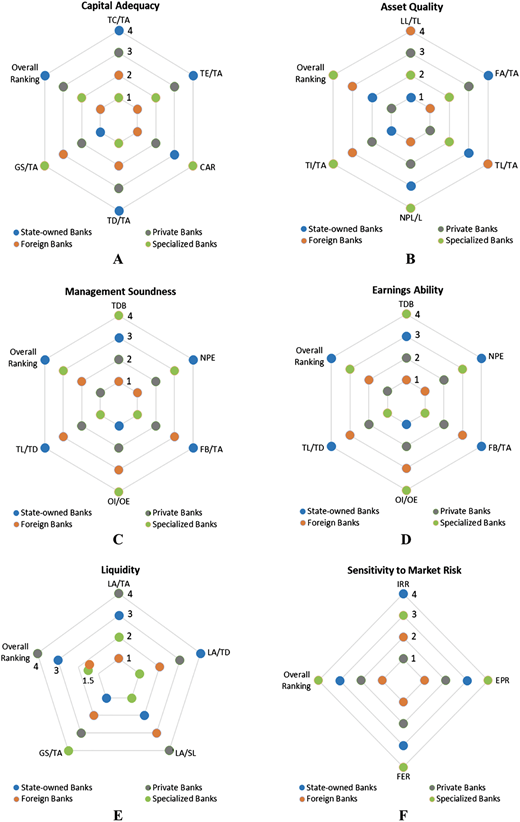
Higher capital adequacy increases the depositors' confidence and prevents the banks from being bankrupt in an adverse situation. Regarding categories of banks, the results (Table A1) revealed that the foreign commercial banks ranked at the first position in terms of capital adequacy ratio with a group average of 1.8 and state-owned commercial banks stood in the last position with a group average of 3.2 (Figure 1-A). Higher capital adequacy ratio (CAR) and higher total equity contribute to the better performance of foreign banks. On the other hand, a higher amount of debt, lack of capital and equity are responsible for the worst performance of state-owned commercial banks. It was found that Citibank NA stood at the top position with a group average of 1.4 and obtained ratings 1 in total equity to total assets ratio, capital adequacy ratio and government securities to the total investment ratio (Table A1). Standard Chartered Bank and HSBC Bank ranked second and third, respectively. It appeared that all the top three banks in the capital adequacy ratio were foreign commercial banks. First Security Islami Bank stood in the last position with an average score of 17.8. This is because it used a huge amount of debt capital, which made its total debt to total assets ratio higher. However, it used 95% debt to its total assets in 2018.
Capital adequacy ratio of sampled banks
| Name of banks | TC/TA | TE/TA | CAR | TD/TA | GS/TI | Group | ||||||
|---|---|---|---|---|---|---|---|---|---|---|---|---|
| Avg | Rank | Avg | Rank | Avg | Rank | Avg | Rank | Avg | Rank | Avg | Rank | |
| Janata | 5.47 | 18 | 6.24 | 17 | 9.43 | 18 | 93.76 | 18 | 86.45 | 8 | 15.8 | 18.5 |
| Agrani | 4.92 | 19 | 6.30 | 16 | 9.65 | 17 | 93.70 | 17 | 81.12 | 10 | 15.8 | 18.5 |
| Sonali | 3.88 | 20 | 5.82 | 18 | 10.64 | 15 | 94.18 | 19 | 90.78 | 5 | 15.4 | 17 |
| Sate-owned | 4.75 | 4 | 6.12 | 4 | 9.90 | 3 | 93.87 | 4 | 86.11 | 1 | 3.2 | 4 |
| Al-Arafah | 9.01 | 13 | 7.80 | 12 | 13.22 | 5 | 92.20 | 13 | 4.13 | 18 | 12.2 | 14 |
| Pubali | 9.23 | 10 | 8.59 | 8 | 12.02 | 10 | 91.41 | 9 | 78.22 | 13 | 10 | 8 |
| Standard | 9.78 | 9 | 8.29 | 9 | 11.47 | 13 | 91.71 | 10 | 76.58 | 14 | 11 | 11 |
| Dhaka Bank | 8.81 | 14 | 7.47 | 13 | 11.84 | 11 | 92.53 | 14 | 86.66 | 7 | 11.8 | 12.5 |
| Prime Bank | 11.65 | 6 | 9.42 | 6 | 12.74 | 8 | 90.58 | 7 | 96.65 | 3 | 6 | 4 |
| First security | 5.63 | 17 | 3.96 | 19 | 10.56 | 16 | 96.04 | 20 | 5.42 | 17 | 17.8 | 20 |
| IFIC Bank | 8.02 | 16 | 6.98 | 14 | 10.92 | 14 | 93.02 | 15 | 78.40 | 12 | 14.2 | 16 |
| DBBL | 8.55 | 15 | 6.78 | 15 | 13.26 | 4 | 93.22 | 16 | 94.94 | 4 | 10.8 | 9 |
| Premier | 9.06 | 11 | 8.10 | 10 | 11.52 | 12 | 91.90 | 11 | 75.54 | 15 | 11.8 | 12.5 |
| BRAC Bank | 9.01 | 12 | 8.01 | 11 | 12.63 | 9 | 91.99 | 12 | 80.36 | 11 | 11 | 10 |
| Bank Asia | 10.32 | 7 | 8.61 | 7 | 13.14 | 6 | 91.39 | 8 | 86.84 | 6 | 6.8 | 5 |
| Eastern Bank | 10.30 | 8 | 10.56 | 5 | 12.87 | 7 | 89.44 | 6 | 82.23 | 9 | 7 | 6 |
| Private | 9.11 | 3 | 7.88 | 3 | 12.18 | 2 | 92.11 | 3 | 70.49 | 2 | 2.6 | 3 |
| Citibank NA | 25.19 | 2 | 24.99 | 1 | 40.85 | 1 | 75.01 | 2 | 99.92 | 1 | 1.4 | 1 |
| HSBC | 21.16 | 4 | 19.58 | 3 | 29.30 | 2 | 80.42 | 4 | 0.00 | 19.5 | 6.5 | 3 |
| Standard chartered | 14.77 | 5 | 13.72 | 4 | 16.94 | 3 | 86.28 | 5 | 98.77 | 2 | 3.8 | 2 |
| Foreign | 20.3 | 2 | 19.4 | 1 | 29.03 | 1 | 80.56 | 2 | 66.23 | 3 | 1.8 | 1 |
| BKB | 22.22 | 3 | 22.22 | 2 | −40.61 | 19 | 77.78 | 3 | 15.18 | 16 | 8.6 | 7 |
| PKB | 62.71 | 1 | 0.92 | 20 | −53.02 | 20 | 37.63 | 1 | 0.00 | 19.5 | 12.3 | 15 |
| Specialized | 42.4 | 1 | 11.5 | 2 | −46.82 | 4 | 57.70 | 1 | 7.59 | 4 | 2.4 | 2 |
4.1.2 Asset quality of selected banks
To a large extent, the profitability of a bank depends on the ability of its assets to generate income. Non-performing loans can threaten the quality of assets. Five indicators were used to estimate the quality of the assets in this study. The results (Table A2) found that private commercial banks stood in the first position and specialized banks ranked last in the asset quality ratio (Figure 1-B). The foreign commercial banks and private commercial banks of Bangladesh used their assets most efficiently by investing more in the productive sectors. On the other hand, state-owned commercial banks and specialized commercial banks were in vulnerable conditions in asset quality. State-owned banks ranked at the top in loan loss provision to total loan ratio, and foreign commercial banks ranked at the top in fixed assets to total assets ratio and had the least amount of non-performing loans.
Asset quality of sampled banks
| Name of banks | LL/TL | FA/TA | TL/TA | NPL/L | TI/TA | Group | ||||||
|---|---|---|---|---|---|---|---|---|---|---|---|---|
| Avg | Rank | Avg | Rank | Avg | Rank | Avg | Rank | Avg | Rank | Avg | Rank | |
| Janata | 6.25 | 4 | 1.57 | 9 | 54.86 | 14 | 15.24 | 16 | 26.25 | 5 | 9.6 | 6 |
| Agrani | 9.16 | 3 | 2.79 | 18 | 48.50 | 16 | 18.06 | 17 | 28.96 | 4 | 11.6 | 13 |
| Sonali | 13.32 | 1 | 3.11 | 19 | 38.86 | 18 | 28.69 | 18 | 31.79 | 3 | 11.8 | 17 |
| State-owned | 9.5 | 1 | 2.5 | 4 | 47.4 | 3 | 20.6 | 3 | 29.1 | 1 | 2.4 | 2 |
| Al-Arafah | 1.10 | 19 | 1.24 | 5 | 71.40 | 3 | 3.49 | 6 | 71.41 | 1 | 6.8 | 2 |
| Pubali | 2.67 | 7 | 1.46 | 8 | 63.30 | 12 | 5.51 | 13 | 16.65 | 10 | 10 | 8 |
| Standard | 1.65 | 15 | 1.69 | 11 | 69.85 | 4 | 4.39 | 8 | 15.54 | 13 | 10.2 | 9 |
| Dhaka bank | 2.13 | 11 | 1.91 | 13 | 67.58 | 8.5 | 4.87 | 10 | 11.36 | 16 | 11.7 | 15 |
| Prime bank | 2.21 | 10 | 2.35 | 15 | 65.66 | 11 | 6.55 | 15 | 18.98 | 8 | 11.8 | 17 |
| First security | 1.09 | 18 | 1.25 | 6 | 76.19 | 2 | 2.50 | 3 | 68.52 | 2 | 6.2 | 1 |
| IFIC bank | 1.98 | 13 | 1.87 | 12 | 68.70 | 6 | 5.30 | 12 | 13.55 | 14 | 11.4 | 11 |
| DBBL | 2.10 | 12 | 2.21 | 14 | 62.84 | 13 | 3.96 | 7 | 9.27 | 18 | 12.8 | 19 |
| Premier | 1.58 | 16 | 1.55 | 10 | 67.84 | 7 | 5.61 | 14 | 16.05 | 12 | 11.8 | 17 |
| BRAC bank | 3.87 | 6 | 1.41 | 7 | 67.60 | 8.5 | 5.17 | 11 | 10.39 | 17 | 9.9 | 7 |
| Bank Asia | 2.34 | 8 | 2.64 | 16 | 65.96 | 10 | 4.67 | 9 | 16.38 | 11 | 10.8 | 10 |
| Eastern Bank | 1.90 | 14 | 3.35 | 20 | 69.60 | 5 | 2.98 | 4 | 12.72 | 15 | 11.6 | 13 |
| Private | 2.1 | 3 | 1.9 | 3 | 68.1 | 1 | 4.6 | 2 | 23.4 | 2 | 2.2 | 1 |
| Citibank NA | 1.25 | 17 | 0.45 | 3 | 34.46 | 19 | 1.69 | 1 | 20.80 | 7 | 9.4 | 4.5 |
| HSBC | 0.9 | 20 | 0.24 | 2 | 48.31 | 17 | 2.19 | 2 | 22.71 | 6 | 9.4 | 4.5 |
| Standard chartered | 2.23 | 9 | 0.13 | 1 | 52.62 | 15 | 3.42 | 5 | 18.60 | 9 | 7.8 | 3 |
| Foreign | 1.4 | 4 | 0.3 | 1 | 45.1 | 4 | 2.4 | 1 | 20.7 | 3 | 2.6 | 3 |
| BKB | 9.96 | 2 | 2.77 | 17 | 79.68 | 1 | 23.64 | 19 | 0.02 | 19 | 11.6 | 13 |
| PKB | 5.10 | 5 | 0.92 | 4 | 28.14 | 20 | 32.47 | 20 | 0.00 | 20 | 13.8 | 20 |
| Specialized | 7.5 | 2 | 1.9 | 2 | 53.9 | 2 | 28.1 | 4 | 0.01 | 4 | 2.8 | 4 |
Results further showed that Sonali Bank Ltd. ranked at the top in loan loss provision to total loan ratio, and Standard Chartered Bank ranked at the top in fixed assets to total assets ratio (Table A2). Bangladesh Krishi Bank (BKB) disbursed the highest amount of loans relative to its total assets. On the other hand, Citibank NA, a foreign commercial bank, had the least amount of non-performing loans. Al-Arafah Islami Bank Ltd. ranked 1 in total investment to total assets ratio. However, First Security Islami Bank stood at the first position regarding asset quality while Probashi Kallyan Bank (PKB) stood at the last position. A considerable amount of non-performing loans was responsible for this inferior condition of PKB. The percentage of non-performing loans to its total disbursed loan was 28% which indicated the alarming situation of this bank.
4.1.3 Management soundness of selected banks
The performance of other components of CAMELS analysis depends on how efficiently the management of the bank is executing its operation. The survival and profitability of a bank depend on the management soundness of the bank. The results (Table A3) showed that state-owned commercial banks had the lowest net profit per employee and lowest total loan to total deposits ratio, making them the worst performer with ranking 4 (Figure 1-C). On the other hand, private commercial banks ranked 1 with a group average of 2. Its higher net profit per employee, total deposits per branch had contributed to the better performance of private commercial banks.
Management soundness of sampled banks
| Name of banks | TDB | NPE | Fb/TA | OI/OE | TL/TD | Group | ||||||
|---|---|---|---|---|---|---|---|---|---|---|---|---|
| Avg | Rank | Avg | Rank | Avg | Rank | Avg | Rank | Avg | Rating | Avg | Rank | |
| Janata | 595.49 | 16 | 37.89 | 15 | 1.10 | 16 | 2.23 | 9 | 67.69 | 17 | 14 | 17 |
| Agrani | 454.84 | 18 | 10.64 | 19 | 2.48 | 13 | 3.29 | 1 | 62.75 | 18 | 12.75 | 15.5 |
| Sonali | 688.97 | 15 | 37.31 | 16 | 0.26 | 18 | 1.69 | 14 | 47.61 | 20 | 15.75 | 19 |
| State-owned | 579.8 | 3 | 28.6 | 4 | 1.2 | 4 | 2.4 | 1 | 59.4 | 4 | 3.2 | 4 |
| Al-Arafah | 1343.98 | 10 | 91.42 | 8 | 5.69 | 5 | 2.60 | 3 | 90.25 | 4 | 6.5 | 5 |
| Pubali | 477.34 | 17 | 32.06 | 18 | 2.16 | 14 | 2.15 | 11 | 82.09 | 13 | 15 | 18 |
| Standard | 1041.80 | 14 | 80.86 | 10 | 3.86 | 11 | 2.35 | 7 | 86.91 | 6 | 10.5 | 9 |
| Dhaka bank | 1617.86 | 6 | 103.52 | 5 | 5.73 | 4 | 2.48 | 5 | 86.76 | 8 | 5 | 3 |
| Prime bank | 1392.24 | 8 | 82.63 | 9 | 5.92 | 3 | 2.18 | 10 | 86.38 | 9 | 7.5 | 7 |
| First security | 1430.12 | 7 | 35.63 | 17 | 1.90 | 15 | 1.93 | 12 | 86.85 | 7 | 12.75 | 15.5 |
| IFIC bank | 1121.36 | 12 | 52.21 | 12 | 2.80 | 12 | 1.78 | 13 | 84.68 | 11 | 12.25 | 13.5 |
| DBBL | 1168.01 | 11 | 44.32 | 13 | 4.46 | 9 | 1.65 | 15 | 80.27 | 14 | 12 | 11 |
| Premier | 1120.99 | 13 | 80.78 | 11 | 4.62 | 8 | 1.65 | 16 | 84.06 | 12 | 12 | 11 |
| BRAC bank | 1383.74 | 9 | 42.94 | 14 | 4.83 | 7 | 0.81 | 19 | 94.59 | 3 | 12.25 | 13.5 |
| Bank Asia | 1658.26 | 5 | 102.94 | 6 | 5.46 | 6 | 2.49 | 4 | 86.27 | 10 | 5.25 | 4 |
| Eastern Bank | 1685.96 | 4 | 165.33 | 4 | 16.86 | 1 | 2.41 | 6 | 103.47 | 2 | 3.75 | 1 |
| Private | 1286.8 | 2 | 76.2 | 2 | 5.3 | 2 | 2.04 | 2 | 87.7 | 2 | 2 | 1 |
| Citibank NA | 9429.68 | 2 | 417.34 | 2 | 1.09 | 17 | 2.25 | 8 | 50.38 | 19 | 7.25 | 6 |
| HSBC | 14597.27 | 1 | 399.21 | 3 | 0.00 | 19.5 | 1.05 | 18 | 69.37 | 16 | 10.37 | 8 |
| Standard chartered | 9389.60 | 3 | 604.25 | 1 | 4.02 | 10 | 2.78 | 2 | 71.86 | 15 | 4 | 2 |
| Foreign | 11138 | 1 | 473.6 | 1 | 1.7 | 3 | 2.03 | 3 | 63.9 | 3 | 2.2 | 2 |
| BKB | 204.18 | 19 | 95.51 | 7 | 12.64 | 2 | 0.23 | 20 | 89.30 | 5 | 12 | 11 |
| PKB | 11.64 | 20 | 8.02 | 20 | 0.00 | 19.5 | 1.19 | 17 | 292.27 | 1 | 19.12 | 20 |
| Specialized | 107.9 | 4 | 51.7 | 3 | 6.3 | 1 | 0.71 | 4 | 190.8 | 1 | 2.6 | 3 |
HSBC bank achieved the top position in total deposits per branch ratio and Standard Chartered Bank in the net profit per employee ratio. In the same way, Eastern Bank stood at the first position in funds borrowed to total assets ratio and Agrani Bank in operating income to operating expense ratio. Eastern Bank Limited achieved the top position regarding management soundness, followed by Standard Chartered Bank and Dhaka Bank, while Probashi Kallyan Bank (PKB) was the worst performer. The results of this study tend to align with previous studies (e.g. Rahman and Islam, 2018; Haq, 2017) found that the management capacity of private commercial banks – Eastern Bank Ltd., Dhaka Bank Ltd., Bank Asia, NCC Bank, were in a strong position.
4.1.4 Earnings ability of sampled banks
If the bank has better earnings ability, it can afford to sustain future unforeseen shocks. So, higher earnings ability indicates better performance of the bank. Five indicators were used to measure the earnings ability of banks in this study (Table A4). It was found that foreign commercial banks stood the first position in earnings ability calculation (Figure 1-D). Its higher Return on Assets (ROA) ratio and operating profit to total assets ratio availed the foreign commercial banks to perform satisfactorily. Private commercial banks ranked two, followed by state-owned commercial banks. On the other hand, specialized banks stood in the last position with a group average of 3. Its poor return on assets ratio (−0.06) was mainly responsible for such a bad condition of the banks.
Earning ability of sampled banks
| Name of banks | ROA | ROE | OP/TA | Net II/TA | Non-II/TA | Group | ||||||
|---|---|---|---|---|---|---|---|---|---|---|---|---|
| Avg | Rank | Avg | Rank | Avg | Rank | Avg | Rank | Avg | Rank | Avg | Rank | |
| Janata | 0.1 | 18 | 13.14 | 8 | 1.95 | 16 | 0.73 | 18 | 1.04 | 14 | 15 | 18 |
| Agrani | 0.98 | 12 | 37.70 | 1 | 1.81 | 17 | 0.83 | 17 | 3.19 | 1 | 11.75 | 11 |
| Sonali | 0.08 | 19 | 24.58 | 2 | 1.03 | 20 | −1.03 | 20 | 1.17 | 11 | 15.25 | 19 |
| State-owned | 0.41 | 3 | 25.14 | 1 | 1.60 | 4 | 0.18 | 4 | 1.80 | 1 | 2.6 | 3 |
| Al-Arafah | 1.18 | 8 | 13.98 | 6 | 2.89 | 9 | 3.09 | 5 | 1.00 | 15 | 7 | 6.5 |
| Pubali | 0.92 | 14 | 10.08 | 17 | 2.73 | 10 | 2.65 | 7 | 0.94 | 17 | 12 | 12 |
| Standard | 1.11 | 9 | 12.82 | 9 | 5.32 | 1 | 2.16 | 8 | 0.94 | 16 | 6.75 | 4.5 |
| Dhaka bank | 1.05 | 10 | 12.61 | 10 | 2.60 | 14 | 1.84 | 15 | 1.13 | 13 | 12.25 | 13 |
| Prime bank | 0.96 | 13 | 10.24 | 16 | 2.66 | 11 | 1.67 | 16 | 1.20 | 10 | 14 | 15 |
| First security | 0.63 | 17 | 11.33 | 13 | 1.16 | 19 | 2.06 | 10 | 0.32 | 20 | 14.75 | 17 |
| IFIC bank | 0.86 | 16 | 12.12 | 11 | 2.06 | 15 | 2.12 | 9 | 1.23 | 9 | 12.75 | 14 |
| DBBL | 1.26 | 7 | 18.26 | 4 | 2.61 | 13 | 4.01 | 3 | 1.78 | 5 | 6.75 | 4.5 |
| Premier | 0.91 | 15 | 10.96 | 14 | 1.78 | 18 | 2.01 | 11 | 1.40 | 8 | 14.5 | 16 |
| BRAC bank | 1.32 | 6 | 16.05 | 5 | 3.17 | 6 | 4.19 | 2 | 2.03 | 4 | 4.75 | 2 |
| Bank Asia | 1.01 | 11 | 11.78 | 12 | 2.93 | 8 | 1.99 | 14 | 1.43 | 7 | 11.25 | 10 |
| Eastern Bank | 1.49 | 5 | 13.50 | 7 | 3.26 | 5 | 2.80 | 6 | 1.53 | 6 | 5.75 | 3 |
| Private | 1.06 | 2 | 12.81 | 2 | 2.76 | 3 | 2.55 | 2 | 1.24 | 3 | 2.4 | 2 |
| Citibank NA | 1.58 | 4 | 6.25 | 18 | 2.30 | 7 | 1.99 | 12 | 2.36 | 3 | 10.25 | 9 |
| HSBC | 2.39 | 2 | 10.74 | 15 | 4.17 | 3 | 1.99 | 13 | 0.34 | 19 | 8.25 | 8 |
| Standard chartered | 2.98 | 1 | 20.46 | 3 | 4.61 | 2 | 3.64 | 4 | 2.62 | 2 | 2.5 | 1 |
| Foreign | 2.32 | 1 | 12.49 | 3 | 3.93 | 1 | 2.54 | 3 | 1.77 | 2 | 2 | 1 |
| BKB | −2.13 | 20 | 5.47 | 19 | 2.62 | 12 | 0.25 | 19 | 0.55 | 18 | 17.5 | 20 |
| PKB | 2.02 | 3 | 2.65 | 20 | 3.61 | 4 | 6.38 | 1 | 1.17 | 12 | 7 | 6.5 |
| Specialized | −0.06 | 4 | 4.06 | 4 | 3.11 | 2 | 3.32 | 1 | 0.86 | 4 | 3 | 4 |
Standard Chartered Bank had secured the first position in the category of earnings ability with a group average of 2.5. It also topped in Return on Assets (ROA) indicator (2.98%). Moreover, it secured the second position in operating profit to total assets ratio indicator and non-interest income to total assets ratio indicator. BRAC Bank and Eastern Bank respectively achieved the second and third position in the earnings ability component of CAMEL analysis. On the other hand, Bangladesh Krishi Bank (BKB), one of the specialized banks of Bangladesh, stood in the last position in this category with a group average of 17.5. It failed to maintain its sustainability in earnings as its ROA ratio was negative (−2.13) and its ROE ratio was also very low (5.47), which is considered alarming for the better performance of a bank.
4.1.5 Liquidity position of selected banks
Every bank should maintain a minimum amount of money as liquid assets to handle its short-term liabilities and meet the demand for cash of its customers. If it failed to fulfill the demand of its customers, then it is called liquidity risk. So, a higher liquidity ratio is preferable for a bank though higher liquidity indicates lower investment. Therefore, the bank should maintain an optimum level of liquidity to avoid liquidity risk and enhance investment. Four indicators were used in this study to estimate the liquidity position of different banks (Table A5). Foreign commercial banks and specialized banks achieved the top position jointly (Figure 1-E). Higher liquid assets of the two banks contributed to the good performance of the banks. On the other hand, private commercial banks were the worst performers in this group. Private commercial banks were suffering from liquidity problems that made their liquid assets to total assets ratio and liquid assets to short-term liabilities ratio lower.
Liquidity measurement of sample banks
| Name of banks | LA/TA | LA/TD | LA/SL | GS/TA | Group | |||||
|---|---|---|---|---|---|---|---|---|---|---|
| Avg | Rank | Avg | Rank | Avg | Rank | Avg | Rank | Avg | Rank | |
| Janata | 86.52 | 19 | 106.74 | 18 | 1.799 | 8 | 22.988 | 3 | 12 | 14 |
| Agrani | 89.04 | 18 | 114.96 | 16 | 3.130 | 4 | 23.910 | 2 | 10 | 7.5 |
| Sonali | 82.15 | 20 | 100.02 | 19 | 4.114 | 2 | 28.985 | 1 | 10.5 | 10 |
| State-owned | 85.90 | 3 | 107.2 | 4 | 3.01 | 2 | 25.2 | 1 | 2.5 | 3 |
| Al-Arafah | 91.27 | 15 | 115.34 | 15 | 1.171 | 18 | 2.947 | 17 | 16.25 | 20 |
| Pubali | 89.61 | 16 | 116.16 | 13 | 1.647 | 10 | 13.070 | 8 | 11.75 | 13 |
| Standard | 92.96 | 10 | 115.62 | 14 | 2.032 | 7 | 11.933 | 10 | 10.25 | 9 |
| Dhaka bank | 91.48 | 14 | 117.41 | 9 | 1.205 | 16 | 9.878 | 13 | 13 | 18 |
| Prime bank | 93.27 | 8 | 122.20 | 7 | 1.717 | 9 | 18.360 | 5 | 7.25 | 3 |
| First security | 95.117 | 3 | 108.40 | 17 | 1.551 | 13 | 3.791 | 16 | 12.25 | 15 |
| IFIC bank | 94.483 | 4 | 116.38 | 11 | 1.636 | 11 | 10.575 | 11 | 9.25 | 6 |
| DBBL | 91.817 | 12 | 117.25 | 10 | 1.354 | 15 | 8.815 | 14 | 12.75 | 17 |
| Premier | 94.006 | 7 | 116.33 | 12 | 1.199 | 17 | 12.095 | 9 | 11.25 | 11 |
| BRAC bank | 91.727 | 13 | 128.38 | 6 | 1.612 | 12 | 8.438 | 15 | 11.5 | 12 |
| Bank Asia | 92.631 | 11 | 121.17 | 8 | 1.512 | 14 | 14.285 | 7 | 10 | 7.5 |
| Eastern Bank | 94.273 | 5 | 140.18 | 2 | 3.465 | 3 | 10.466 | 12 | 5.5 | 2 |
| Private | 84.86 | 4 | 119.6 | 3 | 1.68 | 4 | 10.4 | 3 | 3.5 | 4 |
| Citibank NA | 95.815 | 1 | 139.45 | 3 | 3.026 | 5 | 20.788 | 4 | 3.25 | 1 |
| HSBC | 94.261 | 6 | 135.36 | 4 | 1.109 | 20 | 0.000 | 19.5 | 12.375 | 16 |
| Standard chartered | 95.812 | 2 | 130.64 | 5 | 1.135 | 19 | 18.308 | 6 | 8 | 5 |
| Foreign | 95.30 | 1 | 135.2 | 2 | 1.76 | 3 | 13.1 | 2 | 2 | 1.5 |
| BKB | 89.282 | 17 | 100.01 | 20 | 2.882 | 6 | 0.003 | 18 | 15.25 | 19 |
| PKB | 93.110 | 9 | 805.39 | 1 | 7.983 | 1 | 0.000 | 19.5 | 7.625 | 4 |
| Specialized | 91.20 | 2 | 452.7 | 1 | 5.43 | 1 | 0.002 | 4 | 2 | 1.5 |
Results also found that Citibank NA had achieved the top position in terms of liquidity measurement of sample banks and also ranked first in liquid assets to total assets indicators. Probashi Kallyan Bank (PKB) had achieved the first position both in the liquid assets to total deposits ratio and in liquid assets to short-term liabilities ratio indicators of measuring banks' liquidity. Sonali Bank Ltd. used the highest amount of government securities in its total assets, which made the government securities to total assets ratio higher than all other banks. On the other hand, Al-Arafah Islami Bank Ltd. showed the poorest performance and ranked at the bottom. The reason for this type of poor performance was its lower liquid assets to short-term liability ratio, which indicated that its liquid assets were not enough to meet the short-term liabilities of the bank.
4.1.6 Sensitivity to market risk
Sensitivity to market risk is the degree to which changes in interest rate, foreign exchange rate, equity prices and commodity prices adversely affect the earnings of the banks. Three indicators were used in this study to measure the market risks of the selected banks (Table A6). Commercial banks are the top performer as their equity position risk and foreign exchange risk were lower, which made its market risk lower (Figure 1-F). Private commercial banks ranked two, followed by state-owned commercial banks. Besides, a massive amount of equity position risk (Tk. 1668.6 million) and foreign exchange risk (Tk. 965.15 million) made specialized banks the worst performer (Table A6).
Sensitivity to market risk of sampled banks
| Name of banks | IRR | EPR | FER | Group | ||||
|---|---|---|---|---|---|---|---|---|
| Avg | Rank | Avg | Rank | Avg | Rank | Avg | Rank | |
| Janata | 133.2 | 19 | 1224.3 | 15 | 920.4 | 17 | 17.0 | 17.5 |
| Agrani | 98.4 | 16 | 530.1 | 13 | 478.2 | 13 | 14.0 | 15 |
| Sonali | 136.5 | 20 | 1329.3 | 16 | 964.2 | 18 | 18.0 | 19 |
| State-owned | 122.7 | 4 | 1027.9 | 3 | 787.61 | 3 | 3.33 | 3 |
| Al-Arafah | 0.53 | 2 | 110.3 | 8 | 356.9 | 11 | 7.0 | 6.5 |
| Pubali | 34.40 | 9 | 991.8 | 14 | 612.4 | 14 | 12.3 | 14 |
| Standard | 32.10 | 8 | 420.2 | 10 | 427.4 | 12 | 10.0 | 13 |
| Dhaka bank | 51.63 | 11 | 7.4 | 5 | 170.3 | 9 | 8.3 | 10 |
| Prime bank | 2.50 | 3 | 89.4 | 7 | 287.5 | 10 | 6.7 | 4 |
| First security | 11.30 | 5 | 78.9 | 6 | 138.6 | 6 | 5.7 | 3 |
| IFIC bank | 16.19 | 6 | 2200.1 | 20 | 86.43 | 2 | 9.3 | 11 |
| DBBL | 0.00 | 1 | 1.3 | 4 | 765.3 | 16 | 7.0 | 6.5 |
| Premier | 26.97 | 7 | 436.2 | 11 | 100.1 | 3 | 7.0 | 6.5 |
| BRAC bank | 52.00 | 12 | 369.0 | 9 | 148.2 | 8 | 9.7 | 12 |
| Bank Asia | 128.50 | 18 | 2105 | 19 | 2785 | 20 | 19.0 | 20 |
| Eastern Bank | 11.17 | 4 | 508.4 | 12 | 132.7 | 5 | 7.0 | 6.5 |
| Private | 30.6 | 1 | 609.9 | 2 | 500.94 | 2 | 1.67 | 2 |
| Citibank NA | 58.67 | 13 | 0.0 | 2 | 24.33 | 1 | 5.3 | 1.5 |
| HSBC | 70.00 | 14 | 0.0 | 2 | 144.0 | 7 | 7.7 | 9 |
| Standard chartered | 35.67 | 10 | 0.0 | 2 | 108.3 | 4 | 5.3 | 1.5 |
| Foreign | 54.8 | 2 | 0.0 | 1 | 92.22 | 1 | 1.33 | 1 |
| BKB | 99.40 | 17 | 1920.4 | 18 | 723.8 | 15 | 16.7 | 16 |
| PKB | 86.20 | 15 | 1416.8 | 17 | 1206 | 19 | 17.0 | 17.5 |
| Specialized | 92.8 | 3 | 1668.6 | 4 | 965.15 | 4 | 3.67 | 4 |
Citibank NA and Standard Chartered Bank jointly stood at the first position to measure sensitivity to market risk (Table A6). Equity position risks of these two banks were found to be zero, which makes them top-ranked banks. On the other hand, Bank Asia Limited was the worst performer due to its increasing interest rate, foreign exchange rate and equity position risk making its performance terrible. In the case of interest rate risk and foreign exchange risk, Dutch Bangla Bank (DBBL) and Citibank NA achieved the top positions, respectively.
4.1.7 Composite ranking of banks in the CAMELS rating system
Foreign banks and private commercial banks were found as the best performer in three separate components of CAMELS (Figure 1). The highest rating of a bank in specific components does not imply a strong position in the banking sector. Therefore, to understand the overall position of the banks, a composite ranking was given to each after analyzing all the components of the CAMELS rating system (Table 5). It was observed that foreign commercial banks and private commercial banks operate more perfectly, which made them top-ranked banks, respectively in the CAMELS analysis. Better management capacity, sufficient capital adequacy, better loan recovery, efficient use of their assets, higher per employee profit, etc., were the main reason for being top performers, which were absent in the case of state-owned commercial and specialized banks. Besides, lack of skillful and dedicated human resources, lack of liquidity and lack of proper planning during loan disbursement resulted in default loans made the worse performance of state-owned commercial banks and specialized banks.
The composite rank of sample banks
| Name of banks | C | A | M | E | L | S | Avg | Composite rank | CAMELS rank |
|---|---|---|---|---|---|---|---|---|---|
| Janata Bank | 18.5 | 6 | 17 | 18 | 14 | 17.5 | 15.17 | 19 | 5 |
| Agrani Bank | 18.5 | 13 | 15.5 | 11 | 7.5 | 15 | 13.42 | 16 | 4 |
| Sonali Bank | 17 | 17 | 19 | 19 | 10 | 19 | 16.83 | 20 | 5 |
| State-owned | 4 | 2 | 4 | 3 | 3 | 3 | 4 | 4 | |
| Al-Arafah Islami Bank | 14 | 2 | 5 | 6.5 | 20 | 6.5 | 9.00 | 6 | 2 |
| Pubali Bank | 8 | 8 | 18 | 12 | 13 | 14 | 12.17 | 14 | 4 |
| Standard Bank | 11 | 9 | 9 | 4.5 | 9 | 13 | 9.25 | 7 | 2 |
| Dhaka Bank | 12.5 | 15 | 3 | 13 | 18 | 10 | 11.92 | 12 | 3 |
| Prime Bank | 4 | 17 | 7 | 15 | 3 | 4 | 8.33 | 5 | 2 |
| First security Islami Bank | 20 | 1 | 15.5 | 17 | 15 | 3 | 11.92 | 12 | 3 |
| IFIC Bank | 16 | 11 | 13.5 | 14 | 6 | 11 | 11.92 | 12 | 3 |
| DBBL | 9 | 19 | 11 | 4.5 | 17 | 6.5 | 11.17 | 10 | 3 |
| Premier Bank | 12.5 | 17 | 11 | 16 | 11 | 6.5 | 12.33 | 15 | 4 |
| BRAC Bank | 10 | 7 | 13.5 | 2 | 12 | 12 | 9.42 | 8.5 | 3 |
| Bank Asia | 5 | 10 | 4 | 10 | 7.5 | 20 | 9.42 | 8.5 | 3 |
| Eastern Bank | 6 | 13 | 1 | 3 | 2 | 6.5 | 5.25 | 3 | 1 |
| Private | 3 | 1 | 1 | 2 | 4 | 2 | 2.17 | 2 | |
| Citibank NA | 1 | 4.5 | 6 | 9 | 1 | 1.5 | 3.83 | 2 | 1 |
| HSBC Bank | 3 | 4.5 | 8 | 8 | 16 | 9 | 8.08 | 4 | 1 |
| Standard Chartered | 2 | 3 | 2 | 1 | 5 | 1.5 | 2.42 | 1 | 1 |
| Foreign | 1 | 3 | 2 | 1 | 1.5 | 1 | 1.58 | 1 | |
| BKB | 7 | 13 | 11 | 20 | 19 | 16 | 14.33 | 18 | 5 |
| PKB | 15 | 20 | 20 | 6.5 | 4 | 17.5 | 13.83 | 17 | 5 |
| Specialized | 2 | 4 | 3 | 4 | 1.5 | 4 | 3.08 | 3 |
The results also found that four banks (Eastern Bank Limited, Citibank NA, HSBC Bank and Standard Chartered Bank) were ranked first jointly, indicating strong performance. Standard Chartered Bank, one of the reputed foreign commercial banks of Bangladesh, ranked in the top position having the lowest average rating of 2.42. This bank had higher net profit per employee, liquid assets and higher operating income to operating expenses, which improved the bank's overall performance.
On the other hand, Sonali Bank Ltd., the biggest state-owned commercial bank of Bangladesh, achieved the last position and made more unsatisfactory performance due to lack of adequate capital, lower fixed assets to total assets ratio, lower total loan to total deposits ratio and lack of liquid assets. Results also revealed that foreign commercial banks performed best and ranked first among all other types of banks. Private commercial banks ranked second, followed by specialized banks. State-owned commercial banks were the worst performer, ranked four in the composite ranking of CAMELS analysis. Rahman and Islam (2018) found that the composite rating of Eastern Bank Ltd. ranked first, and IFIC Bank was the worst performer among the sampled private commercial banks of Bangladesh.
4.2 Efficiency measurement of banks
Efficient banks can achieve maximum profit using the minimum amount of inputs such as operating and interest expenses, total assets, total capital, total investment, total shareholders' equity and least number of branches and employees. The findings of technical efficiency over study period of different banks are shown in Table 6. Results revealed that state-owned banks suffer from serious inefficiency during the period of 2013–2018. This is due to managerial failures or external circumstances that have transpired during this time period. During this time, not just state-owned banks, but also private commercial banks, are affected by similar concerns. Moreover, the country's all financial institutions went through severe issue of capital shortage during this period. This can be attributed to the fact that the money market rate has plummeted, resulting in a significant drop in the bank's interest margin. Another reason for the drop-in efficiency is that the government has reformed the money market structure during this period and strengthened the regulatory structure for lending, especially individual consumer and business lending. Nonetheless, the substantial improvement in bank efficiency witnessed following this period can be attributed to an increase in revenue collection as a consequence of interest rates and various fees and levies.
Year-wise efficiency scores of different banks
| DMU | Bank name | Efficiency score | |||||||
|---|---|---|---|---|---|---|---|---|---|
| 2011 | 2012 | 2013 | 2014 | 2015 | 2016 | 2017 | 2018 | ||
| 1 | Janata Bank | 1.00 | 1.00 | 0.57 | 0.49 | 0.48 | 0.42 | 0.47 | 0.36 |
| 2 | Agrani Bank | 1.00 | 1.00 | 0.80 | 0.68 | 0.56 | 0.29 | 0.22 | 0.07 |
| 3 | Sonali Bank | 1.00 | 1.00 | 0.15 | 0.28 | 0.32 | 0.16 | 0.41 | 1.00 |
| 4 | Al-Arafah Islami Bank | 1.00 | 0.88 | 0.81 | 0.87 | 0.81 | 0.83 | 0.71 | 0.61 |
| 5 | Pubali Bank | 0.83 | 0.72 | 0.75 | 0.64 | 0.61 | 0.54 | 0.66 | 0.66 |
| 6 | Standard Bank | 1.00 | 0.88 | 0.83 | 0.89 | 0.66 | 0.61 | 0.57 | 0.53 |
| 7 | Dhaka Bank | 1.00 | 0.76 | 0.71 | 0.70 | 0.64 | 0.82 | 0.75 | 0.87 |
| 8 | Prime Bank | 0.86 | 0.91 | 0.72 | 0.58 | 0.52 | 0.51 | 0.56 | 0.56 |
| 9 | First Security Islami Bank | 0.82 | 0.75 | 0.67 | 0.57 | 0.54 | 0.68 | 0.76 | 0.76 |
| 10 | IFIC bank | 0.85 | 0.82 | 0.73 | 0.68 | 0.72 | 0.58 | 0.50 | 0.41 |
| 11 | DBBL | 1.00 | 0.96 | 0.71 | 0.72 | 0.88 | 0.67 | 0.69 | 0.73 |
| 12 | Premier Bank | 0.56 | 0.48 | 0.55 | 0.64 | 0.61 | 0.64 | 0.74 | 0.87 |
| 13 | BRAC Bank | 1.00 | 0.99 | 1.00 | 0.80 | 0.92 | 1.00 | 1.00 | 0.89 |
| 14 | Bank Asia | 0.87 | 0.93 | 0.89 | 0.82 | 0.72 | 0.69 | 0.76 | 0.82 |
| 15 | Eastern Bank | 1.00 | 0.91 | 0.89 | 0.83 | 0.72 | 0.86 | 0.86 | 0.83 |
| 16 | Citibank NA | – | – | – | – | – | 1.00 | 1.00 | 1.00 |
| 17 | HSBC Bank | – | – | – | – | – | 1.00 | 1.00 | 1.00 |
| 18 | Standard Chartered Bank | – | – | – | – | – | 1.00 | 0.93 | 1.00 |
| 19 | BKB | – | – | – | 0.98 | 0.86 | 1.00 | 0.98 | 1.00 |
| 20 | PKB | – | – | – | 1.00 | 1.00 | 1.00 | 1.00 | 1.00 |
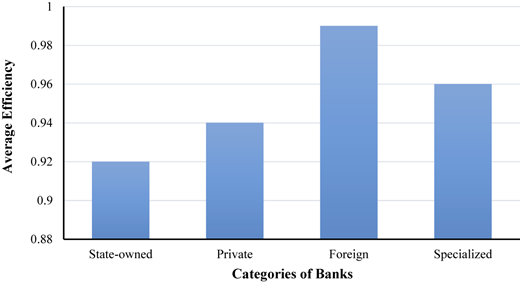
The findings of the VRS, CRS, and the scale efficiency score for each DMU are shown in Table 7 to delve deeper into the efficiency analysis and ranking of different banks. Results found that the technical efficiency score of Citibank NA, HSBC Bank and PKB was found to be efficient as their VRS scores were 1. In the same way, Citibank NA and HSBC Bank were found to be technically efficient under CRS efficiency as their efficiency scores were 1. Moreover, only two banks, i.e. Citibank NA and HSBC bank, were found to be scale efficient as their scale efficiency score was 1. The scale efficiency of another foreign commercial bank Standard Chartered Bank was near to 1. So, it can be said that the foreign commercial banks were found to be more efficient than other types of banks operating in Bangladesh. Hoque and Rayhan (2013) measured the efficiency of 21 commercial banks operating in Bangladesh; only two banks (Citi bank and One Bank Ltd.) were scale efficient, and the other 19 banks were inefficient. However, Standard Chartered bank's scale efficiency was found to be a standard of 0.99 or 99%, which means by adjusting the scale, Standard Chartered Bank could reduce their inputs by (1–0.99) or 1%. Scale efficiency can be improved by increasing the operating profits of the bank as its operating profit was very small. In bank categories, the foreign commercial bank was found relatively more efficient than others, while state-owned banks were less efficient among all categories (Figure 2).
VRS efficiency, CRS efficiency and scale efficiency of banks
| DMU | Bank name | VRS | CRS | Scale efficiency | Score |
|---|---|---|---|---|---|
| 1 | Janata Bank | 0.598 | 0.578 | 0.97 | 4 |
| 2 | Agrani Bank | 0.578 | 0.56 | 0.93 | 6 |
| 3 | Sonali Bank | 0.54 | 0.44 | 0.87 | 10 |
| 4 | Al-Arafah Islami Bank | 0.81 | 0.8 | 0.98 | 3 |
| 5 | Pubali Bank | 0.67 | 0.66 | 0.98 | 3 |
| 6 | Standard Bank | 0.74 | 0.69 | 0.92 | 7 |
| 7 | Dhaka Bank | 0.77 | 0.75 | 0.96 | 5 |
| 8 | Prime Bank | 0.65 | 0.64 | 0.98 | 3 |
| 9 | First Security Islami Bank | 0.69 | 0.61 | 0.88 | 9 |
| 10 | IFIC bank | 0.66 | 0.59 | 0.91 | 8 |
| 11 | DBBL | 0.79 | 0.78 | 0.98 | 3 |
| 12 | Premier Bank | 0.63 | 0.51 | 0.77 | 11 |
| 13 | BRAC Bank | 0.94 | 0.91 | 0.96 | 5 |
| 14 | Bank Asia | 0.81 | 0.78 | 0.96 | 5 |
| 15 | Eastern Bank | 0.86 | 0.85 | 0.99 | 2 |
| 16 | Citibank NA | 1 | 1 | 1 | 1 |
| 17 | HSBC Bank | 1 | 1 | 1 | 1 |
| 18 | Standard Chartered Bank | 0.98 | 0.97 | 0.99 | 2 |
| 19 | BKB | 0.96 | 0.94 | 0.98 | 3 |
| 20 | PKB | 1 | 0.93 | 0.93 | 6 |
The efficient banks (Citibank NA and HSBC Bank) had a minimal number of bank branches, and operating profits were Tk. 1249.2 million and Tk. 6020.9 million, respectively, leading their profit per branch higher enough to make the banks efficient. Their other related input costs, such as operating and interest expenses, are also lower comparing the other banks. In contrast, the reasons for the inefficiency of state-owned commercial banks were their higher expenses, larger capital and assets, and operating profit, which was not higher enough compared to their massive number of branches and employees. Among the specialized banks, a large amount of capital to operate its 1030 branches and their higher interest expenses made Bangladesh Krishi Bank inefficient. Among the private commercial banks, Premier Bank had the lowest scale efficiency because its operating profit was meager, although it had a large amount of total assets and only 91 branches.
Comparing the performance and efficiency of banks, it was found that, in case of measuring the performance of banks using the CAMELS rating system Standard Chartered Bank, one of the foreign banks ranked one. However, the scale efficiency score of Standard Chartered Bank was 0.99, which was very close to efficient. On the other hand, other two foreign commercial banks – Citibank NA and HSBC Bank – were efficient in efficiency measurement. Their composite performance ratings were two and four, respectively, alongside their CAMELS rank was first, which can be considered good ratings. So, in terms of performance and efficiency measurement of banks, the rankings of foreign commercial banks were more satisfactory, but the state-owned banks showed dissatisfactory results.
5. Conclusion
The banking sector of a country reflects the growth potentiality of the economy of that country. However, it is a matter of concern that the banks of our country are facing many problems that slow down the pace of development of the banking sector and nation. Therefore, this study tried to assess the performance and efficiency of 20 scheduled banks operating in Bangladesh based on secondary data collected from the annual reports. This study included all categories of banks operating in Bangladesh, i.e. state-owned banks, private commercial banks, foreign commercial banks and specialized banks. To measure the performance of banks, the CAMELS rating system was considered, and a ranking was provided to each of the banks. Besides, the efficiency of the banks was measured through DEA. Results found that not all bank categories perform equally well, and not all banks within the same category are equally efficient. The foreign commercial banks were the best performers and state-owned commercial banks were the worst performer. In addition, foreign commercial banks were more efficient than other categories of banks in Bangladesh. Results revealed that four banks, i.e. Prime Bank Limited, First Security Islami Bank Limited, Citibank NA and Standard Chartered Bank, provided strong performance in CAMELS rating. In contrast, Janata Bank Limited, Sonali Bank Limited, Bank Asia, and Probashi Kallyan Bank exhibited dissatisfactory performance. However, due to the amending of money market structure, all banks experienced significant inefficiency from 2013 to 2018. Only two banks, i.e. Citibank NA and HSBC Bank, were efficient, and the other eighteen banks were found to be inefficient.
6. Policy implications and future research
To the best of our knowledge, this study is the first of its kind in Bangladesh, focusing on different bank categories for analyzing performance and efficiency simultaneously. From the findings of the study, it can be concluded that the activities of most of the banks operating in Bangladesh are not satisfactory, especially the activities of state-owned commercial banks. These as well as specialized banks need to improve in most of the components in CAMELS, particularly capital adequacy, managerial soundness and earning ability by taking component-oriented strategies. Specialized banks also require recovery in its asset quality through adopting strong asset and liability management strategies which ultimately would reduce their market risk sensitivity. Therefore, Bangladesh Bank, the country's central bank, should precisely monitor and control the operations of poor-performing banks. In addition, state-owned commercial banks are more prone to corruption, which should concern the authority while evaluating the respective bank's performance. Followed by problem identifications, strict steps should be taken through the individual bank authority or direct involvement of the central bank to solve identified issues efficiently for making its performance better. In this regard, first of all, the banks should strictly maintain liquidity to meet the demand of their customers before investing funds and providing loans to their borrowers. Second, since non-performing loans degrade banks' asset quality, banks should use a supervisory strategy to limit the number of non-performing loans. Third, banks should raise the amount of deposits and investments they make in order to boost their earnings. Our empirical findings are confined to data obtained from a few sampling banks over a defined time period, which may limit the capacity to generalize our findings. However, it is anticipated that this study contributes to the extant literature of banks and the financial sector, which are relevant in developing economies, particularly Bangladesh and other similar countries. Future studies may explore productivity changes over time due to technological progress and bank-specific determinants of efficiency and performance compared to developed countries. Furthermore, the efficiency analysis of this study was entirely based on the DEA approach, which has several limitations, including the fact that the results from this method are potentially sensitive to the inputs and outputs selection and may not produce most reliable results without applying other supporting methods. Therefore, future research should address this by using more robust methods.

