


The stability of a financial system depends not only on individual bank risks but also on the interconnectedness of banks with similar credit exposure patterns. If banks form clusters based on their liabilities and asset similarities, the financial system may become fragile and vulnerable to systemic risk and contagion effects. This study investigates the clustering of Indian banks based on their credit exposure patterns and examines the implications for financial stability in COVID-19 and post-merger restructuring of public sector banks (PSBs).
This study employs a similarity matrix, suggested by Brechler et al. (2014), to quantify the degree of resemblance between banks’ credit portfolios and applies hierarchical clustering algorithms to identify clusters of banks with similar exposure structures. The dataset includes financial information from 2018 to 2023, covering pre-pandemic, pandemic and post-pandemic periods to analyze systemic risk dynamics.
The results reveal significant clustering among Indian banks (public sector and large private sector banks). These institutions exhibit strong positive correlations in their credit exposure patterns, indicating potential systemic risks. The findings suggest that highly correlated credit exposures increase contagion risk, where distress in one institution could have spillover effects across the cluster, amplifying financial instability.
This research provides empirical evidence of systemic risk clustering in Indian banking, extending the literature on financial stability in emerging markets. Unlike prior studies focusing on developed economies, this study emphasizes the challenges faced by emerging market banking systems, particularly during financial crises such as COVID-19. The findings offer policy-relevant insights for regulatory bodies seeking to strengthen financial resilience in economies with similar banking structures.
1. Introduction
COVID-19 affected revenues of industrial and service sectors in India due to prolonged curbs on sectoral economic activities. During the pandemic, the Reserve Bank of India (RBI) initiated several measures to improve credit disbursement to support businesses and the poor, vulnerable to lockdown measures. It also announced a moratorium on loan payments, which made loan repayment to banks by the borrowers temporarily optional. Banks were advised to increase their credit to Small and Medium Enterprises (SMEs) and the vulnerable population. Indian banking sector is characterized by a strong presence of public sector banks (PSBs), a few dominant private sector banks, and many regional and cooperative banks. This composition makes the study of systemic risk particularly relevant, as PSBs have historically followed government-directed lending policies while private sector banks have pursued commercial profitability. COVID-19 has increased the likelihood of asset downgrades in India (RBI, 2024). On the other side, Indian banks are in consolidation mode. Ten weaker public sector banks (PSBs) have recently merged with four better-performing banks, reducing the number of public sector banks to twelve. The recent HDFC merger has also played a significant role in increasing the concentration of assets in banking. The RBI Financial Stability Report (2021) cautions that the risk generated by the category of merged PSBs is comparatively higher than the unmerged PSBs. Loans are consistently growing at a higher rate than deposits. Lending to retail and micro, small, and medium enterprises (MSME) sector has been higher than that of large industries. The Credit to Deposit (CD) ratio has increased significantly after the mergers in public sector banks. Do these developments lead to increased interconnectedness in Indian banks? Even though the asset quality of scheduled commercial banks has been improving recently, the main reasons behind this reduction were writing off and the upgrade of loans (RBI, 2024). The subprime crisis in the US created considerable interest in the interlinkages and systemic risks for financial institutions as it exposed the risks of the interconnectedness of financial systems. Whether the mergers and the pandemic changed the composition of banks’ asset exposures and changed the number of clusters in Indian banking is worth exploring. Increasing similarities in credit exposure to a few sectors will increase systemic risks in Indian banking. This study assesses how structural changes in Indian banking, primarily mergers, and pandemic-driven lending shifts, have influenced systemic risk. Specifically, it examines whether these changes have led to increased homogeneity in credit exposures among banks, thereby exacerbating interconnectedness and financial vulnerabilities.
Systemic risk is co-related with the size and interconnectedness of financial firms [1]. If banks expand and diversify operations to become more similar to each other, each bank might become safer individually, but the banking sector as a whole will become riskier. If the operations of many banks are similar, they could become a “systemic herd” and vulnerable to the same shocks, leading to heightened volatility in the aggregate provision of financial services (Stiroh, 2018). Suppose banks follow similar risk management and trading strategies and are exposed to the same market segments or even to the very same debtors. In that case, they turn vulnerable to standard shocks, and their default probabilities may correlate strongly. As a result, they become vulnerable to standard shocks, and their default probabilities may correlate strongly. Before the subprime crisis, similarities among large financial institutions had risen considerably (Wagner, 2010).
Similarities in banks’ exposures would aggravate dimensions of systemic risk and increase correlations among factors contributing to systematic risk and complexities in the system. A visual representation of the similarity between any pair of banks could hint at the presence of many clusters. A cluster, here, is any group of banks whose asset portfolios are similar. By applying a suitable clustering algorithm, one can group banks belonging to different clusters. In practice, each bank can be represented by a vector. The vector would encompass various characteristics such as credit exposures, funding structures, off-balance-sheet items, etc. This study concentrates on the asset side of banks’ balance sheets. A high degree of similarity in credit exposures indicates the seeds of potential vulnerabilities that might stress (and distress) the financial system in the presence of adverse shocks. Existing academic work associated systemic risk primarily with the commonality of assets. Although many small and mid-sized banks in a financial system may not be risky individually, they may be exposed to the same risk from a macroeconomic perspective.
This paper employs a similarity measure, suggested by Brechler et al. (2014), based on the cosine of the angle between two banks’ vectors of asset weights and then utilizes an appropriate clustering algorithm to find clusters of banks in India. Thus, it designs a portfolio similarity measure arising from banks' credit exposures to different sub-sectors of the economy and clusters of banks based on similarities. Two forms of similarity can be looked at. First, a simple similarity measure treats each sector equally. Second, is there a risk-adjusted similarity, where weights to different sub-sectors are assigned based on risk rating? This paper focuses only on the simple similarity measure since sector-wise data regarding the nonperforming assets of individual banks are not available.
2. Literature review
A growing number of studies have focused on the systemic risks of banks. These studies can be classified into two categories: high-frequency measures, which use financial market data, and low-frequency measures, which rely on balance sheet information of firms and macroeconomic indicators. High-frequency measures have been utilized to monitor market indicators in real time regarding how systemic risk materializes in the system. Studies such as Huang et al. (2009), Acharya et al. (2017), Tobias and Brunnermeier (2016), and Brownlees and Engle (2012) developed various high-frequency measures. Low-frequency measures capture potential imbalances arising from financial fragility, both at the firm level and in the economy. Studies by San Jose et al. (2008), Borio and Lowe (2002), Schwaab et al. (2011), Blei and Ergashev (2014), and Brechler et al. (2014) have developed a series of low-frequency measures. This paper deploys the low-frequency systemic risk measure Brechler et al. (2014) used and relates the commonality of asset exposures to systemic risk.
Understanding asset commonality across financial institutions is essential for grasping systemic risk. Systemic risk arises from the fragility of a financial system. One source of system fragility could be the commonality of assets or common exposure to the same types of risks. Smaga (2014) extensively reviews systemic risk and the factors causing it. Studies observe “herding behavior” as one of the reasons banks have similar asset exposures in their portfolios. Empirical studies on herding are mainly confined to capital markets. A few studies, however, empirically focused on herding in banks as well. Acharya and Yorulmazer (2007) find that in the case of the “too-many-to-fail” problem, regulators’ choice to bail out all banks or none gives banks the incentive to herd, heightening the probability of a systemic crisis. Hirakata et al. (2017) explore the relationship between CoVaR, the measure of systematic risk, and the income sources of portfolio combinations for Japanese rural banks. They reveal evidence of “systemic as a herd” as greater exposure to market risk and non-interest-income activities linked to markets increase systemic risk, even though diversification reduces standalone risk. Chen (2011) applied the methods of Lakonishock, Shleifer, and Vishny (LSV) and Frey, Herbst, and Walter (FHW) to examine the herding behavior of US banks across loan categories. They found evidence of herding increasing dramatically during the 2008 financial crisis and also observed that banks tend to herd more when they are struggling to perform, and big banks tend to herd more than small ones.
Examining the impact of diversification on systematic risk, Wagner (2010) notes that diversification in financial services increases the similarities across institutions by exposing them to the same risk. As a result, the probability and the cost of a financial crisis will be high. Further, inadequate portfolio diversification can be empirically captured through an aggregate portfolio-similarity measure, even though such a measure is rare and possible to borrow from other areas (Brechler et al., 2014). Blocher (2012) developed a similarity index to observe capital-flow contagion in financial markets through interconnected asset holdings of portfolio managers, only to find that spill-over effects across managers with similar portfolios affect funds’ returns through popular short-term investment strategies. Using a similar concept, The Bank of Israel (2012) examined funds-managing of the public’s long-term savings (e.g. pension funds). It found a high level of similarity in the asset portfolios managed regarding the selection of very similar assets and even the weighting of these assets in the portfolios. All this is attributed to the limited availability of investment opportunities in Israel.
Examining the asset commonality from asset swaps to maturity structure, Allen et al. (2012) have revealed that the asset-composition structures of banks interact with funding maturity in determining systemic risk, mainly when banks rely primarily on short-term finance. Measuring asset commonality of European banks, Dissem (2019) found that 70% of the similarity between banks’ asset classes was significantly related to a bank’s diversification, size, credit risk, and capitalization. Also, he observes that asset commonality can influence returns negatively and the volatility of a bank positively. Cai et al. (2014) observed that those banks are more likely to focus on syndicate loans, and the more similar they become in asset portfolios, the more banks diversify by forming a syndicate with other banks in the US. They simultaneously, however, increase the concentration of the financial sector because banks become more similar. The study has discovered a positive and significant correlation between interconnectedness and various market systemic risk measures. Liquidity creation has been identified as a fundamental determinant of bank stability during crises. The emergence of COVID-19 further underscored the systemic risks. The pandemic led to significant shifts in credit exposure and increased financial fragility. El-Chaarani et al. (2023) found that liquidity creation helped banks maintain financial performance during the COVID-19 crisis when managed effectively alongside asset quality and bank size. Brechler et al. (2014) examined whether similarities between bank asset exposures could lead to the build-up of systemic risks in Czech banks by proposing a set of risk measures. The study found evidence of similarity lower than the situation created by assuming that banks fully diversify their portfolios on the same set of assets. There are more similarities between large and established banks; small banks are unimportant individually but can become systemically significant. Thus, there was no study related to Indian banking. The present study attempts to understand the similarities and clusters in Indian banking.
3. Methodology and data
The methodology of this study is built upon hierarchical clustering algorithms to construct a similarity matrix based on banks' credit exposure patterns. In the literature, various approaches are used to measure similarity between banks, including the Euclidean distance, Jacard’s coefficient, Manhattan distance, the Cosine measure, etc. This paper follows Brechler et al. (2014) and prefers to use the cosine similarity function as it has many advantages over the other measures. One significant advantage is that it is bounded by [−1, 1]. Since there can be no negative exposures in a bank balance sheet, the results are bound by [0, 1] and help us better interpret the results. All the other approaches are based on distance measures, whereas the cosine measure is based on orientation. Hence, it is also a scale-independent measure.
The cosine-similarity coefficient is the cosine of the angle between two vectors. These two can be banks’ balance sheet components and, in the current case, banks’ credit exposures. Given two banks, represented by the vectors a and b, the similarity between them is expressed by
Where the cosine of the angle between the two vectors a and b of two banks is, that is, the dot product of a and b divided by the magnitudes of a and b. Here, 1 indicates the level of highest similarity, whereas 0 indicates no similarity between the two banks. Once the similarity between each pair of banks is calculated, we get an n x n similarity matrix. This matrix has all the diagonal elements equal to 1 as the similarity between itself would be 1.
The weighted form of cosine similarity to measure the risk-adjusted similarity between two banks, a and b, can be calculated as:
Where wi is the weight given to each ith sector (i goes from 1 to n; n is the number of sectors), this similarity matrix is used for three purposes: (a) to compute a measure of the overall similarity of the banks in the system, (b) to explore the existence of clusters of banks exposed to typical risks, and (c) to use a distance matrix while performing clustering algorithms.
The average similarity within the banking system can be calculated in two ways: (a) a simple average similarity by giving each bank an equal weight, and (b) a weighted average similarity where weights to each bank are given according to their total exposure. This paper relies upon only the simple similarity measure.
A matrix can be plotted using the “correlogram” package in software R to explore the existence of clusters. The algorithm helps us put similar banks close to each other in clusters, thus helping us visualize the credit exposure of Indian banks. Once the clusters in the system are known, a clustering algorithm can be used to find clusters of banks exposed to typical risks. We use the “Agglomerative Hierarchical Algorithm” with “complete linkage” to find the banks in different clusters. Hierarchical clustering starts by treating each observation as a separate cluster. Then, it repeatedly executes the following two steps: (a) identify the two clusters that are closest together and (b) merge the two most similar clusters. This process continues until all the clusters have been merged.
The advantage of hierarchical clustering is that we do not have to specify the number of clusters in advance, unlike k-means, which assume spherical clusters and require predefined cluster numbers. Hierarchical clustering was chosen over other methods, such as k-means clustering, due to its interpretability and flexibility in handling different cluster sizes without requiring a pre-specified number of clusters. Hierarchical clustering allows for a tree-based structure (dendrogram [2]) that better represents the interconnected nature of systemic risk in banking. This paper uses the “total within-cluster sum of squares (WSS)” and “Silhouette” methods to choose the optimal number of clusters [3].
While conducting the analysis, each bank’s total credit exposure is divided into 17 sectors. The data for sector-wise exposure of banks are collected from the CMIE (Centre for Monitoring the Indian Economy) Prowess IQ. Bank group-wise NPAs for three sectors (agriculture, industry, and services) are taken from EPW Research Foundation India Time Series. All the scheduled commercial banks, public and private, for which the data is available for the period 2018–2023, have been selected for analysis. This study introduces a novel methodological approach using hierarchical clustering algorithms to construct a similarity matrix of credit exposures among Indian banks. While previous studies have examined systemic risk using high-frequency market data or balance sheet indicators, our approach identifies clusters of banks with similar risk profiles based on their credit portfolios. This technique enables regulators and policymakers to understand better the contagion risk and financial fragility that may arise from increased asset concentration.
4. Empirical analysis and discussion
Our analysis is primarily based on loan portfolios, covering sectoral credit exposure across 17 different sectors of the economy. Additionally, while off-balance-sheet items such as guarantees and letters of credit could contribute to systemic risk, their inclusion in this study was constrained by data availability.
4.1 Before the Indian Bank mergers and the COVID-19 pandemic
At the outset, to understand the banks’ preferred lending sectors in 2018, Figure 1 presents Indian banks’ asset exposures to various industries. The most significant lending concentration is in the “Other Than Industry” category, which far exceeds the exposure to other sectors. Sectors such as Infrastructure, Other Industries, Iron & Steel, and Construction & Allied Activities also receive notable lending, though at much lower levels. In contrast, sectors like Mining, Electricity, Services, Engineering, and Infrastructure-Power exhibit minimal exposure. The gradient shading represents exposure intensity, reinforcing that lending is highly skewed toward a few key sectors, particularly non-industrial categories. This suggests a strategic preference by banks for lower-risk or diversified lending outside core industrial sectors. These sectors generally prefer long-term loans from banks, leading to maturity risks for banks as a significant part of the bank’s liabilities are in the short-term category.
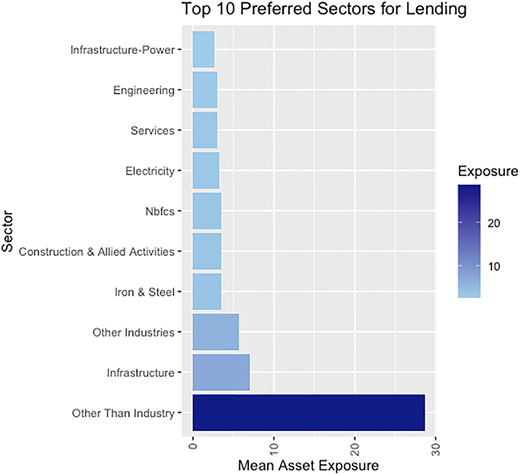
Credit exposure of banks to selective sectors in India – 2018. Source: Centre for monitoring Indian Economy, 2018
Credit exposure of banks to selective sectors in India – 2018. Source: Centre for monitoring Indian Economy, 2018
Figure 2 presents the results of the similarity matrix for Indian banks as of March 2018. Its rows and columns indicate individual banks in the same order. Therefore, each cell denotes the similarity between the corresponding row and column banks. The darker the cell, the greater the similarity of the banks. The diagonal from top-left to bottom-right represents the correlation of each bank with itself, which is always +1 (perfect correlation). The result reveals that the average similarity in the total credit exposure of Indian banks in 2018 is 0.3075 4, and the average similarity in fund-based and non-fund-based credit exposure is 0.2816 and 0.3018, respectively [4]. The dark blue patches in the correlogram are the groups of banks that are highly similar. Public Sector Banks (PSBs) like Punjab National Bank, Allahabad Bank, UCO Bank, and Union Bank of India show strong positive correlations with each other, indicating similar exposure patterns. Some Private Sector Banks like HDFC Bank, ICICI Bank, and Axis Bank also exhibit strong positive correlations, suggesting they share identical exposure characteristics. The figure has two clear patches: (1) the first in the upper left portion of the triangle and (2) the second in the lower right portion. Banks with large red dots indicate a strong negative correlation, but most correlations are positive or weak in this matrix. The white patches suggest no similarity between the corresponding banks. Some banks show weak or no significant correlations with others, as indicated by the minor or white dots. For example, IDFC Bank has several weak correlations with other banks. There are also outliers; banks with fewer strong correlations with others might have unique exposure profiles. For instance, City Union Bank Ltd and Jammu & Kashmir Bank Ltd have relatively fewer large blue dots, indicating they may have distinct exposure patterns. Banks with high correlations could be exposed to similar risks. Regulatory bodies need to monitor this to avoid systemic risks. Banks with low correlations may provide diversification benefits in a portfolio context.
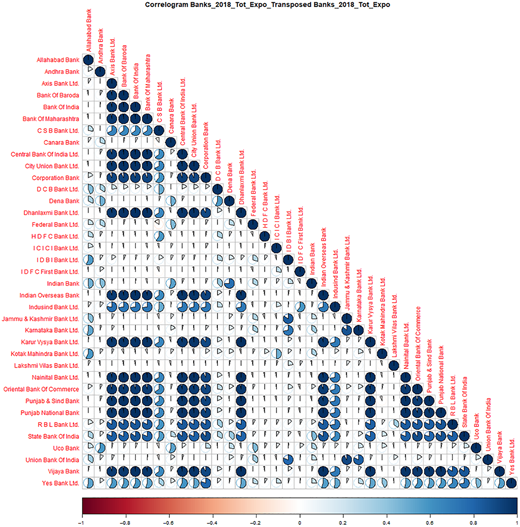
Similarity matrix correlogram for scheduled commercial banks – 2018. Source: Authors’ calculation using CMIE dataset
Similarity matrix correlogram for scheduled commercial banks – 2018. Source: Authors’ calculation using CMIE dataset
The similarity matrix correlogram suggests evidence of clusters in the Indian banking sector, and further investigation is needed. Therefore, the Agglomerative Hierarchical clustering with complete linkage is used to find banks belonging to different clusters. The cosine similarity matrix is subtracted from 1 as the dendrogram gives a visual from 0 to 1, 0 indicating the level of highest similarity. The output of the clustering analysis is presented as a dendrogram in Figure 3. The dendrogram is a hierarchical clustering representation of banks based on their total exposure in 2018. It groups banks into clusters that share similar exposure profiles. The vertical axis (Height) represents the dissimilarity or distance between clusters. Lower heights indicate more similarity, while higher heights indicate more dissimilarity. Since deciding on the optimal number of clusters is subjective, we use the Within-Cluster Sum of Squares (WSS) and Silhouette methods [5]. Both these methods suggest that the optimal number of clusters is five. Accordingly, the hierarchical tree is grouped into five clusters. One big cluster in the middle of the dendrogram lies between 0 and 0.2. This cluster comprises mid-sized and small banks that are highly similar regarding credit exposure. Their default rates can be expected to be highly correlated.
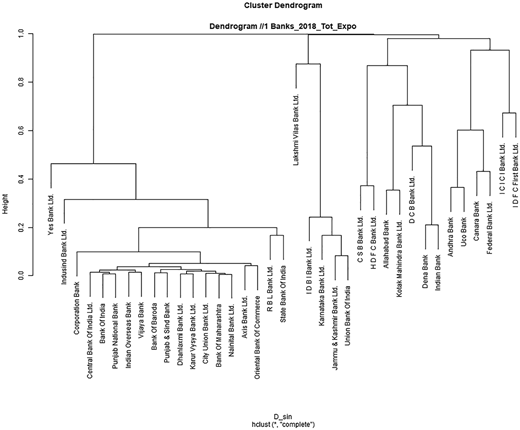
Similarity matrix dendrogram for scheduled commercial banks – 2018. Source: Authors’ calculation using CMIE dataset
Similarity matrix dendrogram for scheduled commercial banks – 2018. Source: Authors’ calculation using CMIE dataset
Cluster 1 comprises Yes Bank Ltd. and IndusInd Bank Ltd., which form a distinct cluster indicating similar exposure profiles different from other banks. This similarity might stem from their aggressive growth strategies and higher-risk lending practices, as both banks were known for rapid expansion and a focus on corporate lending during this period.
Cluster 2 includes sizeable public sector banks such as the Central Bank of India, Bank of India, Punjab National Bank, Bank of Baroda, Indian Overseas Bank, and Vijaya Bank. This is the largest cluster, consisting mainly of public sector banks with similar exposure patterns likely due to standardized lending practices, government influence, and regulatory frameworks. Government policies and sectoral lending mandates heavily influence their exposures.
Cluster 3 contains mid-sized and regional banks such as IDBI Bank Ltd., Karnataka Bank Ltd., and Union Bank of India. These banks have moderately similar exposure profiles, likely due to regional focus and mid-sized operations. They share common regional economic influences or a mix of retail and corporate banking exposure that differentiates them from larger, more diversified banks.
Cluster 4 consists solely of Lakshmi Vilas Bank Ltd., which stands alone at a higher height, indicating a distinct exposure profile. This uniqueness could be attributed to its specific market niche, regional focus, or unique strategic approach, potentially involving higher concentrations in particular sectors or different risk management practices.
Cluster 5 includes central private sector banks such as HDFC Bank, ICICI Bank Ltd., IDFC First Bank Ltd., and Federal Bank Ltd. These banks form a distinct cluster, possibly due to their private sector status and business strategies. Their exposure profiles might be characterized by more diversified lending, innovative financial products, and a focus on retail and corporate segments, with strategic initiatives and risk management practices likely setting them apart from other clusters. It is also observed from the dendrogram that the exposures of the three largest banks of India—HDFC Bank, ICICI Bank, and the State Bank of India—are different. However, HDFC Bank and ICICI Bank have more asset similarities and are part of the cluster of banks exposed to similar risks. More asset similarities exist between the State Bank of India and the United Bank of India.
Figure 4 presents the similarity matrix results for Indian banks as of March 2019. This correlogram visualizes the correlation matrix of various banks based on their total exposure in 2019. The result reveals that the average similarity in the total credit exposure of Indian banks in 2019 is 0.3147. The average similarity in fund and non-fund-based credit exposure is 0.2967 and 0.3131, respectively. Using the WSS and Silhouette methods, the correlogram suggests four optimal clusters.
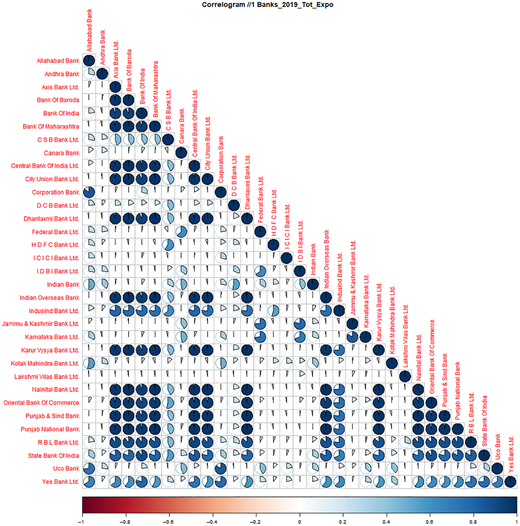
Similarity matrix correlogram for scheduled commercial banks – 2019. Source: Authors’ calculation using CMIE dataset
Similarity matrix correlogram for scheduled commercial banks – 2019. Source: Authors’ calculation using CMIE dataset
Cluster 1 includes the Public Sector Banks with banks such as State Bank of India, Bank of India, Oriental Bank of Commerce, Central Bank of India, Punjab & Sind Bank, Allahabad Bank, Andhra Bank, Bank of Baroda, Bank of India, and Central Bank of India. These banks show high intercorrelation, indicating similar exposure patterns and business models typical of public sector banks.
Cluster 2 comprises Private-Sector and Specialized Banks, including HDFC Bank Ltd., ICICI Bank Ltd., IndusInd Bank Ltd., RBL Bank Ltd., Axis Bank Ltd., and Kotak Mahindra Bank Ltd. These banks exhibit moderate to strong correlations with one another but weaker correlations with public-sector banks, highlighting their distinct strategies, customer bases, and risk profiles.
Cluster 3 includes Regional and Niche Banks with banks such as City Union Bank Ltd. and Karur Vysya Bank Ltd. These banks show weak correlations with public and large private sector banks, indicating their focus on regional markets or niche sectors.
Cluster 4 includes banks like Yes Bank and Lakshmi Vilas Bank Ltd., which are relatively isolated within their clusters. This suggests distinctive exposure profiles that do not closely align with those of other banks. This may be due to unique strategic directions, risk appetites, or specific market niches these banks target.
Figure 5 shows the dendrogram revealing clear groupings among banks based on their total exposure. It highlights clusters of public-sector banks with similar profiles, diverse strategies within private-sector banks, and unique positions for certain banks. Understanding these clusters can help assess systemic risks, develop regulatory policies, and make strategic decisions in the banking industry. Small clusters and outliers like Andhra Bank and Indian Bank are somewhat isolated, indicating they might have unique exposure profiles that do not closely align with those of the large public or private-sector banks.
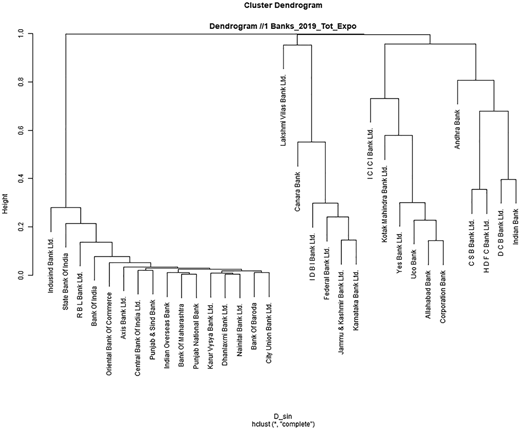
Similarity matrix dendrogram for scheduled commercial banks – 2019. Source: Authors’ calculation using CMIE dataset
Similarity matrix dendrogram for scheduled commercial banks – 2019. Source: Authors’ calculation using CMIE dataset
Similar to our findings, Elnahass et al. (2021) observed that public sector banks (PSBs) exhibit higher interconnectedness due to government-driven credit allocation policies, which can amplify systemic risks during financial distress. Systemic risk increases when banks exhibit high degrees of similarity in their credit exposure patterns, as seen in developed and emerging economies (Brechler et al., 2014; Dissem, 2019). Diversification has often been proposed as a risk mitigation strategy. Still, studies suggest that diversification can increase systemic risk if banks converge toward similar investment portfolios, thereby reducing resilience to sector-specific downturns (Wagner, 2010).
4.2 After the Indian Bank mergers or COVID-19 pandemic
From 2018 to 2023, major bank mergers occurred, including consolidating ten PSBs into four and merging HDFC Bank with HDFC Ltd. These mergers pose significant implications for systemic risk. They led to larger, more interconnected banks with higher exposure to similar sectors, potentially increasing systemic fragility. Our analysis shows that the similarity among PSBs rose post-merger, suggesting a higher degree of interconnected risk.
Figure 6 presents the results of the similarity matrix for Indian banks as of March 2021. The result reveals the average similarity in the total credit exposure of Indian banks in 2021 is 0.2799, and the average similarity in the fund- and non-fund-based credit exposure is 0.2629 and 0.3066, respectively. Using the WSS and Silhouette method, the correlogram suggests three optimal clusters. Cluster 1 includes Public Sector Banks with State Bank of India, Bank of India, Bank of Baroda, Canara Bank, Punjab & Sind Bank, Union Bank of India, and UCO Bank. These banks show strong intercorrelations, reflecting similar exposure patterns. Cluster 2 includes Private Sector Banks with HDFC Bank Ltd., ICICI Bank Ltd., Axis Bank Ltd., and Kotak Mahindra Bank Ltd. These banks show weaker correlations with many public sector banks. This reflects their differentiated business models and risk profiles. Cluster 3 includes Regional and Specialized Banks with City Union Bank Ltd., Karur Vysya Bank Ltd., Lakshmi Vilas Bank Ltd., and Yes Bank Ltd. These banks show unique patterns, suggesting regional or niche market focus. The 2021 correlogram reveals that many banks continue to have strong interrelationships, particularly among public sector banks, similar to 2019. However, some banks have shifted their positions, indicating changes in exposure strategies.
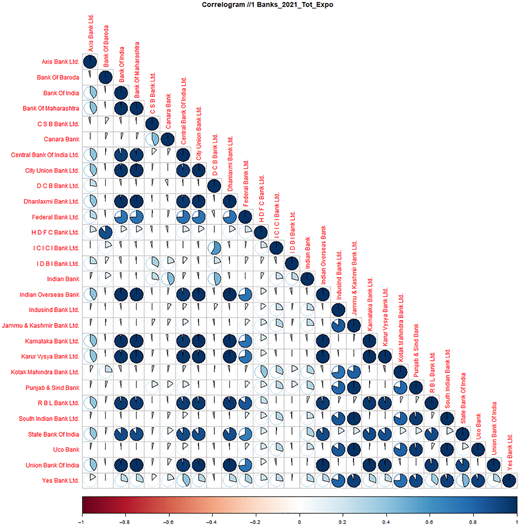
Similarity matrix correlogram for scheduled commercial Banks – 2021. Source: Authors’ calculation using CMIE dataset
Similarity matrix correlogram for scheduled commercial Banks – 2021. Source: Authors’ calculation using CMIE dataset
Figure 7 shows a dendrogram of the hierarchical clustering of various banks based on their total exposure data for 2021. The height at which two banks are joined indicates their dissimilarity. At a higher height, the dendrogram branches out, indicating more distinct clusters. Axis Bank Ltd. and Federal Bank Ltd. are relatively distinct from the other banks, forming their branches. Significant branches are on the right side, including banks like DCB Bank Ltd. and ICICI Bank Ltd.
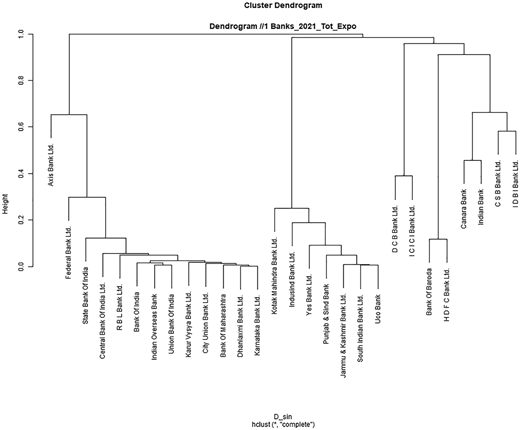
Similarity matrix dendrogram for scheduled commercial Banks – 2021. Source: Authors’ calculation using CMIE dataset
Similarity matrix dendrogram for scheduled commercial Banks – 2021. Source: Authors’ calculation using CMIE dataset
Figure 8 provides an overview of the mean asset exposure across various sectors in 2023. The “Other Than Industry” sector stands out prominently with the highest mean asset exposure, exceeding 30, indicating a significant preference for lending in this category. Among the industries, the infrastructure sector also holds considerable lending interest, albeit to a lesser extent. Other sectors like NBFCs (Non-Banking Financial Companies), retail finance, textiles, finance and leasing, construction and allied activities, electricity, and trading exhibit lower mean asset exposures. The exposure gradient further emphasizes the lending inclination, with darker shades representing higher exposure levels. Overall, the chart indicates a strong lending preference towards non-industry-related sectors and infrastructure, highlighting strategic asset allocation by financial institutions.
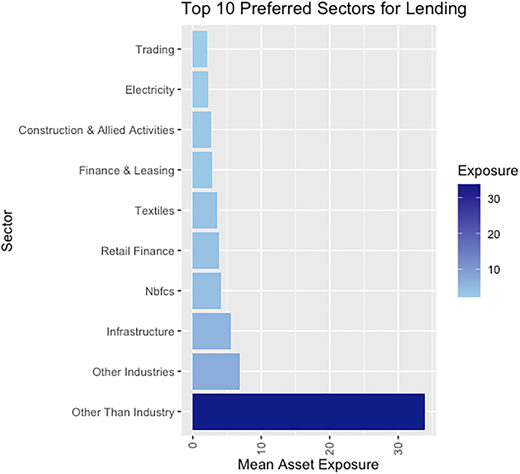
Credit exposure of banks to selective sectors in India – 2023. Source: Centre for monitoring Indian Economy, 2023
Credit exposure of banks to selective sectors in India – 2023. Source: Centre for monitoring Indian Economy, 2023
Figure 9 presents the results of the similarity matrix for Indian banks as of March 2023. The result reveals the average similarity in the total credit exposure of Indian banks in 2019 is 0.2991, and the average similarity in fund- and non-fund-based credit exposure is 0.2629 and 0.3234, respectively. Using the WSS and Silhouette method, the correlogram suggests three optimal clusters. Cluster 1 includes a mix of large public sector banks as well as several private sector banks like State Bank of India, RBL Bank Ltd., Bank of Baroda, Axis Bank Ltd., Central Bank of India, City Union Bank Ltd., Union Bank of India, Bank of Maharashtra, Indian Overseas Bank, South Indian Bank Ltd., Dhanlaxmi Bank Ltd., Bandhan Bank Ltd., Karnataka Bank Ltd., Nainital Bank Ltd. Including a wide range of banks suggests that these institutions have similar exposure profiles, indicating similar risk management practices or target markets. Cluster 2 predominantly comprises private sector banks like IDFC First Bank Ltd., Federal Bank Ltd., ICICI Bank Ltd., DCB Bank Ltd., Karur Vysya Bank Ltd., and Jammu & Kashmir Bank Ltd. These banks likely share similar exposure strategies, perhaps focusing on specific sectors or client bases. The presence of IDFC First Bank and ICICI Bank suggests a focus on diversified yet strategic exposures. Cluster 3 includes a mix of public and private sector banks. The inclusion of HDFC Bank, a leading private sector bank, along with public sector banks like Canara Bank and Indian Bank, indicates a cluster with potentially robust risk management frameworks. These banks may share common strategies for diversifying their exposure to mitigate risks.
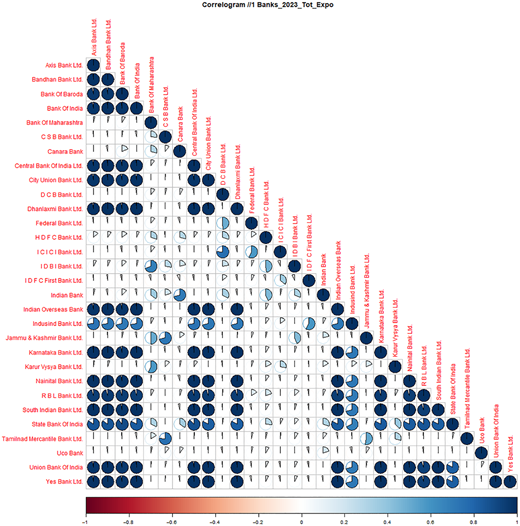
Similarity matrix correlogram for scheduled commercial banks – 2023. Source: Authors’ calculation using CMIE dataset
Similarity matrix correlogram for scheduled commercial banks – 2023. Source: Authors’ calculation using CMIE dataset
Figure 10 shows the hierarchical clustering of banks based on their total exposure in 2023. The hierarchical structure indicates the level of similarity. For example, IndusInd Bank Ltd. and RBL Bank Ltd. are close, suggesting nearly identical exposure profiles. In contrast, their cluster’s separation from others, like IDFC First Bank Ltd., indicates some strategic differences. Since many large public sector banks (e.g. State Bank of India, Bank of Baroda) are clustered together, a sector-specific downturn could significantly impact them. The dendrogram reveals distinct clusters of banks with similar exposure profiles, providing valuable insights for strategic planning, risk management, and regulatory oversight.
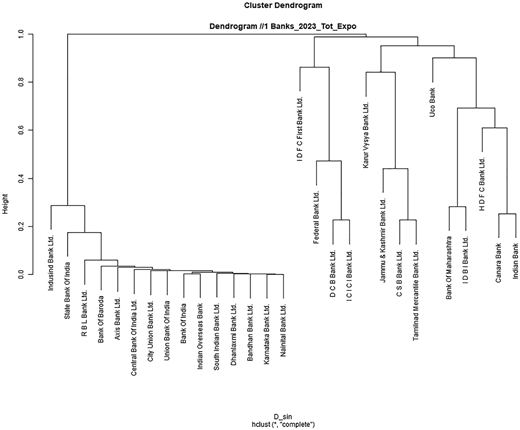
Similarity matrix dendrogram for scheduled commercial banks – 2023. Source: Authors’ calculation using CMIE dataset
Similarity matrix dendrogram for scheduled commercial banks – 2023. Source: Authors’ calculation using CMIE dataset
The results align with prior research showing that financial crises intensify systemic risks, mainly when banks exhibit high asset similarity. However, our findings diverge from studies on banking systems in developed economies, where higher capital buffers and diversified portfolios helped mitigate the impact of COVID-19 to some extent (Miklaszewska et al., 2021). Unlike in developed economies, where regulatory measures such as stress tests and capital adequacy requirements helped cushion banks against the pandemic’s economic shock (Danisman et al., 2021), Indian banks, particularly PSBs, remained highly vulnerable due to concentrated exposures.
5. Implications
5.1 Theoretical implications
Our empirical findings reveal the existence of significant clusters within the Indian banking sector, suggesting that systemic risk is not uniformly distributed but concentrated within specific groups of banks. The hierarchical clustering results indicate that PSBs tend to form tightly connected clusters, likely due to their similar lending patterns and government-driven mandates. Private sector banks, in contrast, exhibit more diverse clustering behavior, with some aligning closely with PSBs and others maintaining distinct credit exposure profiles.
5.2 Practical implications
One of the key implications of these findings is the increased risk of financial contagion within PSBs post-merger. The reduction in the number of PSBs has led to greater homogeneity in their asset exposures, meaning that a shock affecting one major PSB could have ripple effects across the entire public banking segment. On the other hand, large private sector banks such as HDFC Bank and ICICI Bank, while clustered together, maintain some degree of differentiation in their credit exposure patterns, which may provide a buffer against systemic risk. The similarity matrix and clustering results demonstrate that a liquidity crisis or a significant rise in non-performing assets (NPAs) in one major bank, particularly within the PSB segment could have spillover effects on others due to their interconnected balance sheets and similar exposure structures. This could lead to credit supply constraints, higher funding costs, and capital adequacy concerns, particularly during economic downturns. From a policy perspective, regulators can consider implementing enhanced stress testing frameworks incorporating clustering-based risk assessments. Additionally, targeted macroprudential measures, such as differentiated capital requirements or liquidity buffers for highly correlated banks, may help mitigate contagion risks.
5.3 Limitations and directions for future research
While this study provides important insights into systemic risk and credit exposure clustering in Indian banks, certain limitations should be acknowledged. First, the study covers a five-year period (2018–2023), which may not fully capture long-term structural shifts in banking sector risks, especially those emerging from economic cycles, regulatory changes, or technological advancements in financial services. Second, while our analysis focuses on Indian banks, similar credit exposure patterns and clustering phenomena have been observed in other emerging markets. A comparative study across multiple economies with similar financial structures could provide broader insights into how global credit risk clustering affects financial stability. Third, our study relies on available data from banking sector reports and financial statements, which may not fully account for off-balance sheet exposures, shadow banking activities, or informal credit channels. Incorporating alternative datasets, such as stress test results or real-time transaction-level data, could enhance the robustness of systemic risk assessments. Overall, this study contributes to understanding systemic risk in emerging market economies by demonstrating the applicability of clustering methodologies to banking sector. Future research could extend this approach by incorporating risk-adjusted similarity measures or examining the impact of regulatory interventions on clustering dynamics or taking the entire financial intermediaries.
6. Conclusion
This paper explores the cosine similarity of asset exposures of Indian banks for the period 2018–2023 using the method applied to Czech banks by Brechler et al. (2014). The close clustering of many public sector banks highlights high similarity in their exposure patterns. This suggests systemic risks or economic conditions affecting one of these banks could impact others in this cluster. The private sector banks show more variation in their clustering, indicating diverse strategies and market approaches. This diversity might offer resilience to the banking sector, as these banks are less likely to be uniformly affected by market changes than the more homogeneous public sector banks.
Similarities in credit exposures are higher in mid-sized banks, while large banks such as the State Bank of India and HDFC Bank have different asset exposures. However, HDFC Bank and ICICI Bank fall into the same cluster and have similar asset exposures. Most public and established private sector banks tend to be more similar and are in the middle of the cosine similarity matrix. This implies that a significant number of banks are exposed to similar kinds of risk resulting from their loan portfolios. The overall strength of correlations appears more pronounced after the Indian bank’s mergers, with larger dark blue circles indicating stronger relationships between banks' exposures than before the merger. This seems risky, as half of the banking system is vulnerable to any change in the performance of the assets, thereby creating a potential systemic risk to the entire banking system. Moreover, the largest bank in India and one of the systemically important banks in India, the State Bank of India, is in the same cluster. Our results show that there are seeds of potential vulnerabilities in the Indian banking sector, leading to stress and strain in the financial system from any negative shock. The clustering analysis reveals that banks with similar credit exposure patterns tend to be concentrated in specific sectors, particularly infrastructure, real estate, and fund-based financial services. Given the long-term nature of infrastructure and real estate lending, these clusters face potential maturity mismatches and asset quality deterioration during economic downturns. If an adverse shock affects one of these high-exposure sectors, the interconnected nature of these clusters could amplify financial distress across the banking system. The findings indicate that financial stability risks in Indian banking stem from homogeneous credit exposure rather than diversification. The results of this study highlight the growing interconnectedness of Indian banks and the implications for financial stability. Our analysis suggests systemic risk concerns are particularly pronounced within the PSB segment due to their increased clustering post-merger. The findings also underscore the need for differentiated regulatory interventions, as systemic vulnerabilities may vary significantly across different bank clusters.
Notes
The Reserve Bank of India has identified three banks, The State Bank of India, HDFC Bank and ICICI Bank, as domestic systematically important banks (D-SIBs) on the basis of factors such as size, cross-jurisdictional activities, complexity, interconnectedness and lack of substitution.
A dendrogram is a type of tree diagram showing hierarchical clustering: relationships between similar sets of data.
The total within-cluster sum of square (WSS) measures the compactness of the clustering. The smaller the WSS value, the better the results. The silhouette value provides an understanding of how similar each object is to its own cluster, measuring the quality of a clustering. A higher average silhouette value implies good clustering.
In Indian banking, “fund-based exposure” denotes the credit where the bank disburses actual funds to borrowers, including loans and cash credits, with applicable interest rates. Conversely, “non-fund-based exposure” involves commitments to extend credit without immediate disbursement, such as guarantees and letters of credit, usually accompanied by fees. The “total exposure” amalgamates fund-based and non-fund-based exposures, comprehensively assessing the bank’s overall credit risk to a borrower or counterparty.
R software codes will be provided on request.

