
1-20 of 9399
Keywords: SOR
Close
Follow your search
Access your saved searches in your account
Would you like to receive an alert when new items match your search?
Journal

Focuses on developments in the creation storage usage share archival and destruction of information and data.
in A hierarchical multistage semantic fusion framework for multimodal sentiment analysis
> Aslib Journal of Information Management
Published: 25 September 2026
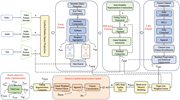
Figure 1 HMSF model framework. Source(s): Figure by authors A diagram illustrating the hierarchical multimodal sentiment fusion model framework. A diagram of the hierarchical multimodal sentiment fusion model framework. The diagram includes several key components: Video Feature Encoder, Audi... More about this image found in HMSF model framework. Source(s): Figure by authors A diagram illustrat...
in User engagement behaviours with identity-disclosed social bots on social media: the role of perceived human–machine differences
> Aslib Journal of Information Management
Published: 25 September 2026
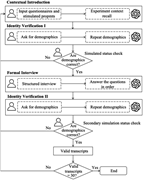
Figure 1 Stimulated interview procedures. Source(s): Authors' own work Flowchart depicting a process with multiple steps and decision points. The flowchart begins with a contextual introduction where input questionnaires and stimulated prompts are provided, followed by experiment context recal... More about this image found in Stimulated interview procedures. Source(s): Authors' own work Flowchart ...
in User engagement behaviours with identity-disclosed social bots on social media: the role of perceived human–machine differences
> Aslib Journal of Information Management
Published: 25 September 2026
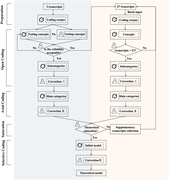
Figure 2 LLM-enhanced grounded theory coding procedure. Source(s): Authors' own work A flowchart of the LLM-enhanced grounded theory coding procedure. The image depicts a detailed flowchart illustrating the LLM-enhanced grounded theory coding procedure. The flowchart is divided into three main... More about this image found in LLM-enhanced grounded theory coding procedure. Source(s): Authors' own work...
in User engagement behaviours with identity-disclosed social bots on social media: the role of perceived human–machine differences
> Aslib Journal of Information Management
Published: 25 September 2026
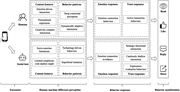
Figure 3 A four-stage behaviour model of human–machine differences perception and user engagement in social media contexts. Source(s): Authors' own work Diagram illustrating differences between human and social bot interactions on social media. The diagram is divided into four main stages: enc... More about this image found in A four-stage behaviour model of human–machine differences perception and us...
Journal Articles
Aslib Journal of Information Management 1–27.
Published: 25 September 2026
Journal Articles
Aslib Journal of Information Management 1–19.
Published: 25 September 2026
Includes: Supplementary data
Journal Articles
Aslib Journal of Information Management 1–32.
Published: 24 September 2026
in Uncovering the innovation effects and multiple antecedents of employee role orientations in human-generative AI collaboration: a social information processing perspective
> Aslib Journal of Information Management
Published: 24 September 2026
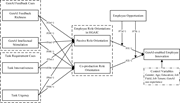
Figure 1 Research model. Source(s): Authors' own work A conceptual framework diagram showing relationships among employee role orientations, GenAI-enabled employee innovation, and their antecedents. A conceptual framework diagram illustrating the relationships among various factors influencing... More about this image found in Research model. Source(s): Authors' own work A conceptual framework diag...
in Uncovering the innovation effects and multiple antecedents of employee role orientations in human-generative AI collaboration: a social information processing perspective
> Aslib Journal of Information Management
Published: 24 September 2026
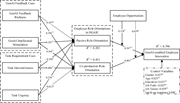
Figure 2 Results of the structural model analysis. Note: non-significant = ns, *p < 0.05, **p < 0.01, ***p < 0.001. Source(s): Authors' own work A diagram of the structural model analysis showing relationships between various factors affecting GenAI-enabled employee innovation. The diagram illustrates the structural model analysis, highlighting the relationships between different factors and their impact on GenAI-enabled employee innovation. The model includes several key components: GenAI feedback richness, GenAI intellectual stimulation, task innovativeness, task urgency, employee role orientations in high-generative artificial intelligence contexts (HGAIC), employee opportunism, and GenAI-enabled employee innovation. Arrows indicate the direction and significance of the relationships between these components. GenAI feedback richness positively influences co-production role orientation but not passive role orientation. GenAI intellectual stimulation positively affects both passive and co-production role orientations. Task innovativeness negatively impacts passive role orientation and positively influences co-production role orientation. Task urgency positively affects passive role orientation but not co-production role orientation. More about this image found in Results of the structural model analysis. Note: non-significant = ns, ...
in Uncovering the innovation effects and multiple antecedents of employee role orientations in human-generative AI collaboration: a social information processing perspective
> Aslib Journal of Information Management
Published: 24 September 2026
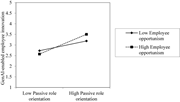
Figure 3 Moderating role of employee opportunism between passive role orientation and GenAI-enabled employee innovation. Source(s): Authors' own work A line graph showing the relationship between passive role orientation and GenAI-enabled employee innovation, moderated by employee opportunism. ... More about this image found in Moderating role of employee opportunism between passive role orientation an...
Journal Articles
Aslib Journal of Information Management 1–26.
Published: 18 September 2026
Includes: Supplementary data
Journal Articles
Aslib Journal of Information Management 1–19.
Published: 18 September 2026
in Benefiting others, benefiting ourselves: exploring the impact of joining online medical teams from a physician's perspective
> Aslib Journal of Information Management
Published: 18 September 2026
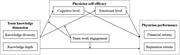
Figure 1 Research model A diagram of a research model illustrating the relationships between team knowledge dimensions, physician self-efficacy, team work engagement, and physician performance. A diagram of a research model illustrating the relationships between team knowledge dimensions, phys... More about this image found in Research model A diagram of a research model illustrating the relationsh...
in Benefiting others, benefiting ourselves: exploring the impact of joining online medical teams from a physician's perspective
> Aslib Journal of Information Management
Published: 18 September 2026
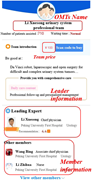
Figure 2 The original data of a physician team A table displaying the original data of a physician team. The table presents the original data of a physician team, including various attributes and metrics. It consists of several rows and columns, detailing information such as the number of pati... More about this image found in The original data of a physician team A table displaying the original da...
in Benefiting others, benefiting ourselves: exploring the impact of joining online medical teams from a physician's perspective
> Aslib Journal of Information Management
Published: 18 September 2026
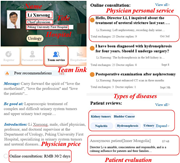
Figure 3 The original data of a physician A physician profile page with various sections and annotations. The image displays a detailed profile page of a physician named Li Xuesong, who is a chief physician at Peking University First Hospital in the Urology department. The profile includes a p... More about this image found in The original data of a physician A physician profile page with various s...
in Benefiting others, benefiting ourselves: exploring the impact of joining online medical teams from a physician's perspective
> Aslib Journal of Information Management
Published: 18 September 2026
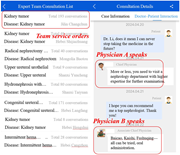
Figure 4 The original data of a team order A screenshot of a medical consultation platform showing team service orders and a detailed consultation between a patient and physicians. The image is divided into two main sections. On the left, there is a list titled 'Expert Team Consultation List' ... More about this image found in The original data of a team order A screenshot of a medical consultation...
in Benefiting others, benefiting ourselves: exploring the impact of joining online medical teams from a physician's perspective
> Aslib Journal of Information Management
Published: 18 September 2026
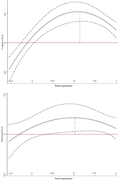
Figure 5 The adjustment effect diagrams Two line graphs depict the moderating effect of team engagement on cognitive and emotional levels. The image contains two line graphs that illustrate the moderating effect of team engagement on cognitive and emotional levels. The top graph shows the rela... More about this image found in The adjustment effect diagrams Two line graphs depict the moderating eff...
in Benefiting others, benefiting ourselves: exploring the impact of joining online medical teams from a physician's perspective
> Aslib Journal of Information Management
Published: 18 September 2026
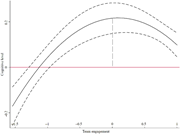
Figure 6 The adjustment effect A line graph showing the relationship between team engagement and cognitive level. A line graph depicts the relationship between team engagement and cognitive level. The horizontal axis represents team engagement, ranging from -1.5 to 1, and the vertical axis rep... More about this image found in The adjustment effect A line graph showing the relationship between team...
in Beyond algorithmic control: developing a multidimensional scale of algorithmic punishment in food-delivery platforms
> Aslib Journal of Information Management
Published: 18 September 2026
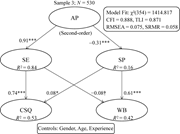
Figure 1 Structural equation model for nomological validation of the algorithmic punishment scale. Note. AP = algorithmic punishment (second-order construct reflected by APS, APR, and APU); SE = standardised empowerment; SP = standardised pressure; CSQ = service quality commitment; WB = workaround behaviours. Standardised path coefficients are shown for the main structural paths. Controls (gender, age, experience) are included in the model but omitted from the figure for clarity. ***p < 0.001, **p < 0.01, *p < 0.05, †p < 0.10. Source: Authors’ own work A diagram of a structural equation model for nomological validation of the algorithmic punishment scale. The diagram represents a structural equation model used for the nomological validation of the algorithmic punishment scale. It includes several key components: AP, which stands for algorithmic punishment and is a second-order construct reflected by APS, APR, and APU; SE, which stands for standardized empowerment; SP, which stands for standardized pressure; CSQ, which stands for service quality commitment; and WB, which stands for workaround behaviors. The model shows standardized path coefficients for the main structural paths. Controls such as gender, age, and experience are included in the model but are omitted from the figure for clarity. The diagram illustrates the relationships and interactions between these components, with significant paths marked by asterisks indicating levels of statistical significance. More about this image found in Structural equation model for nomological validation of the algorithmic pun...

