


The purpose of this study is to provide models to analyze the efficiency of programs and efficiency of fundraising to apply the models to non-profit organizations (NPOs) in Korea and to draw out improvement points of inefficiency using data envelopment analysis (DEA).
Using DEA, this study analyzed the program efficiency and fundraising efficiency of 22 Korean NPOs in the field of humanitarian assistance.
Of 22 NPOs, 15 were identified as being efficient in the program efficiency and 7 of 15 NPOs were found efficient in the fundraising efficiency. In all, four organizations were found efficient in both the program and the fundraising efficiency. Using CCR and BCC model, this study proposed the cause of inefficiency and state of returns of scale.
This study presents non-profit efficiency evaluation models regarding program efficiency and fundraising efficiency. This study provides the inefficient DMUs with their reference set of efficient DMUs to improve efficiency and the cause of inefficiency, whether the inefficiency is because of the pure technical inefficiency or the scale inefficiency. This study also indicates the state of variable returns to scale to propose the way of improving inefficiency by controlling the scale of inputs. The methods and the results of this study can serve as a model for researchers and practitioners to follow when evaluating efficiency in the NPOs.
This study has the value of performing the empirical studies of efficiency analysis of Korean NPOs and providing non-profits with the model of efficiency analysis in programs and fundraising activities and basis for establishing strategies to improve both efficiencies.
1. Introduction
A non-profit organization (NPO) is a term that refers to an institution that is legally constituted, non-governmental entities incorporated under the law as a charitable or non-profit corporation that has been established to serve the public purpose and hold tax-exempt (Wolf, 2012). The performance measurement in NPOs has received relatively scant attention compared to that of for-profit organizations. NPOs have tried to embed for-profit approach to their management (Han and Moon, 2003; Burnett and Campbell, 2011) and the performance evaluation has become a critical topic of NPO management.
The efficiency in NPOs is hard to define, whereas that in for-profit is defined as the ratio relating outputs to inputs. Financial indicators such as net income and rates of return that provide operating efficiency in competitive output markets are not useful in non-profit entities (Nunamaker, 1985). NPOs are mission-oriented, and the missions are abstractly defined as solving social problems or pursuing public good. This makes NPOs hard to decide what to measure and how to measure their mission is achieved. Another difficulty of defining efficiency in non-profit entities is because of the complexity of theory of change. Theory of change is a visual representation of the presumed causal route linking a program’s activities and purposed outcomes (Anderson, 2005). There are many interventions and multilayers of stakeholders in the causal linkage that are not included in the theory of change but affect the results directly and indirectly when a non-profit design theory of change to solve a specific problem (Kim et al., 2017). The complexity of theory of change and multilayers of stakeholders make it difficult to measure the performance. Also, non-profit professionals hold the prevailing idea that it is not necessary to calculate the efficiency of meaningful social works with philanthropic. The purpose of non-profits is to make better lives of individuals, organizations, communities and society as a whole. Thus, the effectiveness that explains how well the mission is achieved is considered important, and the efficiency that explains output verse input has been considered less relevant. This was an obstacle for NPOs to develop the notion of efficiencies. Along with these difficulties, research on performance measurement in NPOs is still quite limited compared to that of for-profit organizations.
However, working environment for an NPO has been changed. Donors’ interest and knowledge in where and how their gifts are spent are growing. The scandals of NPOs have multiplied donors’ concerns and suspects on the operation of NPOs. Excessive fundraising expense has raised an ethical issue, and the Korean law of regulating NPOs’ fundraising and spending imposes a limit on the ratio of fundraising expense by the amount of donation. NPOs have made efforts to make NPOs more accountable and reduce donors’ suspects by disclosing financial information online. Korean government regulated that NPOs with 10 billion KRW or more of the asset are obliged to disclose their financial information on the Korean tax information website.
Most of the NPOs receive government’s grant. The issue of efficiency in NPOs has emerged as the amount of government’s spending in social welfare has been drastically growing. This is one of the reasons that NPOs should pursue efficiency and be accountable for their outcomes. Also, NPOs’ fundraising environment has changed. Fundraising in NPOs has become more competitive. To raise more gifts, NPOs have to compete with other organizations of the similar philanthropic goals and ones in different sectors. Nowadays, NPOs have to compete even with hybrid forms of philanthropic institutions. Social enterprises emerged to solve the problems caused by the failure of the market, government and voluntary sector (Yang et al., 2018). The emergence of corporate social responsibility and social enterprises made philanthropy not limited in the realm of traditional NPOs.
The development of IT technology made donors access easily to acquire financial and performance information of an NPO. Donors are concerned with which NPO performs better among non-profits with a similar mission when they decide where to give. In the break of a series of NPOs’ malfunctioning, the public became aware of the fact that how good intentions an NPO has is not always consistent with how well it performs. Given the importance of public trust to the sector, it is vital to restore public confidence in NPOs and survive sector-wide controversies. To respond to these changes in the environment where NPOs are working, the betterment of efficiency has become vital.
The non-profit literature is not as rich as the public sector, while there is growing literature using data envelopment analysis (DEA) and other analytical methodologies to evaluate performance. Especially, the empirical studies in the non-profit sector need to be done more to respond to the challenges of evaluating non-profit efficiency. The purpose of the study is to analyze the efficiency of the NPOs, using DEA and to draw out improvement points of inefficiency. Specifically, this study attempts to make three primary contributions to the field of NPOs. First, it presents models that can evaluate NPOs by program efficiency and fundraising efficiency indicators. Second, the study attempts to analyze relative efficiency of NPOs in Korea, using DEA. Third, the study provides the cause of inefficiency and the information on the state of variable returns to scale and proposes the strategy to improve the efficiency.
The paper is organized as follows. The next section contains the background and literature review. In the third section, research methodology is developed. The results of the analysis are discussed in the fourth section, with some brief concluding remarks and future research provided in the final section.
2. Background and literature review
2.1 Performance evaluation for non-profit
Performance assessments for non-profit institutions can be analyzed regarding efficiency and effectiveness and include both financial and non-financial measures. To develop performance metrics that represent financial and non-financial performance, it has been tested to group the organization’s activities into five categories following the theory of change: input, activity, output, results and impact (Epstein and McFarlan, 2011).
Both researchers and practitioners have increasingly paid their attention to the topics of efficiency and developed the efficiency indicators. Ritchie and Kolodinsky (2003) examined financial performance measurement ratios using data from 15 Internal Revenue Service (IRS) Form 990 line items and interviewed key informants in NPOs. From these two sources, they categorized the performance factors as fundraising efficiency, public support and fiscal performance. Fundraising efficiency represents total amount raised relative to monies spent on the fundraising activities (Greenlee and Bukovinsky, 1998). The public support indicates an organization’s ability to generate revenue or the public support for an organization and the fiscal performance represents the ratio of total contributions relating to total expenses (Siciliano, 1996).
Greenlee and Bukovinsky (1998) suggested that program service expense ratio and program service expense to total assets could measure how the resources were used to support the mission of the NPO. Program service expense ratio measures the relationship between funds spent performing charitable work and total expenses. Program service expense to total asset measures the efficient use of assets to provide services.
Program efficiency can be approached in contrast to administrative expense. Greenlee and Brown (1999) analyzed the administrative expense and fundraising expense from approximately 700 NPOs in Pennsylvania and found that administrative expense, fundraising expense and the contributions are the factors affecting fundraising amount. Okten and Weisbrod (2000) analyzed the effects of NPOs’ operating expenses and advertising and publicity costs on the contributions given to NPOs. As a result, the general administration expenditure has a negative effect on donation amount.
Fundraising efficiency is important regarding the NPO–donor relationship and public relations. From the stewardship point of view, NPOs need to ensure that their fundraising activities are as efficient as possible by not spending excessive amount to raise donations. Waters (2011) contended that developing the NPO–donor relationship is an effective strategy to raise more funds by encouraging loyalty. From public relations perspective, they need to demonstrate their efforts to their donors and stakeholders (Sargeant and Shang, 2010).
Greenfield (1996) proposed six fundraising performance measurement indices: percent participants representing participants divided by total solicitations made, average gift size, net income, the average cost per gift representing expenses divided by income received and return representing net income divided by expenses.
There have been some conflicting studies regarding the relationship between administration costs and fundraising results. Frumkin and Kim (2001) classified NPOs into six groups according to institutional characteristics and analyzed the relationship between the administration efficiency and donations. The results of the analysis show that administrative efficiency does not have a significant effect on donations. Shin and Lee (2008) analyzed the financial data of 12 NPOs and found that the increase of the administration cost to the donation has likely to have a negative influence on the donor’s donation intention. Jacobs and Marudas (2003) found that the increase in administrative costs at the end of the year has a negative impact on donations. Chung (2003) contended that it would be possible to attract more donors if administrative efficiency is improved through the establishment and management of thorough business strategies while seeking the administrative efficiency and efficiency in consideration of the characteristics of NPOs.
Medina-Borja and Triantis (2014) focused on the need of considering multiple dimensions of NPO’s performance measurement system. They modeled a four-stage DEA approach to evaluate fundraising efficiency, capacity building, service quality and effectiveness by incorporating administration and fundraising, program efficiency and outcome and effectiveness.
2.2 Data envelopment analysis
There have been developed three methodologies to analyze the efficiency of the institution: ratio analysis, regression analysis and DEA. Ratio analysis provides only the relationship between two variables with the same unit, and it is difficult to evaluate the efficiency of the institution of which activities consists of many inputs and outputs. Regression analysis evaluates efficiency by average, so there is a limit to the efficiency analysis of institutions with a variety of service level (Park et al., 2009).
DEA began with the work of Charnes et al. (1978). DEA was developed based on the fact that organizations produce outputs by transforming inputs. It is a way of analyzing relative efficiency to answer to whether the inputs are being translated into outputs most efficiently.
The efficiency in DEA is a relative efficiency in which the level of efficiency is measured by setting a frontier that can be reached empirically and using the best practice point as an evaluation criterion. When evaluating the efficiency of a decision unit (DMU) in DEA, the inputs or outputs are compared with a similar reference set to assess the efficiency (Choi et al., 2010).
A collection of possible combinations of input and output is a production possibility set if a certain level of input produces a certain level of output. The outer boundary of the production possibility set is the production frontier, and the observed value on the production frontier is in an efficient state. As shown in Figure 1, the production frontier satisfying the constant returns to scale (CRS) is given as a straight line passing from starting point to point B given A, B, C and D production possibility set. The production frontier is given by the line connecting Points A, B and C, the vertical line from Point A and the horizontal line from Point C. As the input of D can be reduced to that of D1, the efficiency value is given as D1D2/DD2 in the condition of variable returns to scale (VRS).
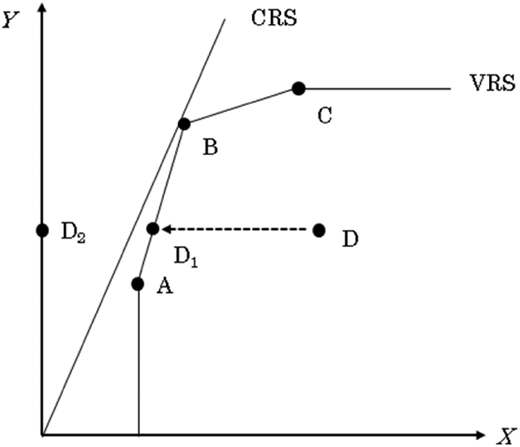
An example of the production frontier
An example of the production frontier
DEA has the advantages as follows. First, DEA can measure relative efficiency. Efficiency can be divided into absolute efficiency and relative efficiency. Absolute efficiency means the ratio of the output to the input of the entity. Relative efficiency is the efficiency value of an entity compared to that of other entities. DEA is a key method to suggest relative competitiveness by measuring the relative efficiency of the entity subject to the most efficient entity. The second advantage of DEA is that it can consider simultaneously multiple outputs and inputs. The third advantage of DEA is it can find if the inefficiency is because of the inefficiency of the scale or technical inefficiency and suggest potential improvements. The fourth advantage of DEA lies in its non-statistical attribute. In regression analysis, statistical assumptions are made for the distribution of residuals to estimate the production function. However, as DEA has its non-statistical attribute, it is not necessary to make statistical assumptions about this residual, and the efficiency is estimated by estimating the production relation with only given data. The fifth advantage of DEA is its non-parametrical attribute. In general, a production function is assumed, and its parameter is estimated. However, DEA does not make assumptions on the production function. It has a property of non-parametrically estimating the relationship between inputs and outputs with given data only. This has the advantage of avoiding errors in the function setting of the analyst.
DEA has been used consistently to assess the efficiency of public organizations such as libraries, hospitals, universities and art and culture centers because they have many types of input and output and they often have outputs without price (Hollingsworth, 2008; Reichmann and Sommersguter-Reichmann, 2006; Colbert et al., 2000; Lee and Kim, 2016).
2.3 Non-profit organizations in Korea
According to the Korea National Tax Service, there are 33,888 NPOs registered in Korea. The number of NPOs registered with the Korean Tax Service has increased 23 per cent in past ten years. Since the late 1990s, the Korean NPOs have actively begun to raise donations from the private sector, and the contribution amount has grown rapidly since the 2000s. As the number of Korean NPOs and the giving amount increases, the demand for non-profit’s accountability and quality of services does as well.
Korean NPOs are classified into seven sectors: religion, social welfare, education, academy, art and culture, medical care and others. The majority of Korean NPOs are religious institutions and non-profit institutions providing services for the academy and social welfare following religious institutions take the portion of 12.9 and 10.2 per cent, respectively. Table I presents the current status of Korean NPOs.
3. Methodology
3.1 Humanitarian assistance organizations
The non-profit sector is diverse in terms of the organizational objectives the institutions pursue. As the purpose of the study is to analyze the relative efficiency in the non-profit sector, it is important to compare an organization against organizations with similar missions and service programs.
This study selected 22 humanitarian assistance organizations located in Korea as the subjects of the analysis. Humanitarian assistance refers to the activities that are purposed for social, economic and environmental improvements including humanitarian relief or emergency aid as well as development assistance for a long-term sustainable change (Sowers and Rowe, 2007; Bess and Link, 2011).
The data were collected from information that was disclosed through the information disclosure system of Korea National Tax Service. This system requires financial information of NPOs with more than 10 billion KRW of assets to be disclosed and recommend organizations with less size of assets to. Among 9,713 NPOs whose information was released in 2017, the study selected 22 humanitarian assistance organizations that are actively working for children and adolescents’ relief and development in Korea or internationally with all contributions more than 1 billion KRW and program expenditure 1 billion KRW. They belong to the social welfare or others by the sector standard of Korea National Tax Statistic. By sorting the description of the mission and programs, the 22 NPOs were identified as pursuing the similar mission and serve similar beneficiaries. Table II presents the descriptive statistics of the selected 22 NPOs for the study.
Descriptive statistics of 22 NPOs
| Variables | Mean | SD | Minimum | Maximum |
|---|---|---|---|---|
| Years in operation | 27 | 26 | 3 | 113 |
| Number of employees | 361 | 768 | 7 | 3,500 |
| Asset (KRW) | 82,136,693,091 | 182,656,297,139 | 715,036,000 | 690,425,219,000 |
| Revenue (KRW) | 108,007,168,727 | 193,665,653,320 | 1,529,414,000 | 717,234,064,000 |
| Purposed program expenditure (KRW) | 83,561,185,273 | 147,086,292,670 | 1,323,864,000 | 576,618,709,000 |
| General management and fundraising expense (KRW) | 10,283,246,136 | 13,310,891,549 | 220,017,000 | 42,717,990,000 |
| Labor cost (KRW) | 15,779,661,227 | 38,831,922,799 | 156,775,000 | 181,280,785,000 |
| All contributions | 95,752,274,682 | 160,323,308,682 | 1,528,680,000 | 615,602,573,000 |
| Donations (KRW) | 68,010,786,857 | 126,227,478,769 | 345,820,560 | 574,204,679,669 |
| Number of beneficiaries | 2,067,192 | 4,523,816 | 383 | 18,983,891 |
In DEA, a subject of analysis is referred to a decision-making unit (DMU). The total number of DMUs is 22, which is more than three times the sum of the number of the input and output variables. Thus, the size of DMUs was qualified for further analysis (Kim and Choi, 2005).
3.2 Performance measures
The primary work of scope in NPOs is to execute purposed programs that pursue the missions such as relief of hunger, natural crisis, environmental protection and so on and to raise funds to meet the financial needs required to perform the purposed programs of the institutions. For-profits sell products and services, and in return, users pay for them. NPOs operate differently. Those who use products and services and those who pay for them are different. NPOs work on two major pillars: program execution and fundraising activities. An NPO set its mission and goals and plan programs to achieve the goals. The resource for the program is funded mainly through donations and grants, and the funds are used for the planned programs and beneficiaries. Thus, the study divided efficiency into program efficiency and fundraising efficiency.
3.2.1 Program efficiency.
Inputs are tangible and intangible factors including cash, personnel, equipment and other material items, that enable a non-profit to perform its tasks. Outputs are the tangible and intangible products and services that are resulted from the organization’s activities. Outcomes are the specific changes in behaviors affected by the delivery of the products and service at the level of an individuals or society as a whole. Efficiency is a term that relates outputs to inputs in quantitative terms, whereas outcomes can be described in both qualitative and quantitative terms.
Program efficiency was evaluated for the purpose of measuring how efficiently the input has produced the purposed outputs in the service programs. It is to select the adequate input and output variables that are relevant to the input–output transforming process and can express the purpose of the NPO. In Son’s study (2003) to evaluate the relative efficiency of social work centers using DEA, the number of employees, the total annual operating expenses and the number of volunteers per year, and the total operating years were selected as input, and the output was selected as the number of program users per year. In the study of Kim (2004), the number of social workers, the number of volunteers, the budget amount and donation were used as inputs, and the output was assumed to be the number of users and the number of programs in measuring the relative efficiency of social work centers.
Similar to this study, the number of employees, labor cost, all contributions including donation, grants and in-kind giving, management and fundraising expense were selected as the inputs. The amount of money that has been spent on the purposed program and the number of beneficiaries are the critical outputs of NPOs that can apply to the non-profits. If the number of decision-making units may not be sufficient but the number of variables included in the model increases, then the analysis result may be distorted. Therefore, in this study, we selected variables within the limits of using available data set and maintaining the characteristics of output and input variables. Table III presents inputs and outputs for program efficiency.
3.2.2 Fundraising efficiency.
Non-profits’ fundraising activities include prospect donor research, donor relationship management, donor stewardship and online and offline giving channel management. Labor cost and expenses spent in these fundraising activities are inputs in the fundraising activities. In the study, fundraising expense and management and fundraising labor cost were selected as input variables, and the amount of donation raised was output variable. Because of the format of disclosed information, fundraising labor expense could not be separated from fundraising and management labor expense, and the sum amount of fundraising and management labor cost was used as input. The output in the fundraising activities can be the donation amount raised and the number of donors; however, the information on the number of donors was not disclosed in the information disclosure system and could not be able to be included as the output variable. Table IV presents inputs and outputs for fundraising efficiency.
Inputs and outputs for fundraising efficiency
| Categories | Inputs | Outputs |
|---|---|---|
| Variables | Fundraising expense Management and fundraising labor cost | The amount of donation |
The relative efficiency of fundraising activities was calculated by using DEA. Of the 22 DMUs analyzed for the program efficiency, 15 DMUs with valid input information for fundraising efficiency were selected.
3.3 DEA model
To evaluate the efficiency of Korean NPOs, DEA technique was used to measure a relative efficiency. DEA model is divided into CCR model developed by Charnes et al. (1978) and BCC model developed by Banker et al. (1984). The CCR model assumes constant returns to scale technology, and BCC model was proposed assuming a variable returns to scale model and alleviating the limit of the constant returns to scale model. In general, public institutions use the input-based BCC model because they implement a management policy that improves efficiency by adjusting the level of input variables and the history and size of an NPO and staff skill affect the returns to scale. NPOs working in the field of humanitarian assistance set the number of beneficiaries and fundraising goals in line with the recipient area and nature of the project. The goal is achieved by adjusting the input with the output determined. Thus, the input-based DEA analysis was adopted in the study.
In the study, the CCR model was additionally used to analyze the causes of inefficiency. The DEA method is a nonparametric statistic using linear programming. However, the correlation between variables was analyzed to see if there is a significant relationship between variables.
Suppose that there are M kinds of inputs and N kinds of outputs and J numbers of DMUs. The DEA model for calculating the efficiency of a particular DMU based on input-based BCC model can be formulated as follows:
In this study, the efficiency was analyzed using R Studio, an open source data analysis software, and SPSS 22 was used additionally for analyzing collected data.
4. Results
4.1 Program efficiency
The correlation between variables was analyzed to see if there is a significant relationship between variables as presented in Table V. There was a significant correlation with the obtained coefficient of 1.999 between all contributions and purposed program expense. The coefficient of 1.930 between management and fundraising expense and purposed program expense indicates a strong correlation. It is because the largest sources of the spending of NPOs come from donations and grants and the management and fundraising expense affects the size of all contribution and purposed program expense.
Correlation matrix for all variables
| Items | No. of employees | Labor cost | All contributions | Management and fundraising expense | Purposed program expense | No. of beneficiaries |
|---|---|---|---|---|---|---|
| Number of employees | 1 | |||||
| Labor cost | 1.992** | 1 | ||||
| All contributions | 1.661** | 1.656** | 1 | |||
| Management and fundraising expense | 1.696** | 1.669** | 1.944** | 1 | ||
| Purposed program expense | 1.642** | 1.639** | 1.999** | 1.930** | 1 | |
| Number of beneficiaries | 1.261 | 1.163 | 1.269 | 1.467* | 1.247 | 1 |
Notes:
p > 0.01;
p > 0.05
Table VI presents the relative efficiency scores of 22 NPOs calculated based on input-oriented and BCC model. The highest level of efficiency can be normalized to 1 or 100 per cent, and the relative efficiency can be expressed as, for example, 0.75 or 75 per cent. Among 22 NPOs, 15 non-profits (DMU 2, 3, 4, 5, 6, 7, 9, 12, 13, 14, 15, 16, 17, 20 and 22) are identified as being efficient with a relative efficiency score of 1. 7 NPOs are identified as being inefficient in the program efficiency.
Program efficiency score and reference set
| DMU | Efficiency | Reference set (reference weights) |
|---|---|---|
| 1 | 0.738 | DMU4 (0.043), DMU7 (0.957) |
| 2 | 1.000 | |
| 3 | 1.000 | |
| 4 | 1.000 | |
| 5 | 1.000 | |
| 6 | 1.000 | |
| 7 | 1.000 | |
| 8 | 0.663 | DMU 3 (0.165), DMU 4 (0.512), DMU 6 (0.007), DMU 12 (0.316) |
| 9 | 1.000 | |
| 10 | 0.689 | DMU 3 (0.504), DMU 7 (0.496) |
| 11 | 0.717 | DMU 4 (0.649), DMU 6 (0.016), DMU12 (0.335) |
| 12 | 1.000 | |
| 13 | 1.000 | |
| 14 | 1.000 | |
| 15 | 1.000 | |
| 16 | 1.000 | |
| 17 | 1.000 | |
| 18 | 0.764 | DMU 14 (0.634), DMU 2 (0.002), DMU 22 (0.357) |
| 19 | 0.900 | DMU 4 (0.002), DMU 17 (0.795), DMU 20 (0.153) |
| 20 | 1.000 | |
| 21 | 0.593 | DMU 13 (0.172), DMU 14 (0.537), DMU 16 (0.014), DMU 22 (0.277) |
| 22 | 1.000 |
DEA provides a reference set of efficient DMUs to which the assessed inefficient DMU is directly compared to obtain its efficiency. The reference set has a similar input combination to the assessed DMU, thus offers a direction to improve efficiency while maintaining the current production structure as a whole. Reference set information offers peer DMUs and their weights to refer to. For example, DMU 1 can refer to DMU 4 and DMU 7 to improve its efficiency by controlling the inputs reflecting the reference weights of DMU 4 and 7.
According to Farrell (1957), production efficiency is divided into technical efficiency and allocative efficiency. Technical efficiency is calculated as the relative ratio of organizations’ production factor vectors to that of the organization using the least amount of inputs in the production of a certain amount of output. Technical inefficiency refers to the extent to which the maximum output that can be produced from the combination of a given input component is not met. Technical efficiency is again classified into pure technical efficiency and scale efficiency. Pure technology efficiency refers to the effect of eliminating the effect of scale efficiency on technological efficiency. The inefficiency of scale means that the scale of production is outside the optimal size.
It can establish a strategy for efficiency improvement through analyzing whether the cause of inefficiency is in pure technical efficiency or scale efficiency. The efficiency of the scale can be calculated by dividing the efficiency of the CCR model considering the technical efficiency by the efficiency of the BCC model considering only the pure technical efficiency.
Table VII presents whether the cause of inefficiency is in pure technical efficiency or scale efficiency. The causes of five inefficient NPOs were in pure technical efficiency, and six were in the efficiency of scale. Among the 22 institutions, 11 were efficient in the CCR model, and 15 were efficient in the BCC model.
Cause of inefficiency
| DMU | Technical efficiency | Pure technical efficiency | Scale efficiency | Cause of inefficiency in pure technical efficiency | Cause of inefficiency in scale efficiency | The total value of Lambda | Returns to scale |
|---|---|---|---|---|---|---|---|
| 1 | 0.519 | 0.738 | 0.704 | * | 0.388 | IRS | |
| 2 | 0.691 | 1.000 | 0.691 | * | 48.345 | DRS | |
| 3 | 1.000 | 1.000 | 1.000 | 1.000 | CRS | ||
| 4 | 1.000 | 1.000 | 1.000 | 1.000 | CRS | ||
| 5 | 0.522 | 1.000 | 0.522 | * | 1.296 | DRS | |
| 6 | 1.000 | 1.000 | 1.000 | 1.000 | CRS | ||
| 7 | 1.000 | 1.000 | 1.000 | 1.000 | CRS | ||
| 8 | 0.629 | 0.663 | 0.948 | * | 1.191 | DRS | |
| 9 | 0.609 | 1.000 | 0.609 | * | 0.386 | IRS | |
| 10 | 0.661 | 0.689 | 0.959 | * | 0.821 | IRS | |
| 11 | 0.631 | 0.717 | 0.880 | * | 0.344 | IRS | |
| 12 | 1.000 | 1.000 | 1.000 | 1.000 | CRS | ||
| 13 | 1.000 | 1.000 | 1.000 | 1.000 | CRS | ||
| 14 | 1.000 | 1.000 | 1.000 | 1.000 | CRS | ||
| 15 | 0.474 | 1.000 | 0.474 | * | 1.296 | DRS | |
| 16 | 1.000 | 1.000 | 1.000 | 1.000 | CRS | ||
| 17 | 1.000 | 1.000 | 1.000 | 1.000 | CRS | ||
| 18 | 0.626 | 0.764 | 0.820 | * | 1.384 | DRS | |
| 19 | 0.739 | 0.900 | 0.821 | * | 0.422 | IRS | |
| 20 | 1.000 | 1.000 | 1.000 | 1.000 | CRS | ||
| 21 | 0.591 | 0.593 | 0.996 | * | 1.994 | DRS | |
| 22 | 1.000 | 1.000 | 1.000 | 1.000 | CRS |
Notes:
IRS: Increased returns to scale; DRS: Decreased returns to scale; CRS: Constant returns to scale; *cause of the inefficiency exists
If the cause of inefficiency is in the scale inefficiency (DMU 1, 2, 5, 9, 15 and 19), then it is possible to eliminate the inefficiency by adjusting the budget and the number of employees. If the cause of inefficiency is in the pure technology inefficiency (DMU 8, 10, 11, 18 and 21), then education and training for the professionals can improve the efficiency.
Variable returns to scale encompass three states to scale: constant returns to scale (CRS), increasing returns to scale (IRS) and decreasing returns to scale (DRS). The increasing returns to scale mean that 1 per cent increase in the size of the input factor will increase the output factor by more than 1 per cent. Decreasing returns to scale mean that 1 per cent increase of the input produces less than 1 per cent of output increase. Thus, if a DMU is in increasing returns to scale, then the proportion of output to the input can be improved by increasing the size of inputs. Conversely, if there is decreasing returns to scale, then the ratio of output to the input can be improved by reducing the input size.
In Table VII, it can be judged whether the profit of the scale is in the state of CRS, DRS or IRS according to the total Lambda value. If the total value of Lambda is less than 1, then there is increasing returns to scale. If it is higher than 1, then there is decreasing returns to scale. If it is 1, then the DMU is the constant returns to scale. In the case of DMU 2, it is necessary to reduce the size of inputs to improve the efficiency because it is in the state of decreasing returns to scale. In case of DMU 1, it is in the state of increasing returns to scale. Thus, it needs to expand their scale of inputs to improve the efficiency.
4.2 Fundraising efficiency
As a result of the correlation analysis, no significant correlation was found between the donation income and the fundraising expense and between donation income and management and fundraising labor costs. Table VIII presents the correlation matrix for all variables. This seems to be because of the insufficient number of samples. However, fundraising expense and fundraising labor costs are still valid input to analyze efficiency because DEA is an analytical method that does not make any parametric assumptions.
Correlation matrix for all variables
| Items | Fundraising expense | Management and fundraising labor cost | Donations |
|---|---|---|---|
| Fundraising expense | 1 | ||
| Management and fundraising labor cost | 1.876* | 1 | |
| Donations | 0.46 | 0.277 | 1 |
Note:
p > 0.01
There were 8 inefficient DMUs in the fundraising efficiency out of 15 DMUs as shown in Table IX. Taking the program efficiency analysis results together, only four DMUs (DMU 2, 4, 6 and 13) were identified as being efficient in both program efficiency and fundraising efficiency. Studying the characteristics of these four DMUs reveals that three of them were ranked top ten organizations in the donation amount given by individuals and international organizations. They have 38 years of operation on average, and their parent body organizations are international humanitarian assistance organizations. The DMU 13 which is 1 out of 4 DMUs scoring 100 per cent efficiency in both program and fundraising has a relatively short history of 18 years in operation and a small number of employees of 35. Inefficient DMUs with a short history and small numbers of employees can refer to DMU 13 to improve their inefficiency.
Fundraising efficiency score and reference set
| DMU | Efficiency | Reference set (reference weights) |
|---|---|---|
| 1 | 1.000 | |
| 2 | 1.000 | |
| 3 | 0.648 | DMU 1 (0.957), DMU 4 (0.043) |
| 4 | 1.000 | |
| 5 | 0.239 | DMU 1 (0.295), DMU 6 (0.022), DMU 10 (0.683) |
| 6 | 1.000 | |
| 7 | 0.361 | DMU 2 (0.486), DMU 13 (0.514) |
| 8 | 0.330 | DMU 1 (0.114), DMU 6 (0.079), DMU 10 (0.807) |
| 9 | 0.372 | DMU 2 (0.025), DMU 13 (0.975) |
| 10 | 1.000 | |
| 11 | 1.000 | |
| 12 | 0.052 | DMU 1 (0.130), DMU 6 (0.129), DMU 10 (0.741) |
| 13 | 1.000 | |
| 14 | 0.996 | DMU 10 (0.975), DMU 11 (0.025) |
| 15 | 0.144 | DMU 10 (0.105), DMU 11 (0.895) |
Table X presents the cause of inefficiency. Eight DMUs were identified as inefficient in pure technical efficiency. This proposes that these DMUs can improve the efficiency by providing quality of education and training to fundraising professionals, sharing the best practice of fundraising and changing the fundraising team structure. Of 15 DMUs, 10 are in the state of increasing returns to scale. This implies that DMUs with increasing returns to scale need to scale up the size of inputs and, thus, the number of fundraising professionals and the amount of fundraising budget to improve the fundraising efficiency.
Cause of inefficiency
| DMU | Technical efficiency | Pure technical efficiency | Scale efficiency | Cause of inefficiency in pure technical efficiency | Cause of inefficiency in scale efficiency | The total value of Lambda | Returns to scale |
|---|---|---|---|---|---|---|---|
| 1 | 1.000 | 1.000 | 1.000 | 1.000 | CRS | ||
| 2 | 1.000 | 1.000 | 1.000 | 1.000 | CRS | ||
| 3 | 0.606 | 0.648 | 0.936 | * | 1.098 | DRS | |
| 4 | 0.583 | 1.000 | 0.583 | * | 1.950 | DRS | |
| 5 | 0.235 | 0.239 | 0.984 | * | 0.382 | IRS | |
| 6 | 1.000 | 1.000 | 1.000 | 1.000 | CRS | ||
| 7 | 0.354 | 0.361 | 0.980 | * | 0.535 | IRS | |
| 8 | 0.319 | 0.330 | 0.967 | * | 0.268 | IRS | |
| 9 | 0.316 | 0.372 | 0.850 | * | 0.118 | IRS | |
| 10 | 0.871 | 1.000 | 0.871 | 0.091 | IRS | ||
| 11 | 0.207 | 1.000 | 0.207 | 0.014 | IRS | ||
| 12 | 0.050 | 0.052 | 0.974 | * | 0.328 | IRS | |
| 13 | 0.846 | 1.000 | 0.846 | 0.098 | IRS | ||
| 14 | 0.675 | 0.996 | 0.678 | * | 0.071 | IRS | |
| 15 | 0.023 | 0.144 | 0.159 | * | 0.012 | IRS |
Notes:
IRS: Increased returns to scale; DRS: Decreased returns to scale and CRS: Constant returns to scale; *cause of the inefficiency exists
5. Conclusion
Non-profit institutions work for public good and raise financial resources to achieve the goals. Efficiency in the program and fundraising activities should be obtained in the process of achieving the goals. In spite of its importance, there has been scant research in evaluating efficiencies in the nonprofit sector. In the study, the efficiency of the purposed program and the efficiency of fundraising activities were analyzed by applying DEA model. To pursue the validity of the analysis, the study focused on analyzing 22 non-profit institutions in Korea working in the field of humanitarian assistance. The data were based on the disclosed information in Korea Tax Bureau.
The contribution of this study is as follows. First, it presents non-profit efficiency evaluation models in terms of program efficiency and fundraising efficiency. It is important to measure not only the program efficiency but also the fundraising efficiency because NPOs fulfill their goals by providing service and goods to the needy and creating financial resources by raising gifts as well. Second, the study provides the inefficient DMUs with their reference set of efficient DMUs. By referring to the reference set of DMUs, inefficient DMUs can improve their inefficiency. Third, the study provides the cause of inefficiency; whether the inefficiency is because of the pure technical inefficiency or the scale inefficiency. Fourth, the study also indicates the state of variable returns to scale to propose the way of improving inefficiency by controlling the scale of inputs. The methods and the results of this study can serve as a model for researchers and practitioners to follow when evaluating efficiency in the non-profit sectors.
This study has limitations as follows. First, the DEA model was applied to the limited numbers of Korean NPOs in the field of humanitarian assistance and mostly raking at the top tier of fundraising amount. Second, the qualitative factors were not applied to the analysis. Third, the form and selection of the input and output variables were limited only in the available data of the government’s information disclosure system.
The further study in multiple stage organizational performance assessment using DEA would embrace the holistic efficiency measurement. Future studies may include suggesting improvement values in inputs and outputs, analyzing productivity changes by combining inputs and outputs over many years and using Tobit regression to find effective causes.
In spite of the limitations, the study has the value of performing the empirical studies of efficiency analysis of Korean NPOs and providing non-profits with the model of efficiency analysis in programs and fundraising activities and basis for establishing strategies to improve both efficiencies.
This paper forms part of a special section “Global entrepreneurship and social innovation in the fourth industrial revolution”, guest edited by Chang Won Lee.

