


University libraries function as complex learning environments where spatial configuration and environmental performance interact to shape the quality of interior study spaces. This study investigates the relationship between natural daylight availability and spatial visibility within the Main Library of the American University in Cairo. The research examines how climate-based daylight performance metrics relate to visibility-based spatial configuration measures, particularly within arid, high-illuminance environments. In doing so, it evaluates whether visually integrated areas of the spatial layout also correspond to favourable daylight conditions and visual comfort requirements within academic library interiors.
A mixed-methods analytical approach was adopted. Architectural drawings and digital models were first examined to establish the spatial structure of the library environment. Quantitative simulations were then conducted to evaluate daylight performance using climate-based metrics – spatial daylight autonomy (sDA), useful daylight illuminance (UDI) and annual sunlight exposure (ASE) – alongside dynamic visual comfort indicators, including daylight factor (DF) and daylight glare probability (DGP). These environmental metrics were analysed in relation to spatial configuration indicators derived from visibility graph analysis (VGA) within the space syntax framework, including visual integration, through-vision, visual control and isovist area. Statistical procedures, including ANOVA, correlation analysis and multiple regression modelling, were applied to examine the relationships between daylight performance and spatial configuration across the five levels of the library.
The results reveal a complex relationship between spatial visibility and daylight performance. Areas with high visual integration and centrality exhibited strong visibility indicators but generally lower daylight sufficiency, whereas perimeter zones near façade glazing achieved higher daylight autonomy while presenting a greater potential for glare and overexposure. Statistical analysis indicates contrasting associations between visibility-based spatial configuration measures and climate-based daylight metrics. These findings suggest a spatial–environmental trade-off between configurational centrality and daylight availability within the analysed library environment.
The study is limited by its focus on a single case study located in an arid climate, which may constrain the generalisability of the findings to other climatic contexts and building types. In addition, the visibility analysis was conducted using spatial models derived from architectural plans, which may not fully represent the dynamic conditions of occupied environments. Although the statistical relationships identified are robust, causal interpretation remains limited due to other environmental variables not examined in this study, including acoustic conditions, thermal comfort and artificial lighting use. Nevertheless, the findings provide analytical insights that may inform the integration of daylighting considerations within spatially central areas of libraries and comparable public buildings.
The findings provide design guidance for architects and planners developing libraries and deep-plan public buildings in arid climates. Visually central spatial cores, while important for spatial connectivity, may require targeted daylight interventions such as clerestories, skylights, light wells and high-reflectance interior finishes to improve daylight sufficiency. Perimeter zones, although well daylit, require appropriate shading strategies to control glare and excessive solar exposure. Integrating visibility analysis with climate-based daylight metrics during early design stages can support more balanced spatial and environmental design decisions.
By clarifying the relationship between spatial configuration and daylight availability, this study contributes to the design of more supportive learning environments within academic libraries. Aligning spatial visibility with adequate daylight conditions can improve visual comfort, spatial clarity and environmental quality in study spaces. In educational contexts – particularly in arid climates where daylight intensity is high – optimising daylight distribution while maintaining clear spatial organisation supports equitable access to comfortable and well-lit environments, reinforcing the role of libraries as inclusive and accessible places for study and academic engagement.
This research contributes an integrated analytical approach that combines climate-based daylight performance metrics with visibility-based spatial configuration analysis derived from space syntax. Unlike previous studies that examine daylighting or spatial configuration independently, the study demonstrates how visual centrality and daylight availability may diverge within deep-plan library environments. By linking environmental simulation with configurational analysis, the proposed framework provides a replicable method for evaluating the interaction between spatial structure and daylight performance in academic libraries and comparable public buildings.
1. Introduction
Libraries are recognised as complex learning environments where environmental quality and spatial configuration shape the spatial conditions under which study and learning activities occur. Grounded in environmental psychology (De Young, 1999; Ibrahim, 2021), this perspective explains how characteristics of the built environment – particularly spatial layout and daylight availability – contribute to the environmental qualities associated with comfort, orientation and cognitive support in learning settings.
Daylight is essential in learning environments, improving visual comfort, reducing reliance on artificial lighting and supporting occupants' well-being when appropriately controlled (Boyce, 2014; Weissman, 2023). However, it may also generate glare and thermal stress if poorly managed, particularly in arid, high-illuminance climates. Contemporary standards address this balance by replacing static daylight metrics with climate-based measures such as spatial daylight autonomy (sDA) and annual sunlight exposure (ASE) for performance assessment (IES LM-83-12, 2012), complemented by illuminance and glare control criteria (EN 12464-1, 2021). In parallel, spatial theories have emphasised the importance of environments that balance “prospect” (outlook) and “refuge” (enclosure) and the role of visibility and spatial configuration in shaping environmental conditions within buildings – principles long established in space syntax theory (Hillier and Hanson, 1984; Turner, 2004; Van Nes And Yamu, 2021) and supported by meta-analyses of environmental preference (Dosen and Ostwald, 2016).
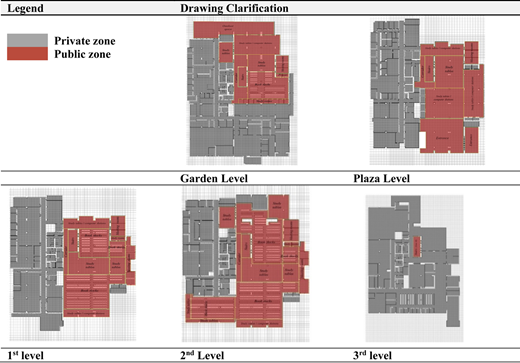
The American University in Cairo (AUC) Library is a five-story building with distinct functions across its floors, including open reading areas, study rooms, collaborative spaces, and stacks. Its northeast orientation, glazed façade and atrium provide indirect daylight and garden views, while perforated screens on the southeast and southwest offer shading and acoustic buffering. Internal partitions and furniture create varied spaces that balance openness and enclosure.
Existing studies of library environments have typically addressed daylight optimisation through energy and visual performance metrics or examined user perception separately. Few studies integrate climate-based daylight modelling with visibility and spatial configurational analysis within a unified analytical framework. This study contributes to the literature by proposing an integrated approach that links environmental daylight performance metrics with spatial visibility analysis to support a more comprehensive evaluation of learning environments. While previous research has linked spatial configuration and daylight conditions to occupancy patterns and environmental preference, the present study does not measure behavioural outcomes directly. Instead, it investigates environmental–spatial correlations that may inform future user-centred validation studies.
2. Literature review
Prior research on libraries has often focused on optimising daylighting systems and building forms. Studies have simulated prismatic light guides for improved daylight penetration at the Beirut Arab University Library (Omar et al., 2018) and used RELUX to link daylight factor (DF) to visual comfort at Ahmadu Bello University (Buhari and Alibaba, 2019), where the results show a positive influence of DF on comfort. Others have analysed user perception of daylight via surveys (Badeche and Benkhalifa, 2022) and machine learning algorithms to optimise early-stage library design in a cold region of China (Zhou et al., 2022). Research has also compared shading devices, finding venetian blinds effective for glare reduction (Dabaj et al., 2022) and tested dynamic electrochromic “heliotropic” shading systems for conservation and comfort (Weissman, 2023). Optimisation studies have identified effective shading configurations for glare control in a university library in Shanghai (Wen et al., 2023), evaluated transparent structures in two university libraries in Warsaw (Voronkova and Podlasek, 2024), and balanced atrium daylight with energy use using parametric simulation across 36 university libraries in China (Bai et al., 2024).
Recent multi-objective optimisation studies for library atria balance daylight, thermal performance and energy efficiency (Gao et al., 2025), with machine learning techniques applied to enhance simulation efficiency when optimising energy consumption, thermal comfort and daylighting performance (Xu et al., 2025). A recent study by Cui and Ahn (2025) improved essential lighting factors in library reading environments to enhance illumination and visual comfort while reducing energy usage. Studies on spatial configuration in libraries have used space syntax analysis to examine academic library plans through visual integration (VI), connectivity and isovist area (IA) (Both et al., 2013). Other research has combined space syntax with additional methods to compare library layouts and identify user spatial preferences (Aydoğan and Şalgamcioğlu, 2019).
Research in daylighting has evolved from static metrics to climate-based annual performance modelling. Reinhart and Walkenhorst (2001) validated dynamic simulation techniques for predicting indoor illuminance. Reinhart et al. (2006) called for metrics that capture temporal variability in daylight availability, enhancing traditional methods. Andersen et al. (2012) and Mardaljevic et al. (2012) introduced frameworks like useful daylight illuminance (UDI) that link daylight to visual and non-visual light effects. These concepts were formalised in the IES LM-83–12 standard, which defined metrics such as sDA and ASE for evaluating daylighting performance and solar overexposure in buildings.
Research indicates a strong connection between sustainable daylighting and building performance, as well as occupant behaviour. Heschong et al. (2002) found that increased classroom daylight correlates with improved student performance, while Yun et al. (2012) observed that adaptive responses to daylight notably affect lighting energy use in open-plan offices. Konis (2013) emphasised the importance of balancing daylight provision and visual comfort due to occupant use of shading devices, which can hinder effective daylight transmission. Furthermore, Konis et al. (2016) and Tian et al. (2018) illustrated how simulation-based optimisation frameworks assist architects in assessing building forms and other parameters to enhance passive daylighting and energy efficiency.
Alrubaih et al. (2013) discuss key parameters in daylighting design, including DF and glare control, emphasising the need for integrating artificial lighting for energy efficiency and comfort. Ochoa et al. (2012) point out the importance of lighting simulation tools in evaluating daylight performance, highlighting the role of accurate modelling inputs. Additionally, Dubois and Blomsterberg (2011) demonstrate that daylight-responsive lighting strategies can significantly lower electrical lighting needs in office buildings, reinforcing the importance of daylight integration in energy-efficient design.
Recent studies highlight the importance of simulation-driven optimisation for daylight performance in educational settings. Atthaillah et al. (2024a) introduce a climate-based predictive model that relates global horizontal radiation to UDI, simplifying daylight design in tropical classrooms. Vaisi et al. (2024) utilise simulation-based metrics to inform window sizing and positioning, enhancing visual comfort and facilitating sustainable school design. Atthaillah et al. (2024b) find that asymmetrical bilateral openings with optimal window-to-wall ratios and shading depths significantly improve daylight performance and glare management. Additionally, Deng et al. (2022) pinpoint window proportions, glazing transmittance and room height as crucial factors for effective daylight distribution in library reading areas.
Khelil and Khelil (2025) study daylighting in classrooms through simulation and parametric methods, showcasing how performance metrics like illuminance, glare and daylight distribution can improve visual comfort and guide design enhancements in educational environments. Yang (2017) examines natural lighting in university library reading spaces from an energy-efficiency perspective, identifying design shortcomings and proposing strategies such as optimised window design, internal layout adjustments and shading systems to improve daylight performance and reduce energy consumption.
Space syntax has been integrated with Appleton's prospect-refuge theory to examine how configuration and user goals affect seat selection in a 3D virtual environment (Keszei et al., 2019) and to evaluate the role of semi-open spaces in fostering sociability in public libraries (Askarizad and Safari, 2020). However, such studies typically focus on single sites and have either prioritised daylighting for efficiency and comfort or documented user perceptions in isolation. Research in space syntax demonstrates a strong relationship between visibility structure and occupancy patterns at the building level (Hillier and Penn, 1991; Turner, 2004). However, such studies rarely integrate climate-based daylight analysis with visibility and configurational methods to explain reader behaviour and seating preferences. Furthermore, its application to seating selection – where prospect-refuge, view quality and glare management intersect – remains limited. Figure 1 provides further details on recent studies.
 The table is divided into two main sections: Previous works on daylight in libraries and Previous works on spatial configuration in libraries. The first section lists studies from 2019 to 2025, focusing on various daylighting variables such as Annual/Climate-Based Daylight Metrics, Glare indices, Daylight quantity/Illuminance Level, and Daylight Factor. These studies also focus on the effect of daylighting on energy saving, visual comfort, human perception, and material transparency. The second section lists studies from 2013 to 2020, focusing on space syntax involving visibility, visual integration, connectivity, spatial preference, and 3D virtual environment. The table aims to identify research gaps, aims, and objectives in recent publications.
Literature review summary. Source(s): By authors
The table is divided into two main sections: Previous works on daylight in libraries and Previous works on spatial configuration in libraries. The first section lists studies from 2019 to 2025, focusing on various daylighting variables such as Annual/Climate-Based Daylight Metrics, Glare indices, Daylight quantity/Illuminance Level, and Daylight Factor. These studies also focus on the effect of daylighting on energy saving, visual comfort, human perception, and material transparency. The second section lists studies from 2013 to 2020, focusing on space syntax involving visibility, visual integration, connectivity, spatial preference, and 3D virtual environment. The table aims to identify research gaps, aims, and objectives in recent publications.Literature review summary. Source(s): By authors
Through the relevant literature, key research questions emerged that require further investigation, including:
To what extent does spatial arrangement influence users' visibility within the library?
To what extent do the library floors receive sufficient natural lighting according to relevant metrics?
How does daylight sufficiency correlate with patterns of spatial visibility in library reading rooms located in arid climates?
To what extent do visibility-based syntactic measures (e.g. visual integration, isovist area, visual control) explain or predict variations in daylighting performance metrics?
To address these questions, the present study employs an integrated methodology, synthesising quantitative visibility analysis from space syntax theory with a dual-faceted assessment of daylighting. The spatial configuration is analysed using visibility graph analysis (VGA) to objectively measure VI, control and openness – key factors influencing occupancy and wayfinding. This visibility data is then correlated with a comprehensive suite of daylight metrics, encompassing both climate-based annual sufficiency measures (e.g. sDA, UDI) and dynamic glare assessment (daylight glare probability, DGP). This combined analytical framework allows the research to move beyond singular performance goals, examining instead the complex interplay between perennial daylight availability, instantaneous visual comfort and the inherent visibility structure of the library space.
This integrated methodology aims to analyse environmental–spatial relationships and explore their potential implications for seating distribution within the reading halls. The focus is on arid, high-illuminance contexts, where overexposure risk amplifies spatial compromise. This aim is addressed through the following specific objectives:
To determine daylight sufficiency across library floors using relevant metrics.
To correlate daylight sufficiency with spatial visibility in arid-climate reading halls.
To predict visibility-based measures (e.g. VI, IA, visual control – VC) using daylight performance metrics.
To analyse the spatial implications of differential visibility within the reading environment as a basis for future user-centred investigations.
Ultimately, this research seeks to inform design strategies that enhance comfort, support productivity and promote sustainable practices in academic library design.
3. Theoretical framework
3.1 Theories of human–environmental interaction
The theory of prospect-refuge explains preferences for spatial arrangements and vistas that satisfy the need to see without being seen, a condition linked to survival (Appleton, 1975, p. 73). In library design, it highlights how spatial configuration can enhance user comfort and performance by balancing open awareness (prospect) with semi-enclosed privacy and security (refuge). The theory aligns with arousal theory, where moderate novelty enriches spatial experience, but excessive uncertainty can provoke anxiety (Berlyne, 1951). Its architectural application has been extended to include elements such as mystery, complexity, enticement and illumination (Hildebrand, 1991, 1999). These spatial-cognitive attributes, which influence environmental selection, are also connected to Kaplan and Kaplan's (1989) attention restoration theory, which links settings offering discovery and learning potential to enhanced safety and living circumstances (Appleton, 1975; Stamps, 2010).
In libraries, daylighting fundamentally mediates these conditions. Bright reading rooms with large glazed openings enhance visibility and openness, encouraging the use of high-visibility spaces. Refuge, conversely, is established not by darkness but by shaded, semi-enclosed spaces suited for focused reading. Research on environmental preferences confirms that strategies optimising daylight access and spatial filtering enhance users' feelings of safety and comfort, prolonging occupancy in study environments (Dosen and Ostwald, 2013a, b; Lee et al., 2022). This alignment demonstrates that prospect-refuge principles significantly influence perceptually driven daylighting design, thereby improving library functionality and user well-being.
Space syntax theory focuses on the geometrical and configurational logic of space, which shapes patterns of accessibility, visibility and ultimately behaviour (Hillier, 1996; Hillier and Penn, 1991). This logic underpins observable patterns of space use and social interaction (Hillier and Hanson, 1984; Peponis, 1985; Hillier, 1996; Kupritz, 2003). A visually integrated space, being highly accessible, can function as a vantage point offering prospect and control (Behbahani et al., 2014; Mumcu et al., 2010; Dawes and Ostwald, 2014). Seat selection results from either prior experience or a deliberate choice upon entering a space (Stone, 2022), whether conscious or unconscious (Kahneman, 2011). Familiarity with the environment significantly influences this choice (Keskin, 2019), as human response to the physical setting is strongly shaped by prior experience (Boyce, 2014). For instance, regular users may choose seats based on habit, while newcomers rely on external factors like lighting and noise. Arrival time and seat availability are also critical, as are individual differences in arousal, motivation and expectation (Boyce, 2014). Collectively, these factors shape individual seat preference behaviours.
In this study, these theoretical perspectives are used as interpretive frameworks for analysing spatial–environmental metrics rather than as direct measures of psychological states. Prospect–refuge theory provides a conceptual basis for understanding how spatial configurations may relate to perceived conditions such as privacy, openness or social interaction. In parallel, space syntax analysis is employed to quantify spatial relationships and visibility patterns within the built environment. While previous research has suggested that configurational analysis can be linked to psychological interpretations of space (Montello, 2007), the present study does not directly integrate prospect–refuge theory with space syntax methods. Instead, these perspectives are discussed as complementary conceptual references that may inform future investigations into the relationship between spatial configuration and environmental perception. Together, they support the interpretation of spatial metrics examined in this study.
Spatial orientation itself depends on how individuals interpret dynamic visual information while moving through an environment (Cuttle, 2008). This process involves multiple sensory inputs – including visual, auditory and tactile perception, but vision remains the dominant channel (Keskin, 2019). As the primary stimulus for vision, daylight plays an important role in supporting spatial orientation. Variations in daylight intensity and direction help define spatial hierarchy and contribute to a sense of place (Keskin, 2019), which may influence how users perceive and navigate architectural environments (Boyce, 2014; Dubois et al., 2009). These relationships are therefore considered in the interpretation of the daylighting performance metrics examined in this study.
3.2 Key determinants of user comfort in library environments
3.2.1 Visibility graph analysis (VGA)
VGA explains spatial perceptions such as mobility, navigation and space occupation. It quantifies a building's configuration in terms of accessibility (permeability) and visual connectivity (VC). While the permeability graph considers knee-level obstacles such as furniture, a visibility graph is conducted at eye level (Turner et al., 2001; Al-Sayed et al., 2014). The raster-based VGA method calculates an isovist from each grid cell's centroid and maps its topological visual relationships with all other cells, revealing how connected each point is within the spatial system and indicating overall navigability (van Nes and Yamu, 2021).
Visual Integration (VI)
VI refers to the degree to which a point is visually connected to all others in the spatial system (Turner et al., 2001; Al-Sayed et al., 2014). High VI points are typically hubs of movement and activity, while low VI zones are more secluded and often associated with refuge-oriented behaviour. This pattern, however, may vary among library users depending on daylight conditions and personal preferences.
Through Vision
Through-vision (TV) quantifies the longest continuous view of spaces, measuring visibility over long distances to explain behaviour, orientation and wayfinding (van Nes and Yamu, 2021). Higher values typically attract stationary activities of people (Yamu et al., 2021) and indicate locations that are frequently traversed, determined by the density of visibility lines passing through each area. This metric identifies places that are “in the way” of movement when traveling from one point to another, especially in spaces with long, straight walkable paths and can therefore predict pedestrian movement (Koutsolampros et al., 2019). The highest values of through vision correspond to locations offering the broadest overview and surveillance, while low values indicate isolated spots suited to focused activity.
Visual Control
VC identifies visually dominant areas. A controlling location must see many spaces, while these spaces should see relatively few (Turner, 2004). It measures how a space controls access to its immediate neighbours, factoring in the number of connections each neighbour has (Al-Sayed et al., 2014). These metrics highlight positions that offer expansive prospect views, where adjacent areas conversely have low visibility.
Isovist area
An isovist is the set of all points visible from a given vantage point, accounting for physical obstructions like walls and indicates how people perceive and move through space (Turner et al., 2001). Small IAs are linked to perceptions of enclosure and safety (refuge), while large IAs are associated with openness and surveillance potential (prospect) (Wiener and Franz, 2005; Dawes and Ostwald, 2021). Consequently, seat choice aligns with activity: larger IAs are preferred for socialising, while smaller ones are chosen for focused work.
3.2.2 Daylighting metrics
Daylighting performance is assessed using two complementary categories of metrics, distinguished by their temporal scope and analytical intent. The first comprises climate-based daylight metrics (CBDMs), such as sDA, UDI and ASE. These utilise annual, location-specific weather data to evaluate long-term daylight sufficiency and availability, expressed as the percentage of hours or floor area meeting an illuminance target. The second category encompasses dynamic daylight metrics, which provide time-varying, hour-by-hour evaluations of daylight quality. They are calculated under fixed sky conditions and do not account for real climatic variation. These metrics assess not only sufficiency but also temporal fluctuations in direct sunlight and visual discomfort. Key examples include DF and DGP (Wienold and Christoffersen, 2006; Wienold et al., 2019). While DGP is not a climate-based sufficiency measure, its inclusion is critical for this study, as it captures the instantaneous perceptual quality of light – a decisive factor for user comfort and seat preference in the high-illuminance context of an arid climate.
Employing both CBDMs and dynamic metrics ensures the analysis spans the full spectrum from annual adequacy to real-time visual comfort. Daylighting refers to the strategic design of windows, skylights, openings and reflective surfaces to utilise natural light, whether direct or indirect, for illuminating interior spaces. In building design, it is prioritised to enhance visual comfort and reduce energy consumption. Optimising illumination levels supports psychological ease, as both inadequate and excessive light can negatively influence perception. Although the human eye adapts to changing light, significant variations or high contrast can induce visual stress and fatigue. This is critically important, as approximately one-third of the brain's cortical neurons are dedicated to processing visual information – more than for all other senses combined. Consequently, varying lighting conditions are known to influence occupants' psychological and neurophysiological states (Dean, 2005). The current research focuses on the most pertinent daylighting variables that relate directly to spatial visibility, as detailed in the following sections.
Illuminance Level (ILL)
Daylight illuminance refers to the quantity of light incident on a surface, measured as luminous flux per unit area (Majeed et al., 2019). For library design, the Illuminating Engineering Society (IES) and the European standard EN 12464–1 provide recommended illuminance ranges tailored to specific tasks. The most notable library area is the general reading areas, which require 300–500 lux, and EN 12464–1 recommends 500 lux.
Daylight Factor (DF)
DF – a key dynamic daylight metric – is a percentage-based metric describing the ratio of internal illuminance to external illuminance under an overcast sky, excluding direct sunlight (CIBSE, UK). Its range in relation to human perception. Accordingly, three ranges were proposed: low daylight (less than 2%), moderate daylight (ranging from 2 to 5%) and high daylight (above 5%) (CIBSE, UK). Moreover, the DF values for libraries are derived from standards and best practices as primarily recommended by CIBSE (UK) and EN standards, where a 2–5% range ensures comfortable reading without excessive contrast.
Daylight Glare Probability (DGP)
DGP – a key dynamic daylight metric – is calculated under fixed sky conditions and does not account for real climatic variation. It estimates the percentage of occupants likely to experience glare-related visual discomfort (Wienold and Christoffersen, 2006; Wienold et al., 2019). The value, derived from a hemispherical fisheye image based on defined eye positions, is categorised into four perception groups: less than 0.35 is imperceptible glare, 0.35–0.40 is recorded as perceptible glare, 0.40–0.45 records the disturbing glare, and more than 0.45 represents intolerable glare. While DGP is fundamentally a dynamic metric for assessing instantaneous glare, its summation over annual occupied hours using climate data effectively transforms it into a climate-based measure of long-term visual comfort.
Useful Daylight Illuminance (UDI)
UDI is a CBDM that assesses performance by measuring the percentage of time a point receives illuminance levels deemed “useful” for occupants (Nabil and Mardaljevic, 2005, 2006). The standard UDI range (100–2000 lux) indicates the annual proportion of occupied hours within this optimal band, categorised as <100 lux (insufficient), 100–2000 lux (useful) and >2000 lux (excessive).
Spatial Daylight Autonomy (sDA)
sDA is a core CBDM. It measures the percentage of floor area that achieves a minimum illuminance of 300 lx for at least 50% of annual occupied hours, evaluating a space's reliance on natural light (Reinhart et al., 2014; IES LM-83-12, 2012). Proposed performance thresholds are >55% for acceptability and >75% for preference.
Annual Daylight Exposure (ADE)
ASE is a CBDM that quantifies glare and overheating risk. It is used in building design to quantify excessive direct sunlight (glare potential) by analysing hourly weather data over a year, offering a dynamic, location-specific view beyond older static methods such as DF. It calculates the proportion of frequently occupied floor space more than 1,000 lux of direct sunlight for over 250 occupied hours annually, expressed as ASE1000,250 (IES LM-83–12, 2012). Proposed thresholds are <10% for acceptance, <7% for neutrality and <3% for preference.
Quality Views (QV)
The LEED v4 Quality Views credit assesses whether frequently occupied areas provide access to a defined “Quality View” across four categories. To achieve the credit, ≥75% of regularly occupied floor space must meet the criteria; multiple lines of sight, views of movement, views of nature and views through glazing with a view factor, according to the US Green Building Council's (USGBC) assessment system. Therefore, effective library daylight design requires a balance between illuminance sufficiency and glare control to support energy efficiency and visual comfort. This necessitates the integration of complementary metrics. The DF provides a static, scene-based assessment, while CBDMs like daylight autonomy (DA) and UDI are vital for determining if spaces consistently meet recommended illuminance levels (300–500 lx) year-round (Li et al., 2023; Muñoz-Viveros et al., 2024). Concurrently, the dynamic daylight metric DGP evaluates the real-time risk of visual discomfort from excessive luminance (Wienold and Christoffersen, 2006; Brzezicki, 2021). Using these metrics together enables the optimisation of fenestration, shading and seating layout to enhance comfort and reduce artificial lighting dependency (Kaymaz and Manav, 2025).
4. Materials and methods
4.1 Case study selection strategy
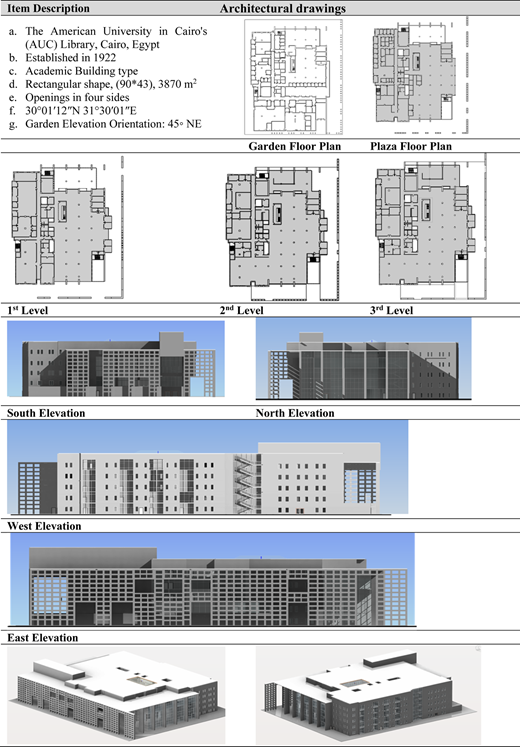
The case study is the American University in Cairo (AUC) Library, a five-story building with varied functions across its garden floor, plaza level and three upper stories. Its large, glazed façade and atrium admit daylight and views, while internal partitions and furniture create a mix of open and enclosed spaces. The site was selected for three reasons: (1) its primary role as a student learning centre; (2) its diverse spatial and daylight conditions, enabling comparison between prospect-oriented and refuge-oriented zones and (3) its location in an arid, high-solar climate, where daylight offers significant benefits (visual comfort, energy savings) but also pronounced risks (glare, overheating). Pictures are included in Figure 2.
 The image contains one satellite imagery and four photos. The satellite imagery shows an aerial view of a campus with various buildings and pathways. The four photos display different views of a building's interiors and exteriors. The first set of photos shows interior views with shading devices and transitional zones. The second set of photos shows exterior views with perforated screens and vertical louvers. The third set of photos shows the site descending with stairs in the shaded transitional zone. The fourth set of photos shows interior views of the five floors with daylighting performance and illumination gradients across zones.
The American University in Cairo's (AUC) Main Library: (a–d) Photographs by the authors; (d) satellite imagery courtesy of Google Earth Pro
The image contains one satellite imagery and four photos. The satellite imagery shows an aerial view of a campus with various buildings and pathways. The four photos display different views of a building's interiors and exteriors. The first set of photos shows interior views with shading devices and transitional zones. The second set of photos shows exterior views with perforated screens and vertical louvers. The third set of photos shows the site descending with stairs in the shaded transitional zone. The fourth set of photos shows interior views of the five floors with daylighting performance and illumination gradients across zones.The American University in Cairo's (AUC) Main Library: (a–d) Photographs by the authors; (d) satellite imagery courtesy of Google Earth Pro
4.2 Method
The research employs a mixed-method approach grounded in a theoretical framework and executed in three sequential steps (Figure 3). This strategy integrates diverse techniques, including diagrams, tables, illustrations and images, to achieve the study's objectives.
 The flowchart begins with the study of scientific background, including scientific background, literature review, theoretical background, and identification of the most effective variables. It then moves to research methodology, divided into qualitative and quantitative approaches. The qualitative approach involves descriptive analysis using Revit 2025 for illustrating case study architecture drawings. The quantitative approach includes spatial configuration variables such as visual integration and through vision, and daylight variables like illuminance level and daylight factor. The data from these variables are imported into DepthMapX and Rhino 8 using specific plugins. The final step involves statistical analysis, including one-way ANOVA, correlation analysis, and linear regression to answer specific research questions. The findings and conclusions section summarizes the findings, conclusions, contributions, and recommendations.
Research design flowchart incorporating a research methods framework integrating daylighting and space syntax analyses. Source(s): By authors
The flowchart begins with the study of scientific background, including scientific background, literature review, theoretical background, and identification of the most effective variables. It then moves to research methodology, divided into qualitative and quantitative approaches. The qualitative approach involves descriptive analysis using Revit 2025 for illustrating case study architecture drawings. The quantitative approach includes spatial configuration variables such as visual integration and through vision, and daylight variables like illuminance level and daylight factor. The data from these variables are imported into DepthMapX and Rhino 8 using specific plugins. The final step involves statistical analysis, including one-way ANOVA, correlation analysis, and linear regression to answer specific research questions. The findings and conclusions section summarizes the findings, conclusions, contributions, and recommendations.Research design flowchart incorporating a research methods framework integrating daylighting and space syntax analyses. Source(s): By authors
4.2.1 Qualitative approach
The first step entails a qualitative case study description using architectural drawings developed in Revit (2025), detailing five-level plans, elevations and the geometrical model (Table 6). The case study is summarised by its (1) name and location, (2) established year, (3) function type, (4) geometry and area, (5) natural light sources, (6) latitude/longitude and (7) orientation.
4.2.2 Geometric interoperability and model validation workflow
To ensure geometric accuracy for daylight simulation, a controlled interoperability workflow was implemented between Revit 2025 and Rhinoceros 8 (Climate Studio). The AUC Library was modelled parametrically in Revit, and the export was performed from a dedicated 3D view using File → Export → CAD Formats → DWG, with solids explicitly set to ACIS solids. This setting preserves volumetric integrity and prevents mesh fragmentation during transfer.
The 3D model was exported via Revit to Rhino icon inside the Revit 2025 programme, where the geometry was systematically validated. The following workflow diagram was used to illustrate the interoperability process between different digital analysis media:
This workflow follows established interoperability principles for preserving design integrity across digital platforms (El-Khouly and Abdelhalim, 2024). By controlling export settings, validating geometry and simplifying only non-essential elements, the process minimised data loss and ensured that simulation outputs reflect environmental performance rather than artefacts of model translation. The interoperability workflow integrates several specialised digital platforms to support modelling, environmental simulation and spatial analysis, reflecting the growing role of computational toolchains in architectural research and design workflows (El-Khouly et al., 2021).
4.2.3 Quantitative approach
The third step employs quantitative simulation. (a) Spatial configuration was assessed using DepthMapX-10, applying VGA to discretised floor plans to evaluate visual relationships. (b) Daylight analysis was conducted in Climate Studio (Rhino 8) using a 3D model under Cairo's climate.
The process involved Several steps as follows:
Setting location and orientation
Material reassignment: The model was imported into Climate Studio program with the reflectance of each wall, Ceiling, Floors, glass transmittance with values (0.5, 0.7, 0.2 and 0.8)
Validation of correct opening size and glazing type with accurate façade thickness and shading devices.
Importing grid resolution with space 0.5 m, sensor height 0.75 and the distance from the walls is 0.5.
The model geometry is checked to confirm no missing surfaces, no flipped normals, no duplicated objects, as well as the correct scale of the building model.
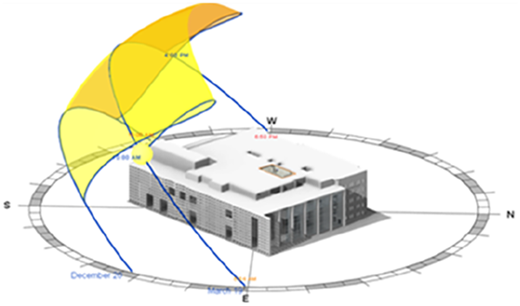
Simulating annual metrics. This analysis incorporated both climate-based metrics (e.g. sDA, UDI, ASE) and dynamic metrics (e.g. DGP, DF) to evaluate long-term sufficiency and real-time visual comfort. The solar analysis parameters are summarised in Table 1.
Climate conditions and solar analysis of the AUC Library
| Solar analysis of AUC library | |
|---|---|
|  |
4.2.4 Statistical analysis
The third step comprised statistical analysis to examine relationships between the datasets. The SPSS version 27 statistical software was used to achieve the aim and objectives of the study. A one-way analysis of variance (ANOVA) compared visibility (VGA) and daylight metrics across building floors. Correlation analysis identified independent variance in visibility beyond that explained by DFs. Finally, linear regression modelled the predictive relationship between daylight performance metrics – including both climate-based (e.g. sDA, UDI, ASE) and dynamic measures (e.g. DGP, DF) – and spatial configuration.
5. Results and discussion
5.1 Qualitative analysis
5.2 Quantitative analysis
5.2.1 Spatial configuration
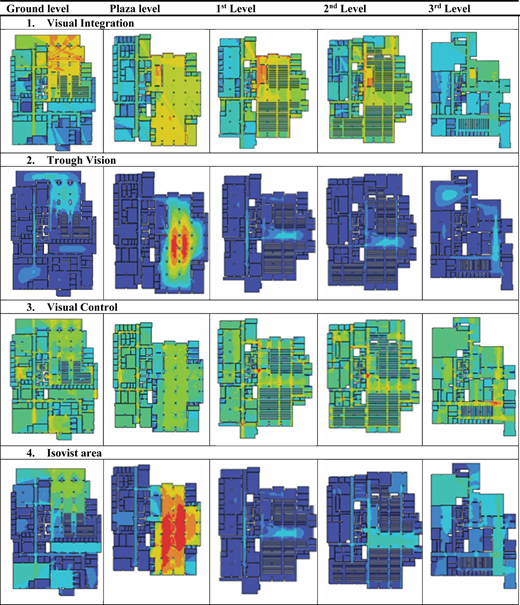
The spatial configuration was analysed using DepthMapX-10, evaluating VI through vision, VC and IA. Results are detailed in Table 4.
5.2.2 Daylight performance
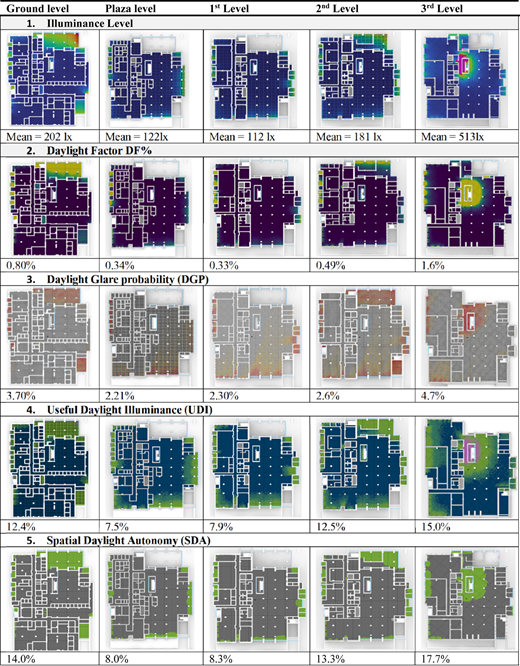
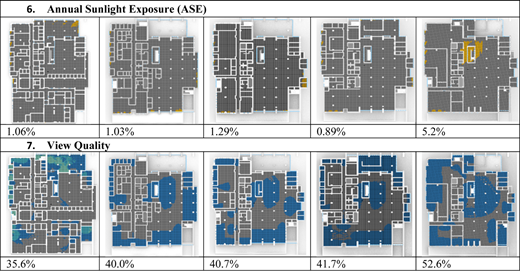
Daylight performance was assessed via simulation, analysing both climate-based metrics (Illuminance, DF, UDI, sDA, ASE) and dynamic metrics (DGP, DF), alongside view quality (QV). Full results are presented in “To what extent does spatial arrangement influence?” (Table 5).
5.3 Statistical analysis of spatial configuration and daylight performance
5.3.1 Spatial configuration and visibility patterns (VGA)
The analysis indicates that the Plaza Level functions as a primary spatial hub exhibiting the highest VI and TV values. While VI and control remained consistent across floors, openness and long-distance visibility varied significantly. The Plaza Level offered the broadest perspectives, whereas the upper floors were more visually confined. To address RQ1 (To what extent does spatial arrangement influence user visibility?), a one-way ANOVA compared VGA metrics across the five levels (Table 6). VI and control showed no significant variation (F = 1.952, p = 0.114) and (F = 0.737, p = 0.571). This suggests that VI and VC remain relatively consistent across the different levels of the building, which indicates stable spatial permeability. In contrast, the TV and IA differed significantly. The Plaza Level exhibited the greatest visibility depth and largest IA (mean = 31,306.41; 659.87 m2), functioning as an open spatial centre, while upper floors were more visually restricted.
Metric values for spatial configuration indicators derived from visibility graph analysis (VGA)
| Building levels | Visual integration | Through vision | Visual control | Isovist area | Sample size | ||||
|---|---|---|---|---|---|---|---|---|---|
| Mean | SD | Mean | SD | Mean | SD | Mean | SD | ||
| Garden level | 3.99 | 0.65 | 10382.78 | 10534.63 | 0.93 | 0.21 | 280.86 | 230.76 | n = 10 |
| Plaza Level | 4.27 | 0.31 | 31306.41 | 32075.99 | 0.94 | 0.26 | 659.87 | 421.89 | n = 9 |
| 1st level | 4.01 | 0.54 | 5401.35 | 5451.58 | 1.01 | 0.21 | 179.25 | 131.91 | n = 13 |
| 2nd level | 3.79 | 0.43 | 4903.88 | 5680.51 | 1.04 | 0.20 | 152.25 | 122.09 | n = 16 |
| 3rd level | 3.23 | 0.39 | 4503.68 | 5380.52 | 1.02 | 0.21 | 148.21 | 121.11 | n = 16 |
| F-value | 1.952 | 7.241 | 0.737 | 10.906 | |||||
| η2 | 0.117 | 0.329 | 0.048 | 0.425 | |||||
| p-Value | 0.114 | 0.000** | 0.571 | 0.000** | |||||
Note(s): M = Mean, SD = Standard deviation, η2 = Effect size
5.3.2 Daylighting performance across library floors
To address RQ2 (To what extent do floors receive sufficient daylight?), a one-way ANOVA compared daylight metrics across levels (Table 7). This analysis integrated both climate-based (e.g. Ill, DF, UDI, sDA, ASE) and dynamic measures (DGP, DF), alongside QV, to evaluate annual sufficiency and time-specific visual comfort.
Metric values for daylight performance indicators used in the analysis
| Levels | Ill | DF | DGP | UDI | sDA | ASE | QV | Sample size | |||||||
|---|---|---|---|---|---|---|---|---|---|---|---|---|---|---|---|
| M | SD | M | SD | M | SD | M | SD | M | SD | M | SD | M | SD | ||
| Gr | 202.0 | 11.7 | 0.8 | 0.04 | 3.7 | 0.22 | 12.4 | 0.72 | 14.0 | 0.81 | 1.0 | 0.06 | 35.6 | 2.05 | n = 10 |
| Plaza | 121.6 | 6.4 | 0.3 | 0.02 | 2.2 | 0.11 | 7.5 | 0.39 | 8.0 | 0.42 | 1.0 | 0.05 | 40.0 | 2.06 | n = 9 |
| 1st | 112.3 | 8.5 | 0.3 | 0.03 | 2.3 | 0.18 | 7.9 | 0.59 | 8.3 | 0.62 | 1.3 | 0.10 | 40.7 | 3.13 | n = 13 |
| 2nd | 181.0 | 16.7 | 0.5 | 0.05 | 2.6 | 2.09 | 12.5 | 1.15 | 13.3 | 1.22 | 0.9 | 0.08 | 41.7 | 4.05 | n = 16 |
| 3rd | 512.7 | 46.2 | 1.6 | 0.14 | 4.7 | 0.42 | 15.0 | 1.35 | 17.7 | 1.60 | 5.2 | 0.46 | 52.6 | 4.98 | n = 16 |
| F-Value | 609.6 | 629.1 | 964.39 | 137.8 | 178.5 | 860.8 | 56.2 | ||||||||
| η2 | 0.976 | 0.977 | 0.985 | 0.903 | 0924 | 0.983 | 0.79 | ||||||||
| P-Value | 0.000** | 0.000** | 0.000** | 0.000** | 0.000** | 0.000** | 0.000** | ||||||||
Note(s): The results show significant variation in daylight performance across levels
Average illuminance (Ill) The Illuminance level marked differences across levels (F = 609.66, p = 0.000) with the large effect size (η2 = 0.976). The 3rd level achieved the highest value (M = 512.7 lux, SD = 46.2) – exceeding the standard reading range of 300–500 lux. It demonstrates more than twice that of the Garden level (M = 201.96), which represents moderate illuminance. In contrast, the Plaza and 1st levels were insufficiently lit (121.6 and 112.3 lux, respectively). In contrast, the 2nd level remained suboptimal (181 lux).
The DF also shows significant variation across floors (F = 629.15, p = 001; η2 = 0.977). The DF was highest on the 3rd level (mean = 1.6), compared to the Plaza and 1st levels (0.3 each), indicating greater daylight availability on upper floors. The Garden floor's DF (0.8) was moderate but, like all levels, remained below the recommended sufficiency range (2–5%)
The dynamic metric DGP assesses time-specific visual discomfort – rather than a climate-based factor. Significant differences in glare probability were found across floors (F = 964.40, p = 001; η2 = 0.985). Values in this study ranged from 2.2 to 4.7, despite differences between levels in DGP, the low glare values were marked overall, which shows the minimal impact on visual comfort, suggesting the environments are generally visually appealing.
The climate-based metrics, UDI and sDA also vary significantly across floors (F = 137.88, p = 0.001; η2 = 0.903) and sDA follows a similar pattern (F = 178.54, p = 0.001; η2 = 0.924). In addition, they both peaked on the 3rd level (15.0 and 17.7%), indicating relatively better conditions. Lower floors (Plaza and 1st levels) performed poorly (≈7–8%), confirming a greater reliance on artificial lighting. All levels fell below best-practice thresholds (e.g. ≥55% sDA for LEED credits).
The ASE vary significantly across floors (F = 860.8, p = 0.001; η2 = 0.79). It was consistent across most floors (≈1.0). However, the 3rd level showed a markedly higher ASE (5.2), indicating a significant risk of visual and thermal overexposure and highlighting the inherent balance required between daylight sufficiency and solar control.
Quality views (QV) increase progressively with floor level (F = 56.28, p < 0.001; η2 = 0.793). The values increased (min 35.6 to max 52.6), indicating improved visual access and external connectivity on upper floors. The 3rd level, with the widest fields and better daylight, was optimal for view quality – characterised by space depth, visual access and clarity. However, all values remained below the LEED acceptance threshold of 75%, indicating a need for enhanced design strategies to meet performance standards.
In summary, the results demonstrate a vertical stratification in daylight performance: lower and intermediate levels received insufficient daylight, while the upper level achieved better climate-based sufficiency but at the cost of higher dynamic glare and overexposure risks. These significant variations confirm that building height and exposure critically shape daylight quality. Consequently, an integrated design approach – balancing annual sufficiency, real-time glare control and VC – is essential for optimising comfort across all levels.
5.3.3 Correlations between spatial configuration (VGA) and daylight performance
To address RQ3 (How does daylight sufficiency relate to spatial visibility?), The correlation analysis was conducted via the SPSS statistical program using a grid-cell–based dataset, where each grid cell generated from the spatial and daylight simulations represented the analytical unit. The comparison between VGA metrics and daylighting performance indicators used in the current study was conducted through this analysis. The total sample size consisted of N = 64 spatial units.
Pearson correlation analysis was applied to examine the relationships between the spatial configuration variables (VI, TV, VC and IA) that were simulated through VGA and the daylighting performance metrics (ILL, DF, DGP, UDI, sDA, ASE and QV), which were also calculated via Climate Studio daylight simulation analysis. All variables were treated as continuous quantitative measures. Relationships results were categorised into four groups: (1) strong positive correlations within two daylight clusters – quantity-based metrics (e.g. Ill, DF) and climate-based performance metrics (ASE, UDI, sDA); (2) strong intercorrelations among VGA variables; (3) a negative relationship between spatial configuration variables and daylight performance and (4) a moderate correlation for the dynamic metric DGP, indicating glare's partial independence from overall daylight levels. Table 8 Clarify the correlation analysis.
Correlations between spatial configuration indicators (visibility graph analysis – VGA) and daylight performance metrics (N = 64)
| Group of relationships | Variables | r-value | P-value |
|---|---|---|---|
| 1. Positive correlation between (quantity-based metrics and climate-based performance metrics) | ILL/DF – ASE | 0.964/0.944** | <0.001 |
| ILL/DF – sDA | 0.883/0.899** | <0.001 | |
| ILL/DF – UDI | 0.827/0.839** | <0.001 | |
| 2. Strong intercorrelations among VGA variables | TV – IA | 0.923** | <0.001 |
| VI–IA/VC | 0.562/0.549** | <0.001 | |
| VC – IA | 0.498** | <0.001 | |
| VI – TV | 0.431** | <0.001 | |
| 3. Negative relationship between VGA variables and daylight variables | IA – UDI/sDA | −0.358/−0.340** | 0.004/0.006 |
| VI – UDI/sDA | −0.291/−0.276* | 0.020/0.027 | |
| TV – UDI | −0.295* | 0.018 | |
| IA – QV | −0.272* | 0.030 | |
| 4. A moderate correlation for the dynamic metric DGP | DGP – UDI | 0.321** | 0.010 |
| DGP – ASE | −0.294* | 0.018 |
The first group – comprising illuminance (Ill), DF, ASE and QV – showed strong positive intercorrelations (r > 0.90), indicating they assess overlapping aspects of overall daylight availability and intensity. It showed a near-perfect correlation between the climate-based metrics UDI and sDA (r = 0.992, p < 0.01), confirming they represent essentially the same construct of annual daylight sufficiency. This supports the distinction between quantity-based parameters (e.g. Ill, DF, ASE) and performance-based sufficiency parameters (e.g. UDI, sDA).
Second group –the spatial configuration variables obtained from the VGA analysis were strongly intercorrelated (e.g. IA and TV, r = 0.923, p < 0.01). Both are substantially linked to VI and VC, exhibiting comparable characteristics in terms of visibility and spatial accessibility.
Third group- Crucially, these visibility metrics that represent the spatial configuration variables showed significant negative correlations with climate-based daylight sufficiency (e.g. VI vs. UDI: r = −0.358, p < 0.01; and VI vs. sDA: r = −0.340, p < 0.01). Comparable, though slightly weaker, negative correlations were found between through vision and climate-based daylight performance (TV vs. UDI: r = −0.295; and TV vs. sDA: r = −0.280). This indicates that spaces with higher VI – typically located centrally – are less likely to achieve optimal daylight performance, likely due to greater distance from perimeter glazing.
Fourth group- The probability of daylight glare (DGP) dynamic metric showed greater independence, with a moderate positive correlation to UDI (DGP vs. UDI: r = 0.321, p = 0.01) and a negative correlation to ASE (DGP vs. ASE: r = −0.294, p < 0.05). This suggests glare is a distinct aspect of visual comfort, not directly tied to overall daylight sufficiency or exposure.
In sum, the statistics reveal a trade-off: well-connected spaces enhance visibility and circulation but tend to receive less daylight. This underscores the design imperative to balance spatial accessibility with sufficient daylighting in libraries and similar public buildings.
5.3.4 Predictive relationships between visibility graph analysis (VGA) indicators and daylight performance metrics
To address RQ4 (visibility-based analyses vs. daylighting performance metrics, a stepwise multiple regression modelled VGA-based spatial visibility (dependent variable), including VI, TV, VC and IA against daylight performance metrics (independent variables), including both climate-based (e.g. UDI, sDA, ASE) and dynamic measures (e.g. DGP). The resulting model, with an adjusted R2 of 0.257, indicating that approximately 25.7% of the variance in VGA, which was explicitly defined as the dependent variable representing the spatial visibility characteristics of the analysed building layout can be explained by the included daylight variable which summarised in Table 9.
The model indicates that the selected daylight parameters explain 25.7% of the variance in spatial visibility, as shown in Table 10.
Estimated regression coefficients for visibility graph analysis (VGA) predictors
| Model | Unstandarized coefficent (B) | Standardised coefficients | t | Sig | 95% confidence interval for B | |||
|---|---|---|---|---|---|---|---|---|
| Beta | Lower bound | Upper bound | ||||||
| 1 | (Constant) | 11378.06 | 22770.60 | 0.50 | 0.62 | −34202.26 | 56958.38 | |
| ILL | 807.45 | 190.02 | 8.11 | 4.25 | 0.00 | 427.08 | 1,187.83 | |
| DGP | −1,367.19 | 448.99 | −0.73 | −3.05 | 0.00 | −2265.95 | −468.44 | |
| sDA | −12257.92 | 2864.68 | −2.97 | −4.28 | 0.00 | −17992.19 | −6523.65 | |
| ASE | −60885.42 | 14458.07 | −6.90 | −4.21 | 0.00 | −89826.39 | −31944.45 | |
| QV | 2134.82 | 758.34 | 1.05 | 2.82 | 0.01 | 616.84 | 3652.79 | |
Note(s): Dependent Variable: VGA
The linear relationship is expressed as Y = B0 + B1X1, where Y is the predicted visibility metric.
The resulting predictive model is: Y1= B0+ B1X1+B2X2+B3X3+B4X4+B5X5
The ANOVA results confirm the model's statistical significance in predicting spatial configuration (p = 0.000), as detailed in Table 11.
ANOVA result of linear regression
| Model | Sum of squares | df | Mean square | F | Sig | |
|---|---|---|---|---|---|---|
| 1 | Regression | 5127783489.496 | 5 | 1025556697.899 | 5.369 | 0.000 |
| Residual | 11079614655.473 | 58 | 191027838.887 | |||
| Total | 16207398144.968 | 63 |
Note(s): Dependent Variable: VGA
Predictors: (Constant), QV, DGP, SDA, ASE, ILL
The regression indicates a complex relationship between spatial visibility and daylighting efficiency: while illuminance and view quality positively influence spatial visibility VGA, climate-based sufficiency (sDA, ASE) and dynamic factors (DGP) exert a negative effect. This supports the correlation findings: central, highly integrated spaces achieve lower DA – spatially integrated and accessible spaces are typically located deeper within the building – while perimeter zones near windows perform better. The regression model underscores the design imperative to balance daylight optimisation with spatial accessibility, highlighting the need to integrate adequate natural light into core library areas.
Diagnostic tests were conducted to assess the validity of the regression model. Variance Inflation Factor (VIF) values were examined to evaluate multicollinearity and were found to fall within acceptable thresholds, indicating no significant collinearity among the variables. Residual diagnostics further confirmed that the regression assumptions were satisfied. The Durbin–Watson statistic (1.977) indicated independence of residuals, while the normal probability (P–P) plot demonstrated the approximate normal distribution of residuals (Figure 4). Overall, these tests confirm that the dataset is well structured and suitable for the applied statistical analysis.
 A scatter plot of a normal probability plot with hundreds of data points. The x-axis represents the observed cumulative probability, and the y-axis represents the expected cumulative probability. The data points are plotted along a diagonal line, indicating a normal distribution. A regression line is present, running diagonally from the bottom left to the top right. The plot assesses the normality of the analyzed variables. All values are approximated.
Normal probability (P–P) plot assessing the normality of the analysed variables. Source(s): Authors' calculations
A scatter plot of a normal probability plot with hundreds of data points. The x-axis represents the observed cumulative probability, and the y-axis represents the expected cumulative probability. The data points are plotted along a diagonal line, indicating a normal distribution. A regression line is present, running diagonally from the bottom left to the top right. The plot assesses the normality of the analyzed variables. All values are approximated.Normal probability (P–P) plot assessing the normality of the analysed variables. Source(s): Authors' calculations
6. Findings
The analysis demonstrates that the central zone represents an area of maximum visibility and spatial control, as measured by TV and isovist analysis, aligning with established space syntax theory (Turner et al., 2001). However, this visual centrality is not supported by corresponding daylight performance. While isovist metrics effectively capture spatial cognition and wayfinding potential (Peponis et al., 1997), they are insufficient predictors of climate-based daylight sufficiency, such as sDA, ASE or dynamic glare risk, such as DGP. The integrated assessment reveals a critical disconnect: zones with high isovist values frequently correspond to areas of either insufficient or excessive illuminance, highlighting that spatial openness does not guarantee visual or thermal comfort. The study identified that the centre of the library hall exhibited the highest VC. In contrast, daylighting performance – measured by DF and ASE – was concentrated near the perimeter openings, revealing a pronounced discrepancy between perceived spatial openness and measured luminous performance. ASE values, which quantify the risk of excessive direct sunlight (IES LM-83, 2012), were highest adjacent to windows and diminished towards the core, underscoring the limited depth of effective daylight penetration.
The largest IA was in the centre of the hall, whereas effective daylight was concentrated at the perimeter, resulting in a comparatively darker core. This indicates that daylight quantity is not directly correlated with perceived visual openness. While prior studies have linked isovist metrics to daylight availability (Dalton and Bafna, 2003; Wiener et al., 2007), large, enclosed spaces such as this may exhibit divergent behaviour due to constrained fenestration and penetration depth (Tregenza and Wilson, 2011). Consequently, the most visually open zone is not necessarily the best lit, demonstrating that Isovist analysis alone is an inadequate predictor of daylight efficiency.
The analysis reveals a critical design paradox: the central hall, characterised by the largest IA and maximum VI (Turner et al., 2001), also receives the lowest levels of effective daylight, as measured by sDA and UDI. To resolve this discord between spatial centrality and luminous performance, targeted architectural interventions are required. Specifically, the integration of top-lighting strategies – such as skylights, roof apertures, or clerestories – is necessary to inject natural light directly into the underlit core. Concurrently, the use of high-reflectance finishes on ceilings and walls would amplify daylight penetration. This hybrid approach ensures that zones of high TV are supplemented with adequate and uniformly distributed illumination, directly addressing the imbalance in ASE between the perimeter and core. Such integration is essential for aligning spatial configuration analysis with environmental performance metrics, thereby enhancing both perceptual openness and measurable visual comfort.
7. Limitations of the study
This study introduces an integrated analytical framework for examining spatial configuration and daylight performance but acknowledges several limitations.
Firstly, VGA was conducted using architectural plans that included fixed elements affecting visibility, such as walls, fixed furniture and bookshelves. However, movable furniture, temporary obstructions, and human presence were not modelled, which may influence actual sightlines and circulation patterns in occupied conditions. Future studies could further refine the analysis through furniture-aware and occupancy-informed syntactic modelling.
Secondly, the findings are correlational, revealing associations between spatial configuration and daylight metrics but not establishing causal relationships due to possible influences from other factors like acoustics and artificial lighting.
Thirdly, the reliance on simulation-based daylight metrics (sDA, UDI, ASE, and DGP), while robust, does not fully encapsulate subjective visual experiences, which depend on various personal and environmental elements.
Moreover, the study lacks behavioural validation, as it does not involve direct observation of user interactions and preferences, leaving the analysis primarily theoretical. Future studies are recommended to include post-occupancy evaluations and user-cantered observational research for practical insights.
Lastly, the case study is situated in an arid climate, potentially limiting the generalisability of the findings to other climates or architectural types; broader validation across diverse buildings is suggested to strengthen the framework's applicability.
8. Conclusions and recommendations
This study examined the environmental–spatial relationship between daylight performance metrics and spatial visibility indices in the AUC Main Library using an integrated simulation and configurational analysis framework. By combining CBDMs (sDA, UDI, ASE), dynamic glare assessment (DGP, DF), spatial configuration variables (VI, TV, VC and IA), the research quantified statistically significant associations across five building levels.
The findings demonstrate a clear spatial stratification in daylight performance, with upper levels achieving higher illuminance and DA, albeit with increased exposure risk, while central and lower levels exhibited reduced daylight sufficiency. Importantly, a consistent trade-off was identified between spatial integration and DA: highly integrated and visually central zones tended to display lower climate-based daylight performance, whereas perimeter zones achieved greater daylight availability.
Regression analysis confirmed that selected daylight metrics explain a meaningful proportion of variance in spatial visibility indices, reinforcing the systematic relationship between luminous performance and configurational properties. However, these findings reflect statistical associations rather than causal mechanisms.
The study contributes a methodological framework for integrating daylight simulation and spatial configuration analysis in academic library contexts. Practically, the results support design strategies that balance daylight sufficiency, glare control, and spatial legibility, particularly in arid climates where solar intensity amplifies performance contrasts.
This research does not include behavioural or occupancy-based validation. Future studies should incorporate post-occupancy evaluation, user observation, and seating distribution mapping to test the hypothesised relationship between environmental–spatial conditions and actual user patterns.
The authors would like to express their sincere appreciation to the Campus Planning Office (CPO) for providing the architectural as-built drawings of the Main University Library.

