
This paper aims to analyze the effect of a recent disruption of Mexico's gasoline supply chain on the usage of public bike-sharing systems in Mexico City and Guadalajara.
The authors use a detailed data set to understand the usage patterns of Ecobici and Mibici. The authors assess both systems with a differences-in-differences econometric model using the least popular stations as a control group.
The authors find that the number of rides increased significantly shortly after the event because less popular stations became more utilized.
The authors show that when the effects of gasoline shortages were noticeable, usage rates increased in Guadalajara and Mexico City, but the rise primarily came from the users selecting more bikes from the less popular stations. Therefore, the authors show that citizens in both cities regarded bike-sharing as an adequate means of transportation, maximizing system usage during a disruptive time. This finding suggests that cities should invest in improving public bike-sharing systems to reduce carbon emissions and increase their population's well-being.
The authors use a publicly available data set to understand how citizens answered to a major disruption. Furthermore, this is one of the first papers that align supply chain risk management with sustainable transportation and analyzes its effects on citizen behavior in a Latin American setting.
El propósito de este artículo es analizar el efecto de una interrupción en la cadena de suministro de la gasolina en México sobre el uso del sistema de bicicletas públicas en Ciudad de México y Guadalajara.
Usamos una base de datos detallada para entender los patrones de uso de Ecobici y Mibici. Analizamos ambos sistemas a través de un modelo econométrico de diferencias en diferencias utilizando las estaciones menos afectadas como grupo de control.
Encontramos que la utilización del sistema aumentó en número de viajes de manera significativa luego del evento. Esto es debido a que las estaciones menos populares se empezaron a utilizar de manera más intensiva.
Demostramos que los habitantes de las dos ciudades decidieron buscar alternativas de transporte cuando los efectos de la escasez de gasolina se sintieron con fuerza. Esto significa que los ciudadanos consideran que las bicicletas públicas son un medio de transporte adecuado y que durante episodios inoportunos decidieron buscar opciones en las estaciones menos populares maximizando el uso del sistema. Por lo que las ciudades deberían invertir en la mejora de dichos sistemas para que sean más utilizados y así se reduzcan las emisiones de carbono y para que aumente el bienestar en la población.
Utilizamos una base de datos abierta para entender cómo los ciudadanos respondieron a una interrupción importante. Adicionalmente, este es uno de los primeros trabajos que alinea la gestión de riesgos en la cadena de suministros con transporte sostenible y analiza su efecto sobre el comportamiento de los usuarios en un contexto latinoamericano.
1. Introduction
Numerous countries have suffered the consequences of gasoline shortages throughout history, especially when supply chains have been disrupted due to acts of terror, wars or by erroneous governmental policies. Several economists analyzed the events of the 1973 oil crisis when members of the Organization of Petroleum Exporting Countries decided to proclaim an oil embargo that led to gasoline shortages across the globe. They found that US consumers were willing to pay the additional price set at the gas station to continue to travel as before (Curtin, 1976; Peskin, 1980).
One key difference is that today, citizens of large cities have several alternatives in terms of transportation. With the rise of the sharing economy, it is easy for them to use an app to rent a bicycle, a scooter or to hail a ride. This has led to a brand-new area of interesting research that includes pricing (Li et al., 2016; Bai et al., 2019; Ming et al., 2019), incentives (Chen et al., 2019) and service design (He et al., 2017; Gurvich et al., 2019). Moreover, since the early 2000s, bike-sharing systems have been installed worldwide, tackling transportation issues with a sustainable approach. These systems have been so successful that they have reached more than 1,000 cities on every continent (Seattle Times, 2016). One problem that has been thoroughly analyzed in the Operations Management field is where to locate the stations and how to rebalance the system when usage increases (Shu et al., 2013; Erdogān et al., 2015; Schuijbroek et al., 2017; Kabra et al., 2020). However, we have not seen a paper that analyzes the impact of a supply chain disruption on the usage of bike-sharing systems.
In this article, we use a recent example of a supply chain disruption in the transportation sector to understand the effect of fuel shortages on public bike-sharing systems. In December 2018, Mexico had to close several gasoline pipelines to prevent fuel robberies (El Financiero, 2018). This decision led to a period of two weeks with lower supply because fuel was carried in trucks, which do not have sufficient capacity. Consequently, many gas stations had to close, and vehicle owners had to line up where fuel was available, creating long lines and traffic jams across major cities (El País, 2019).
We contribute to the sharing economy literature and the supply chain disruption literature by answering the question: What is the effect of gasoline shortages on public bike-sharing? We use data from Guadalajara's public bicycle sharing system. We show that after the approval of the government's plan to tackle gasoline theft, usage levels increased by 41.69% one month after the event, and the total number of users increased by 20.71%. Additionally, we show that after the supply of gasoline had been reestablished, the number of users and rides continued to grow. This means that users enjoyed the system and decided to keep using the bicycle as a sustainable transportation method.
Moreover, we analyzed what happened in Mexico City, and we found that usage levels increased by 23.30% in January 2019 compared to December 2018 and by 1.61% compared to January 2018. However, usage levels decreased in February 2019, when the availability of gasoline was returning. We believe that these differences between the two largest Mexican cities come because there are many more transportation options in the capital. For example, in 2019, more than three mobility-sharing companies entered the market (CNN, 2019).
With this analysis, we show that in the case of Guadalajara, ridership increased significantly even after gasoline had been restored on January 25 (Expansión, 2019). However, in Mexico City, we find that after gasoline returned to the city, usage levels of the public bike-sharing systems were not impacted anymore, and they returned to normal. We also analyzed the effect at the system level with a differences-in-differences econometric model. Since the event was not homogeneous across the cities i.e. some stations still had gasoline reserves. We use the set of least popular stations before the event in terms of usage as a control group and the most popular ones before the event as a treatment to run an event study to understand the evolution of usage after the event. Using the median usage as the separator, we find that in Mexico City and Guadalajara, the usage in the most popular stations decreased compared to the least popular ones. This means that the previously unpopular stations were being used around 10% more after the disruption because users were willing to walk more to obtain a public bicycle to get to their destination. Moreover, we did the same analysis with usage time as a dependent variable to find that in Mexico City, there was no effect, and in Guadalajara, it seems that there is a small negative effect. This means that some users picked up more bikes in less popular stations but used them for a smaller period.
Hence, this is one of the first papers that links the supply chain disruption literature with the sharing economy literature. Our findings are important for policymakers because there is a need to invest in public bike-sharing systems. As cities expand, there is a growing need for transportation, and sustainability should be one of the main focuses of companies and governments (Wagner, 2015). Moreover, we push forward research in supply chain risk management and sustainable transportation in Latin America (Young and Esqueda, 2005).
The rest of the paper is organized as follows: Section 2 reviews the literature, Section 3 explains how gasoline theft worked and presents the government's plan to stop this situation. Section 4 specifies the data set that we used. We offer and discuss our findings in Section 5, and we conclude in Section 6.
2. Literature review
Our work is related to the supply chain risk management literature and the sharing economy literature. The first papers published under the former's umbrella focused on supply-demand coordination (Fisher et al., 1997; Boyaci and Gallego, 2004). Afterward, they evolved to include contracting (Kleindorfer and Wu, 2003; Martínez-de-Albéniz and Simchi-Levi, 2005). But one of the first to talk about the adequate management of risk to avoid a supply chain disruption was Chopra and Sodhi (2004). They explain how a company should manage its supply chain to prevent any potential disruption. In their seminal piece, Kleindorfer and Saad (2005) state that supply chain disruptions include: operational risks, which can happen due to equipment malfunction, unforeseen discontinuities in supply, strikes, etc., and risks that come from natural disasters, terrorist acts and political instability. They also provide a conceptual framework for firms to mitigate the potential consequences of a disruption.
Norrman and Jansson (2004) recount how Ericsson, a major company in the telecommunications industry, had to develop new processes to handle disruptions after a fire in one key supplier generated a substantial impact on the company's revenues. Zsidisin et al. (2004) argue that firms need to take a closer look at their entire supplier base to see if there are any potential risks within the supply chain. The most important tool is to have a clear communication channel between the firm and the suppliers to respond faster to any potential disruption. Hendricks and Singhal (2005) investigate how disruptions affect the stock price of the involved firm. They find a negative relationship between disruptions and stock prices, with the mean abnormal return nearing −40%. Ali et al. (2018) show how a decentralized firm can offer lower retail costs if there is any potential disruption. For a more thorough review of the supply chain risk management literature, we point the reader to Tang (2006), Rao and Goldsby (2009) and Ho et al. (2015).
The sharing economy literature started to grow in recent years with the birth of apps such as Uber and Airbnb. Li et al. (2016) tackle pricing and revenues in AirBnb, comparing what happens when the offered place is handled by a professional or by a nonprofessional host. They show that properties managed by professionals earn 16.9% more in daily revenue and have 15.5% higher occupancy rates. Ming et al. (2019) develop a structural model to estimate consumer and driver price elasticities. They use data from Didi Chuxing to calibrate the model, and they can show that surge pricing improves both consumer and driver welfare, and it allows the platform to increase its revenues. Chen et al. (2019) find the optimal bonus strategy that a ride-sharing company must follow to improve capacity levels during peak hours. He et al. (2017) analyze the problem of designing a car-sharing system in which only one-way trips are allowed. Using data from an electric vehicle sharing company, they propose the optimal service region to maximize consumer adoption and thus profits. Gurvich et al. (2019) study the problem of capacity management when workers are allowed to choose their schedule. Their model shows that this strategy can hurt the firm because profits go down when demand is not satisfied. Therefore, the firm should increase the number of agents available to have more flexibility to answer time-varying requests.
There is also a large number of papers that have focused specifically on bicycle-sharing systems. Shu et al. (2013) develop an analytical model to optimize the design of a bike-sharing system. In their model, they estimate the flow of bicycles within the network, and they also examine how unit redistribution should be managed to improve the flow of the system. Erdogān et al. (2015) tackle the static rebalancing problem in these types of systems because demand is both time and location variant among stations. The system manager needs to select how to allocate resources to minimize costs adequately. They develop an algorithm that can optimally solve the problem when the system has up to 60 stations. Contributing to the same problem, Schuijbroek et al. (2017) determine the service level requirements at each station, and they design near-optimal vehicle routes to rebalance the inventory. Kabra et al. (2020) develop a structural model to estimate the impact of accessibility and availability on user demand. They find that if the rider has to walk an additional meter to get to the station, the user's likelihood of using bikes decreases. Moreover, they show that an increase in bike availability would also increase the levels of ridership.
Corcoran et al. (2014) empirically analyze the impact of weather conditions and calendar events on bike-sharing utilization. They demonstrate that temperature and public holidays positively affect ridership, meaning that users prefer to ride bicycles when temperatures are warmer and when they have fewer time constraints. Additionally, they show that rainfall and wind speed have a negative effect, mainly because they make travel less comfortable and more dangerous. El-Assi et al. (2017) confirm these findings using data from Toronto's public bike-sharing system.
Efthymiou et al. (2013) study the case of Greece, where they develop a factor analysis to analyze the advantages and disadvantages of car and bike ownership. They show that citizens whose income ranged from 15,000 euros to 25,000 euros were more likely to join vehicle sharing systems. Corcoran et al. (2014) use spatial analysis techniques to show how climate and holidays affect Brisbane's public bike-sharing system. Fishman et al. (2014) analyze the relationship between vehicle usage and bike-sharing in five large metropolitan areas. They estimate the emissions reduction that bike-sharing has, and they argue that regulators should invest more in these systems. Sochor et al. (2014) study the case of Gothenburg's design, and they show why users decided to join. We point the reader toward Fishman et al. (2013) and Fishman (2016) for a more extensive literature review. Furthermore, we expand the increasing literature focusing on Latin American managerial problems (Brenes et al., 2008; López and Álvarez, 2018). Specifically, we extend the view of supply chain risk management (Young and Esqueda, 2005) by analyzing a case in which citizens were affected by a disruption created by a public policy.
3. Guadalajara, Mexico City and the Mexican gasoline industry
Guadalajara is located in the central area of Mexico and is the capital of the state of Jalisco. According to the 2010 census, the Metropolitan Area of Guadalajara had 4,434,878 inhabitants, making it the second-largest metropolitan area after Mexico City (INEGI, 2013). Estimates indicate that a total of 10 million liters of gasoline are needed daily to satisfy transportation and distribution across the city (Expansión, 2019).
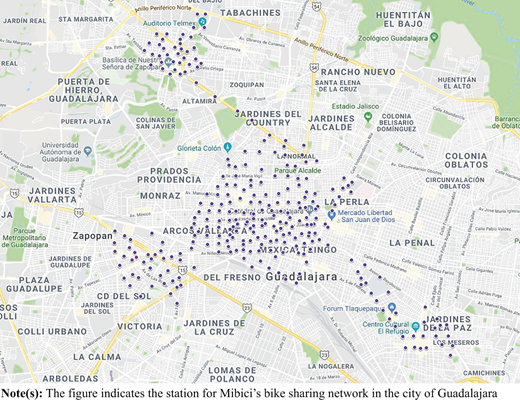
Mibici is the public bike-sharing system available in the city of Guadalajara. It is managed by the Mobility and Transportation Institute for the State of Jalisco, and it is operated and maintained by BKT Bici Pública. This company was selected after public bidding in 2014 and again in 2020 (Jalisco, 2020). Mibici began its operations in December 2014 with a total of 86 stations and 860 bicycles. A few weeks after its inception, 300 more bikes were added to the system, and 30 stations were opened at Zapopan. Moreover, on August 18, 2016, the areas of Chapalita, Mezquitán, Arcos Vallarta, and Tlaquepaque were included as part of the second phase of the project, incorporating 120 stations, to sum up to a total of 236 stations across the city, with two thousand bicycles available to rent (Tráfico ZMG, 2016). In Figure 1, we observe the location of Mibici's stations as of March 2019. It is clear that there is a large cluster in the city center, where most short-term rides are bound to happen, and there are three small clusters: one in Zapopan in the northwest, one in Tlaquepaque in the southeast, and one in Chapalita in the southwest. Note that Mibici was created to promote sustainable transportation under Jalisco's State Plan of Development 2013–2033 (MiBici, 2019).
To use the system, a potential user can choose from two options: a temporary subscription that can last one, three, or seven days; or an annual subscription. In every case, rides that last fewer than 30 min are included in the upfront registration fee that the user had to pay. If the ride lasts between 31 and 60 min, the user (she) has to pay an additional 23 Mexican Pesos, and if it is more than 60 min, she would have to pay 33 Mexican Pesos for every additional 30-min period. For the temporary subscription, the rider arrives at a bicycle station. She selects the option “rent a bicycle” and decides the number of days during which she wants to be a rider. To make the payment, she inserts her credit card, and she fills in the required information. Finally, she receives the confirmation and which bicycle has been allocated for her. After extracting the bike from its dock, she has two minutes to verify the state of the bicycle, if it does not work, she can return it, and the system will allow her to use a different one. For the annual subscription, she has to register online or in-person at one of Mibici's customer centers. After making the payment, she receives a user card that allows her to take one bike at any station.
Mexico City is one of the largest metropolitan areas in the world in terms of population, with 8.8 million inhabitants in the Federal District and 15.1 million inhabitants in the state of Mexico, according to the last available census (INEGI, 2013). Moreover, the number of vehicles registered has increased from 31.6 million in 2010 to 45.5 million in 2017. Therefore, there is a large number of citizens that use their car to ride across the city. Additionally, in terms of gasoline demand, according to PEMEX, Mexico City required 10.8 million liters of gasoline daily, and the state of Mexico required 16.8 million liters in 2018 (Nodal, 2019). Hence, a shortage of gas could easily disrupt the city's operations.
Ecobici was a pioneer in Mexico because it was the first public bike-sharing system installed in the country. It is managed by Mexico City's Mobility Secretary (Semovi), and it is operated and maintained by Clear Channel (The City Fix, 2010). This North American advertising company has experience operating public bike-sharing systems in Europe and Latin America (Clear Channel, 2021). Ecobici started working on February 16, 2010, with 85 stations and more than 1,000 bikes, focusing on the central areas of Mexico City. Semovi's objective was to provide an environmentally friendly method of transportation, which allowed citizens to save time for short trips. After the development of three more phases of the project, tourists and residents can rent over 6,000 bicycles in 480 stations and have the possibility of taking both mechanical and electrical bikes.
To sign up for the system, any potential user needs to have a valid ID and a debit or a credit card because he or she needs to pay the respective inscription fee, which can last for one, three, or seven days, or for an entire year. New users are offered the possibility of taking a short class to learn more about transportation rules and how they should behave while riding the bicycle. After the person has received the Ecobici card, he or she can go to any station that has an available bike, and just after tapping the reader, the screen will let the rider know which bike has been assigned. He or she will pull up the bike from the security rack and will be able to use it for free for the first 45 min. After that, the user has to pay an additional fee that becomes a hefty penalty if the bike is taken for more than 24 h. When the rider has finished using the bicycle, he or she needs to find a station with an open spot to anchor the bike. After checking that it has been locked, the user can tap the station screen to verify that the bike was correctly returned.
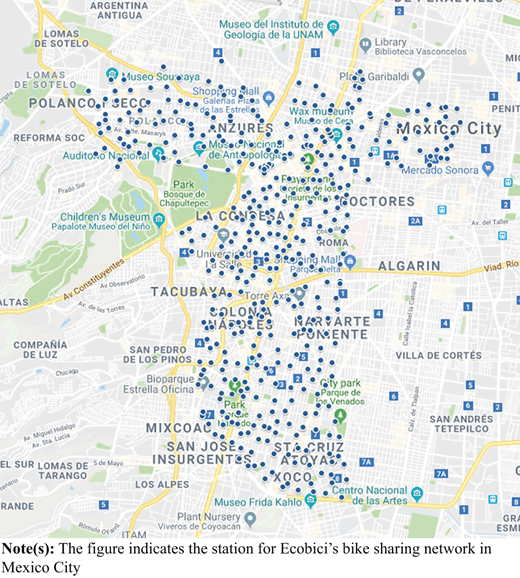
The system has increased the membership fees several times in its seven years, approximately by 10% yearly. Moreover, it ran into some problems in 2014 when the system was saturated, and it had to tell prospective new users to sign up for a waiting list to obtain their user card. After the third phase of the system was implemented, they have not run into this type of issue (Milenio, 2014). In Figure 2, we can see how the stations are scattered across Mexico City. They have been clustered in the city center to provide Ecobici's users with a “last mile” displacement.
According to Mexico's National Institute of Statistics and Geography (INEGI), there are more than 550,000 bike riders in Mexico City (La Lista, 2021). One of the main concerns growing because of the increase in bicycle usage is the rise of accidents in the city. For example, in the first nine months of 2020, there were 685 injured riders and a total of 16 deaths (Milenio, 2021). Therefore, there is a need to promote adequate bicycle culture in a city where more than ten thousand traffic accidents occurred in 2019 (INEGI, 2020). Note that this problem is not exclusive to Mexico City. In Guadalajara, twenty riders died in 2019. Although the government is investing in bike lanes, there is still a need to create education programs for drivers and riders to develop a safer environment (Carapia, 2020).
Focusing on Mexico's gasoline supply chain, two refineries process the fuel that is sent to Mexico City and Guadalajara. These are the Salamanca and the Tula refinery. To have a more efficient distribution, gasoline is pumped via pipelines across several states to satisfy the demand. However, there was a problem because many portions of the pipeline were not guarded. Between 2006 and 2018, there were more than 100,000 investigations regarding gasoline theft, with a large concentration of cases happening more recently as approximately 31,000 of them were opened in 2018. Estimates indicate that around 3.4 billion U.S. dollars of gasoline have been stolen, and there were no signs of stopping this debacle until December 2018. Governmental agencies decided to tackle this problem by closing the pipelines, protecting the affected areas with the military and distributing gasoline with trucks. The problem is that this strategy created shortages because the volume each truck carries is limited, and it takes more time to dispatch the fuel. Moreover, citizens started to panic because of this reduced allocation, and they began to buy more gasoline, creating even more significant shortages and long lines outside gasoline stations (Excelsior, 2019; Univisión, 2019). However, the plan was rapidly successful. Just two months after the pipelines were closed, the number of barrels stolen decreased to 15,000 compared to 74,000 in December 2018, and the government decided to gradually reopen the pipelines to eliminate the shortages (Vanguardia, 2019).
4. Data
This section presents information about the data that we used to analyze the effect of gasoline shortages on bike-sharing.
We obtained data through Mibici's open data portal [1]. We were able to download monthly usage files that include precise information about each ride that had been recorded on the system [2]. On every file, we have the trip number, a user ID (generated by the system), the user's gender and year of birth, the station in which he or she picked up the bike and the station in which it was returned, and finally, the exact moment (hour, minute, second, day, month, year) in which the bike was taken and returned.
With this information, we can calculate the duration (in seconds) of every ride. Additionally, we can obtain information about new users by analyzing the first time that the user appeared on the database. In the end, the data set spans from December 2014 until February 2019, providing us with a total of 8,094,006 observations. However, we decided to drop rides that lasted more than 24 h because they are not within a regular usage rate. Moreover, we also had to drop rides that lasted fewer than two minutes because, in these scenarios, it is highly likely that there was something wrong with the bike that the user selected [3]. Therefore, we have a total of 7,771,094 rides.
We also obtained data through Ecobici's open data portal [4]. In this case, we downloaded monthly usage files from February 2010 until February 2019 [5]. Every file contains the following information: the bicycle ID, the user's age, and gender, the exact second when the bike was taken and the moment when it was returned, which allowed us to calculate the trip's duration in seconds, the number of the station where it was rented, and the number of the station where it was returned. In total, we have 58,261,668 observations but like in Guadalajara's case, we dropped the usages that took fewer than 120 s or more than 24 h [6]. Hence, we have a total of 57,937,640 rides.
5. The effect of gasoline shortages on Mexico's bike sharing systems
We can perform a preliminary analysis to see the evolution of Mibici. In Table 1, we can observe how it has not stopped growing in the number of rides and individual users since its inception. Moreover, we see a more significant rate of increase since the third quarter of 2016 because, as we explained in the previous section, on August 18, 2016, 120 new stations opened across the city, expanding the potential user base. After implementing the second phase of the project, the total number of users has tripled, and the number of rides has quadrupled. Moreover, the average usage time has not changed much over the period studied, with a total average of 697.35 s. However, we do witness significant variations in these times, with the standard deviation averaging 928.63 s. This is mainly because some stations are located far apart from each other, and riders might prefer to use this system than to drive.
Mibici's quarterly usage
| Quarter | Rides | Users | Avg duration (sec) | SD duration (sec) |
|---|---|---|---|---|
| Q1-2015 | 94,890 | 2,680 | 649.11 | 842.38 |
| Q2-2015 | 104,962 | 2,973 | 611.53 | 746.6 |
| Q3-2015 | 115,474 | 3,326 | 623.23 | 904.2 |
| Q4-2015 | 131,737 | 3,563 | 607.11 | 747.62 |
| Q1-2016 | 137,410 | 3,634 | 600.67 | 739.93 |
| Q2-2016 | 172,124 | 3,838 | 590.75 | 775.44 |
| Q3-2016 | 229,852 | 5,821 | 677.68 | 1113.56 |
| Q4-2016 | 352,302 | 7,210 | 718.00 | 1133.29 |
| Q1-2017 | 487,545 | 10,033 | 726.71 | 1081.82 |
| Q2-2017 | 535,307 | 11,317 | 706.81 | 1065.6 |
| Q3-2017 | 646,292 | 13,278 | 716.91 | 1186.42 |
| Q4-2017 | 697,485 | 14,060 | 697.61 | 872.01 |
| Q1-2018 | 758,537 | 15,601 | 696.01 | 877.64 |
| Q2-2018 | 812,397 | 16,076 | 696.28 | 870.02 |
| Q3-2018 | 820,559 | 17,273 | 700.04 | 857.55 |
| Q4-2018 | 888,777 | 17,926 | 710.17 | 1044.1 |
Note(s): The data presented in this table was obtained through Mibici's open data portal. Avg Duration is the average time in seconds of all the rides taken during the quarter. SD Duration represents the standard deviation of the ride duration in seconds
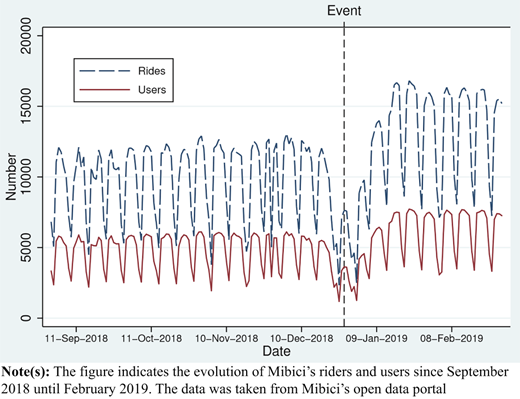
We can focus on a period closer to the event we are interested in analyzing. In Figure 3, we see the evolution of the number of users and rides daily from September 2018 until February 2019. It is clear that the usage is concentrated on weekdays, and we see that fewer riders decide to use the system during the Christmas holidays. However, in January 2019, we see a considerable increment in the number of users and the number of rides. For the entire month, the number of rides summed 389,307, which represented an increase of 41.69% compared to December 2018 and an increase of 61.93% compared to January 2018. If we focus on the number of users, we also see that they increased significantly in January 2019, having 17,376 riders, which meant an increase of 20.71% compared to December 2018 and 47.35% compared to January 2018. Therefore, people had an incentive to use this system as gasoline shortages disrupted regular transportation across the city.
We can also assess the evolution of Ecobici since its inception in February 2010. In the nine years that the system has been available to Mexico City's residents and tourists, the system has grown across the city, reaching more people and neighborhoods. Recall that it started with 85 stations, and now it has 480, more than five times more, meaning that it has been a success.
In Table 2, we can observe the yearly evolution of Ecobici in terms of the number of rides and the average duration that these rides took. We see a significant increase between 2012 and 2013 because the second phase of the project was implemented. Also, we see another increase in usage in 2015 when the fourth phase of the project started. We do not witness any significant change in terms of the average duration, with averages going from 771 to 886 s, roughly between 13 and 15 min, which seems like an adequate amount of time for short-distance trips. However, the focus of this paper is to see what happened with the system after the Mexican government decided to tackle gasoline theft. Therefore, in January 2019, 693,690 rides were taken, compared to 562,614 in December 2018 and to 682,682 in January 2018. This means that the monthly increase rose 23.30% and the yearly increase 1.61%. If we look at what happened in February 2019, when gasoline shortages were no longer happening, 680,586 rides were taken compared to 690,261. Hence the monthly usage decreased by 1.89%, and the yearly use decreased by 1.4%. Thus, in Mexico City's case, it seems like the event only had a positive effect during January and that the system returned to previous numbers starting from February.
Ecobici's yearly usage
| Year | Rides | Avg duration (sec) | SD duration (sec) |
|---|---|---|---|
| 2010 | 834,543 | 832.16 | 2356.40 |
| 2011 | 2,526,941 | 808.11 | 1634.99 |
| 2012 | 2,711,405 | 771.26 | 1622.42 |
| 2013 | 6,478,027 | 786.65 | 1236.71 |
| 2014 | 7,908,739 | 791.11 | 1224.95 |
| 2015 | 9,148,662 | 821.13 | 1155.37 |
| 2016 | 9,021,241 | 817.00 | 1179.93 |
| 2017 | 9,447,696 | 865.94 | 1582.15 |
| 2018 | 8,486,110 | 886.78 | 1706.80 |
| 2019 | 1,374,276 | 871.48 | 1370.89 |
Note(s): The data presented in this table was obtained through Ecobici's open data portal. The year 2019 includes the months of January and February. Avg Duration is the average time in seconds of all the rides taken during the year. SD Duration represents the standard deviation of the ride duration in seconds
One empirical methodology that we can use to see whether there was an impact of gasoline shortages on bike-sharing is differences-in-differences (Donald and Lang, 2007). In this case, we know that the disruption effect did not hit the city equally. By having a heterogeneous impact across both regions, we can separate the stations into two groups, the most used and the least used (Parker et al., 2016). Therefore, this method allows us to compare the effect of the shock in the treatment group with the impact of the shock in the control group (Abadie, 2005). In other words, with this approach, we can understand the system's dynamic to see if the overall increase in system usage that we saw in the raw data came because of an increase in the use of the most popular stations. Therefore, we define the following equation:
where log(Rmt) is the natural logarithm of the number of rides that occurred at time t in station m, Treatm is an indicator that is equal to one when station m is part of the most used group and zero otherwise, Postt is an event marker that becomes one after January 8, 2019, when the first reports of scarcity were released in Guadalajara and in Mexico City (Excelsior, 2019; Univisión, 2019). We include αm as station fixed effects to control for any variation across the cities, and we add δt as time fixed effects to control for variations over time. We do not include separate regressors for Treat and Post because they are absorbed by the fixed effects (Bertrand et al., 2004). Note that we will also use the natural logarithm of ride duration as a dependent variable.
To be closer to the event and to have most stations open to create our treatment and control groups, we use data from September 2018 until March 2019 for our regressions. This incorporates the disruption period, which lasted from January 8 until January 25, and lets us observe the short-term implications of the system's increase in utilization.
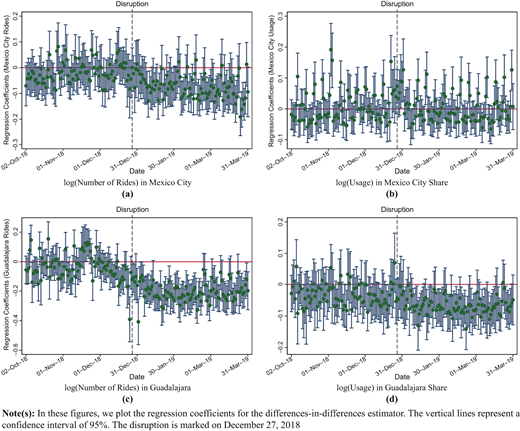
In Figure 4, we can observe the event study for our four cases plotting the regression coefficients for the period comprised between October 2, 2018, and March 31, 2019. In Figures 4(a) and (b), we observe that the effect of the disruption is negative on the number of rides in both cities. This means that bikes picked up from the most popular stations decreased as users started to pick available bikes wherever available. This finding tells us that after the Mexican gasoline supply chain was disrupted, the usage of the system was positively affected because the least popular stations were being used more often. In particular, in Mexico City, this increase is approximately 10%, and in Guadalajara, it is around 3%. In terms of usage time, there does not seem to be an effect. Riders used the bikes for the allotted time and did not seem to take longer rides after the event. Moreover, we ran a secondary regression collapsing our data set at the weekly level.
In the end, we saw that the event generated a sudden increase in the number of rides in the city of Guadalajara and Mexico City in the beginning. In the case of the capital, we showed that levels returned to normal a few days after gasoline had been restored, probably because users decided to go back to their vehicles, or they chose to use one of the multiple ride-sharing options that exist in the city. In Guadalajara, the additional options are fewer. Since the city is smaller, users probably prefer to ride Mibici's bicycles to their offices in the morning and their homes in the afternoon.
The notion that this problem gives us is that these systems need to be prepared to handle any sort of potential supply chain disruptions. It would be interesting to have data to see if, after the event, users struggled to find bicycles because the system usage was at an all-time high in the city of Guadalajara. In Mexico City, it would be interesting to complement our data set with information about the competitors to see if we can find a positive effect of gasoline shortages on ride-sharing by summing all the alternatives.
This paper shows that the optimal allocation problem for these services should be prioritized when a potential traffic disruption is on the way. We hope to develop further research that tackles this critical question of optimal decision-making under uncertainty in service design.
6. Conclusions
We have seen how an exogenous event led by a governmental plan affected Mexico's gasoline supply chain. This tactic led to one of the worst gasoline shortages in the country's history, making it difficult for citizens to find reliable transportation options. One viable option for short-distance trips is a bicycle because it does not require fuel to operate. Therefore, we focused on analyzing the demand for public bike-sharing systems in the two largest Mexican cities: Mexico City and Guadalajara.
Assessing the raw daily data obtained from each city's open data portal, we found that in Guadalajara, the total number of rides for January 2019 surpassed those of December 2018 by 41.69% and those of January 2018 by 61.93%. In Mexico City, we have a significant increase compared to December 2018 of 23.30% and just an increase of 1.61% compared to January 2018. One possible explanation for this difference is that citizens of Mexico City have a more extensive breadth of options regarding transportation. In the last couple of years, more than eight different ride-sharing companies have decided to enter the market offering bicycles, electric bicycles, scooters, etc. Therefore, this high level of competition splits transportation utilization among the possible options. It would be interesting to see how the event affected all of these companies and how citizens chose which one to pick: did proximity, price or availability drive them?
Using a differences-in-differences econometric model, we found that users in Guadalajara decided to use the system in a more balanced way, with the number of rides decreasing in the most popular stations but increasing overall the system. In Mexico City, we find a significant decrease in the number of rides across the popular stations. This could also be led by bikes not being available and users having to walk to the less popular stations to grab the bike. Moreover, when we analyze usage, we did not find a significant effect in Mexico City, but there seems to be a negative effect in Guadalajara.
This paper shows that citizens regard bike-sharing as a substitute for personal vehicles. During the event, there was a significant increase in the number of new users, which led to a rise in the number of times that the system was used, even in the less popular stations. We believe that cities should spend considerable time advertising the benefits of bike-sharing systems to make people sign up. Because we have seen that once they try the system, they are more likely to stay and reuse it. Thus, this creates a positive effect for the city regarding pollution and well-being (Ecobici, 2015).
In terms of future research, we would like to analyze what happened with ride-sharing platforms to see how they managed this unprecedented supply chain disruption because news reports state that they decided not to increase their prices and continued offering their services without interruption. This is consistent with the retail and pricing literature that says that prices do not go up when demand suffers large shocks (Chevalier et al., 2003).
We would like to obtain daily availability data from the public bike-sharing systems to see whether this increase in demand led to different movement patterns across each city. Moreover, we would like to understand how they managed to rebalance the system. It is probable that during those chaotic days, the system manager could not adequately allocate resources to move bicycles to under-served stations. In both systems, they use gasoline-powered trucks to move bikes to the empty stations. One interesting question that follows this problem is if the inclusion of electric vehicles to rebalance the system could be beneficial in terms of environmental management.
Management area: Strategic and public management
Notes
The State of Jalisco has promoted the usage of open data for research and transparency. All the data sets can be accessed through datos.jalisco.gob.mx. Moreover, BKT Bici Pública confirmed that the data that they post on their website is the same that is recorded by the system.
MiBici's monthly data sets can also be downloaded from www.mibici.net/en/open-data.
In Mibici's data set, we dropped 1,296 observations that were from rides that lasted more than 24 h and 321,616 observations due to potential bike malfunctions.
In the past years, Mexico City has been making a strong effort to publish data from public institutions to incentivize research and transparency. All the data sets can be accessed through datos.cdmx.gob.mx.
Ecobici's monthly files can also be downloaded from www.ecobici.cdmx.gob.mx/es/informacion-del-servicio/open-data.
In Ecobici's data set, we dropped 318,993 observations whose usage was fewer than 120 s and 5,035 whose duration was more than 24 h.
References
Appendix
Usage and duration in Mexico City and Guadalajara
| Month | Mexico city | Guadalajara | ||||
|---|---|---|---|---|---|---|
| Rides | Avg duration | SD duration | Rides | Avg duration | SD duration | |
| Jan-18 | 682,682 | 844.72 | 1348.36 | 240,424 | 684.27 | 786.89 |
| Feb-18 | 690,261 | 1003.33 | 2965.33 | 248,023 | 693.68 | 776.64 |
| Mar-18 | 732,984 | 881.73 | 1495.75 | 270,090 | 708.60 | 1028.54 |
| Apr-18 | 744,401 | 882.31 | 1517.42 | 274,019 | 697.10 | 885.96 |
| May-18 | 794,118 | 890.97 | 1659.24 | 290,825 | 689.48 | 757.38 |
| Jun-18 | 686,436 | 894.05 | 1794.66 | 247,553 | 703.38 | 970.14 |
| Jul-18 | 714,929 | 866.28 | 1566.32 | 254,181 | 711.97 | 1079.07 |
| Aug-18 | 728,788 | 864.85 | 1508.69 | 286,859 | 693.47 | 757.65 |
| Sep-18 | 697,238 | 874.90 | 1554.43 | 279,519 | 695.93 | 714.64 |
| Oct-18 | 779,984 | 881.66 | 1564.88 | 315,820 | 692.53 | 679.39 |
| Nov-18 | 671,675 | 888.24 | 1470.85 | 298,211 | 715.35 | 1097.90 |
| Dec-18 | 562,614 | 867.04 | 1452.63 | 274,746 | 724.84 | 1298.87 |
| Jan-19 | 693,690 | 864.73 | 1397.08 | 389,307 | 725.31 | 1039.36 |
| Feb-19 | 680,586 | 878.35 | 1343.63 | 374,453 | 717.30 | 926.65 |
Note(s): Avg duration represents the average usage time in seconds. SD Time represents the standard deviation also in seconds
