Dysathria is a neuromotor disorder that causes the individual to speak with imprecise articulation. This paper presents an automatic analysis framework for dysarthric speech, using a linguistically motivated representation based on distinctive features. Our framework includes a seq2seq phonetic decoder for Cantonese dysarthric speech. The manually or automatically transcribed phones can be mapped into a representation that consists of 21 distinctive features (DF). The DFs between the transcribed phones and canonical phones are compared in order to identify articulatory error rate (AER) for each DF. This forms an AER profile for a given set of dysarthric recordings from a speaker. Experiments show that the difference between the AER profile derived from manual versus automatic phonetic transcription is relatively small - with a root mean squared error (RMSE) of 0.053 for the word-reading task and 0.085 for the sentence-reading task in CU DYS. In addition, the correlations between the AER profiles are high, at 0.97 and 0.95 for the two tasks respectively. These results reflect the viability of the proposed framework as an automated means of processing dysarthric speech to achieve articulatory analyses described by DFs. The AER profile is intuitive and interpretable, for pinpointing problem areas in articulation.
1 Introduction
Dysarthria denotes a set of speech disorders related with neurological conditions and diseases such as cerebral palsy, traumatic brain injury, stroke, Parkinson’s disease, or amyotrophic lateral sclerosis, which cause disturbances in muscular control over the speech production [12]. Therefore, dysarthria may result in unnatural and unintelligible speech with unstable prosody and imprecise articulation, which engender substantial communication difficulties for dysarthric patients. It was found in phonetic analyses that dysarthric subjects with cerebral palsy had the lowest syllable-initial consonant accuracy, followed by final consonants and then vowels [43]. It was also found that for hy-pokinetic (a type of dysarthria) dysarthric recordings, there are characteristics of rough voice, reduced pitch, mono-loudness and imprecise consonants [44]. Imprecision is also found in tone production and format frequency transitions [3, 22, 27].
The underlying reason for these imprecise pronunciations is reduced muscular control of the articulatory movements. For example, articulatory movements of dysarthric subjects with Parkinson’s disease were recorded with 3-dimensional Electromagnetic Articulatography (EMA) [47], which shows reduced velocity and distance traveled in specific articulatory movements. Although EMA can help identify articulatory undershoot as a cause of articula-tory imprecision, the methodology does not offer easy accessibility to analyzing the articulatory problems for dysarthric subjects. This motivates the current investigation into articulatory analyses of dysarthric speech recordings, to gain insights into the mechanisms leading to disordered speech production. Since manual analyses of data is costly, we also aim to develop methodologies to support automatic analyses of dysarthric speech data. We choose to represent speech in terms of distinctive features (DF), which present a linguistically motivated representation that focus on the manner and place of articulation, whereby a set of compact features that essentially takes on quantized values (e.g. positive and negative) is applicable to all the languages spoken by humans. We believe that the DF representation has much to offer in terms of elucidating insights on the articulatory mechanisms that lead to how dysarthric speech deviates from normal speech. A key challenge in this investigation is the difficulty in recruiting suitable subjects for recording, and even if we do manage to recruit, recording can be difficult because the subjects’ conditions may cause them to be easily fatigued.
The rest of this paper is organized as follows: Section 2 presents the background of this study, including a literature review of previous efforts in automated processing of dysarthric speech. Since our investigation is based on speech data in Cantonese Chinese, which is the predominant language in Hong Kong and surrounding regions – we will present some background knowledge about this prominent Chinese dialect. We will also elaborate on background knowledge about distinctive features (DF). Section 3 describes a Cantonese dysarthric speech corpus, CU DYS, that we have designed and collected to support the current study. Section 4 presents the proposed notion of articula-tory error rate (AER) that can be derived from manual phonetic transcriptions of deviant articulations in dysarthric speech. Since manual transcription is a laborious and costly process, Section 5 presents our work in the development of a seq2seq model for automatic phonetic transcription. Section 6 presents results on the performance of automatic phonetic transcription, and how the phones may be mapped into a DF representation for assessment of DF error rates. Furthermore, if we compare the DF representation derived from the automatically transcribed phones, with the DF representation derived from the canonical phones (mapped from the textual prompts), we can obtain the articulatory error rate (AER) for each DF, across all DFs, which can directly reflect the articulatory deviations of dysarthric speech. Section 7 discusses how the AER profile of a speaker can potentially inform the design of intervention plans, and can be used to predict the severity levels of dysarthric speech from manual assessments. Finally, Section 8 presents the conclusions and future directions.
2 Background
2.1 Automated Processing of Dysarthric Speech
Previous work can be classified into three main areas: automatic speech recognition (ASR) of dysarthric recordings, automatic intelligibility ratings and automatic error analyses. Research in disordered speech face the challenge of recruiting the appropriate speakers to provide their speech recordings. Furthermore, due to their conditions, the subjects may become fatigued more easily and the recording session must be kept short. Consequently, sparse data is the dominant problem. Various techniques have been studied, such as speaker/data selection [9], speaker-specific or severity-specific modeling and adaptive models [2, 17, 18, 39, 50], use of meta-learning with model re-initialization [42], deep metric learning [38] and fusion of acoustic and articulatory features [51].
Another area is automatic intelligibility rating. Speech intelligibility has a high correlation with phoneme recognition accuracy [41] and character recognition result [40]. Automatic intelligibility can be estimated directly, with i-vector or x-vector, in English [29], in French [20, 33], and in Korean [19]. The Fisher vector is an alternative of i-vector for automatic intelligibility estimation [5]. Both the i-vector and Fisher vectors are difficult to be interpreted. Phonetic posteriorgrams (PPGs) is an alternative representation that can be used in intelligibility estimation. PPGs refer to the posterior probabilities of each phonetic class for a specific time in an utterance. PPGs derived from neural networks are shown to be useful in predicting the intelligibility of a voice disorder [25]. Other features, such as loudness, harmonicity, MFCCs, and jitters, have also been used to estimate intelligibility [32]. These interpretable variables may help speech therapists identify the problems of dysarthric speech.
The third area is automatic error analyses. This is useful in different applications. For example, phonetic error analyses can improve the performance of ASR [48]. Recurrent neural networks are applied to help recognize phonological features in dysarthric speech for visualization [16]. Articulatory features in dysarthric speech be recognized by an end-to-end automatic speech attribute transcription using a transformer model [24].
This study aims to develop an automatic approach that can analyze the deviant patterns of dysarthric speech with efficiency and interpretability. More specifically, we propose a phonologically-motivated framework for computational articulatory characterization of error patterns in dysarthric speech. We leverage the parsimonious description of speech segments afforded by distinctive features (DFs) [37], which have correlates in both articulatory and acoustic domains. We develop automatic speech recognition techniques to derive DFs from the speech signal, which also enables efficient analysis of a large amount of speech data. Corpus-based analysis and comparison between the DF-based representations of healthy and dysarthric speech will elucidate problematic articulatory gestures that cause errors and reduce intelligibility.
2.2 Cantonese Chinese
Cantonese Chinese is the predominant dialect used in Hong Kong, Macao and many overseas Chinese communities, spoken by over 60 million people worldwide. Cantonese is a tonal language with 6 tones, and dysarthric speech may exhibit deviant tonal patterns. As a first step, we focus on Cantonese syllable articulation. We adopt the Jyutping Cantonese syllable labeling (romanization) scheme, designed by the Linguistic Society of Hong Kong [26]. Each Chinese character is pronounced as a single base syllable with a lexical tone, e.g. “看” <translation: see> is pronounced as /hon3/. The base syllable (i.e. /hon/) is divided into two parts: an initial and a final. The initial is an optional consonant, which is also referred to as the syllable onset. The final consists of the syllable’s vowel nucleus, which may be a monophthong or a diphthong; followed by an optional consonant referred to as the syllable coda. The lexical tones range from 1 to 6. In this work, we focus on the base syllable as the unit for analysis.
2.3 Distinctive Features
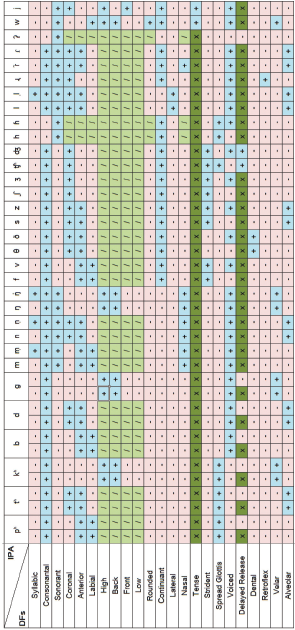
A distinctive feature (DF) is the most basic phonological unit which can differentiate between a pair of maximally close phonemes [8]. For example, the two labial phonemes [p] and [b] can be distinguished by the DF (voice), with [p] being [–voice] and [b] being [+voice]. Each phoneme can be represented in terms of a vector of DFs. There are two types of DFs - the first type are place features which specify the place of articulation, e.g. [labial] is articulated with the lips, [alveolar] is articulated with the tongue touching near the ridge of the bone behind the teeth in the upper jaw; and [velar] is articulated with the back of the tongue touching near the soft palate, etc. The second type are manner features which describe the type and degree of airflow through the vocal tract. For example, [+continuant] refers to airflow being continuous but involves partial occlusion of the airway, such as vowels, glides, liquids and fricatives. [–continuant] is where there is obstruction in of airflow, e.g. for nasals, strops and affricates. [+lateral] refers to airflow around the sides instead of over the top of the tongue, such as for the phoneme [l]. [+nasal] refers to the air flowing through the nasal cavity instead of the oral cavity. The complete list of 21 DFs adopted in this work is shown in Table 1.
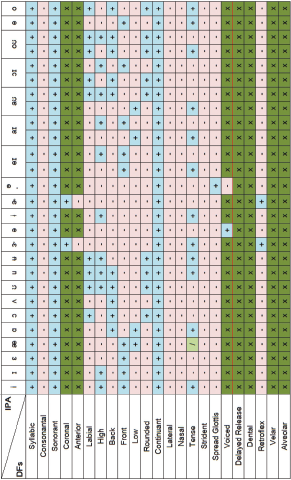
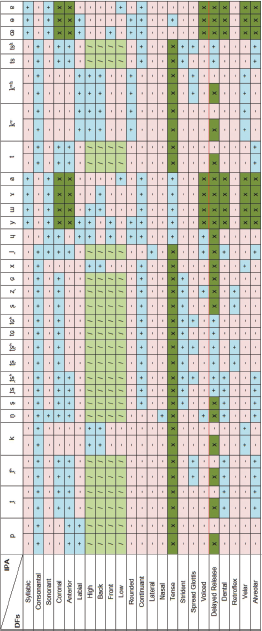
As we attempt to map phonemes into DFs, we define four possible values for the DFs: (i) positive (‘+’), referring to the fact that the DF is present, such as the example of [+continuant] mentioned above; (ii) negative (‘-’), referring to the fact that the DF is absent, such as the example of [-voice] mentioned above; (iii) unspecified (‘/’) [15], referring to the fact that the feature can be either positive or negative, e.g. the feature [high] specifying the tongue position does not have any effect on the production of the phoneme [m] and so we label it as [/high]; and (iv) irrelevant (‘x’), which expresses that the DF has no relationship with the phoneme. For example, the feature [tense] describes a greater degree of constriction with a tongue body or root, but does not play a part in the articulation of the phoneme /p/ and hence we assign the value [XTENSE].
The appendix shows the mapping form phonemes to DFs used in this work. Since a stop (or plosive) consists of both a closure and a release, the two parts are mapped to two different DF vectors. Similarly, a diphthong exhibits an articulatory change and is mapped to two different DF vectors. To maintain consistency for ease of comparison, monophthongs are represented by two identical DF vectors, indicating that there is no change in articulation within the production of the phone.
DFs have articulatory correlates and as a consequence, acoustic correlates as well [37]. In order to support our investigation of the acoustic manifestations of DFs in dysarthric speech, we designed and collected the Cantonese dysarthric speech corpus, which we named CU DYS, as described in the next section.
3 Corpora
3.1 Chinese University Cantonese Dysarthric Speech Corpus: CU DYS
We have designed and collected CU DYS, a Cantonese dysarthric speech corpus [45]. We have included three reading tasks: single word-reading (61 words), short sentence-reading (23 sentences), and passage-reading (1 passage including 4 long sentences). The collection effort is conducted in collaboration with patient organizations, speech therapists and doctors. Individuals reported to have spinocerebellar ataxia (SCA) or cerebral palsy (CP) which lead to dysarthric speech were invited to participate in this study. Altogether 27 dysarthric subjects and 14 healthy subjects have been referred and invited to join the study by providing speech recordings.
Each stimulus is recorded at least twice, with the first one intended as practice for the speaker. However, if the second recording has issues with noise, mispronunciations, missing characters or other errors, then the speaker is requested to repeat until an acceptable recording is obtained. However, the passage-reading task was only recorded twice to avoid fatigue in providing longer speech recordings. Table 2 compares the durations of the speech recordings between dysarthric and healthy control speakers. It can be seen that the durations of the dysarthric recordings are around three times that of the healthy control recordings.
3.2 Speech Severity and Manual Phonetic Transcriptions
The passage-reading task is mainly used for assessment of the severity of the dysarthric condition by speech therapists, because the task elicits more speech. Two speech therapists were invited to provide assessment based on a 5-point scale (where 1 has the highest speech intelligibility and 5 has the lowest speech intelligibility). A subject’s speech severity rating is based on the overall average of the four utterances across the scores provided by the two speech therapists.
As regards phonetic transcriptions, we recruited undergraduate students who are linguistics majors to serve as transcribers. The students are familiar with the Cantonese Jyutping system, but they do not have prior exposure to dysarthric speech – we believe this is a suitable setup for transcription because it provides the perspective of the perception of the general listener. Each utterance is transcribed by two transcribers, to allow for some degree of perceived variability in the transcription (we will elaborate on this later). They listened with a Sennheiser PC155 headset in a soundproof room and transcribe the utterances in terms of Jyutping syllables. No other information about the textual prompts is provided to the transcribers. Also, each transcriber only transcribes the speech of at most two dysarthric speakers per week, to reduce any learning effects specific to the dysarthric speakers. The transcribers were asked to listen to the utterances for as many times as they need and provide a phonetic transcription for syllable onsets, nuclei and codas [46]. In parallel, we obtain the canonical phonetic transcriptions by first mapping the text prompts into the canonical Jyutping syllable transcriptions, which are then mapped into the Jyutping syllable onsets, nuclei and codas in the canonical phonetic transcriptions [46]. To compare the manual phonetic transcriptions with the canonical phonetic transcriptions, we first perform manual alignment between the two sequences - first mapping the syllable nuclei and then the syllable onsets and codas.
3.3 Dataset Division
We divided the CU DYS corpus into training, development and testing sets, covering word-reading and sentence-reading utterances. It was challenging to recruit dysarthric speakers and our corpus had more male speakers than female speakers. We strive to include speakers of both genders in each divided dataset. The corresponding statistics are shown in Table 3.
3.4 Non-Cantonese Speech Data
In order to augment the CU DYS dataset for experimentation, we explore used some additional corpora which have phonemic transcription. Phonemic transcriptions can provide a more precise DF annotation. Therefore, we carefully select the CU SENT corpus [22] with Cantonese read speech of 80 healthy speakers, consisting of 21,600 utterances. Furthermore, dysarthric speech naturally involves deviant pronunciations which may not be found in the standard Cantonese phone set. For example, the phoneme /p/ is unvoiced [–voice] in Cantonese. If the deviant pronunciation of /p/ altered the DF to [+voice] DF, the sound cannot be found in the Cantonese phone set and will unlikely be found in a Cantonese speech corpus. However, the voiced version of /p/ is the English phoneme /b/. Hence we also augment our data by including two English corpora - (i) the TIMIT [13] training set which has 630 speakers and 6,300 utterances; and (ii) the speech recordings of healthy speakers in TORGO [36], which has 14 speakers and 11,900 utterances. This is an initial step we took in “borrowing” data from English speech recordings to support our experimentation. We believe that in the future, borrowing further across other languages would also be helpful.
As we are using both Cantonese and English data, we need to use a cross-language, machine-readable phonetic alphabet, and we have adopted SAMPA (Wells, 1997). All the Cantonese and English phoneme sets are mapped into SAMPA, devoting due consideration to articulatory contexts. For example, the Cantonese phoneme /p/ may occur in a syllable onset of coda position, and may exhibit different pronunciations. /p/ in the onset position is aspirated and is hence denoted as /p_h/, but it is unaspirated in the coda position and is denoted as /p_}/. We have adopted a total of 84 phones for Cantonese and English and these are listed in the appendix.
4 Analysis of Dysarthric, Deviant Articulations based on Manual Phonetic Transcriptions
4.1 Articulatory Error Rate (AER)
We use the articulatory error rate (AER) to represent how often a deviation occur for a specific DF based on the recordings of a dysarthric subject. Recall from Section 2.3 that the current study is based on the complete list of 21 DFs. Hence, we can compare the canonical phone transcriptions (based on the Jyutping syllable) with the manual phone transcriptions to locate the deviant pronunciations, and from those deviations we can map out the differences in DFs table lookup. Recall from the introductory section above that each DF can take on values that are basically positive or negative. However, if the subject misses a phone, then the DFs of the canonical phone will be considered to have mapped to the DF value of NULL. Conversely, if the speaker inserts a phone, then the DFs of the “non-existent canonical phone” will be treated as NULL values that are then mapped to the feature values of the inserted phone. Hence, we have three types of DF errors based on how features are replaced, namely:
Substitution Error (S): + →-, → +, + → x, → x
Deletion Error (D): + → NULL, - → NULL
Insertion Error (I): NULL → +, NULL → -
As explained above, for each DF, we can compute the percentage of deviations occurring for each DF to obtain its AER. For example, if a subject’s articulation shows that 20% of the [round] feature differs from the canonical production, then AER for [round] will be 20%. Let i be the index of the DF across the complete set of 21 features. Hence, each phone uttered by a subject may be characterized by a vector of DFs, if we examine all the recordings of a given speaker, we can then compute the articulatory error rate (AER) for each DF i, defined by Equation 1:
where the numerator is the sum of all the error types, and Ti in the denominator denotes all the occurrences of the values of DF i = 1,2 … 21
Recall that each utterance is transcribed by two individuals. Our calculations can accommodate cases where there may be different transcriptions. We consider the utterance to be spoken twice when calculating AERs. For example, assuming that there is a segment for which a DF is positive. Then, if one transcriber listens and considers that a given DF is positive for that segment, but the other transcription regards that the DF is negative, the AER of the specific DF will be 0.5.
4.2 Analyses
As explained above, with canonical phones and manually transcribed phones, we calculate the AERs for each DF and for all dysarthric subjects in CU DYS. Results are shown in Table 4.
For the word-reading task, AERs range from 8.2% to 20.8% with a mean of 13.7%. DFs with the highest error rates are related to consonants, namely [anterior] (AER: 20.8%), [coronal] (AER: 20.0%), [alveolar] (AER: 19.8%) and [velar] (AER: 19.0%). DFs with the lowest error rates are [syllabic] (AER: 8.2%), [delayed release] (AER: 8.6%), and [lateral] (AER: 9.4%). It is noted that [syllabic] distinguishes between vowels and consonants and the clear distinction brings a low AER. For [delayed release], the DF is positive only for /c/ and /z/. For [lateral], the DF is positive only for Hence [delayed release] and [lateral] is mostly negative and this may also lead to fewer errors. The sample standard deviation of the DF error rates ranges from [syllabic] (SD: 9.4%) to [anterior] (SD: 20.4%).
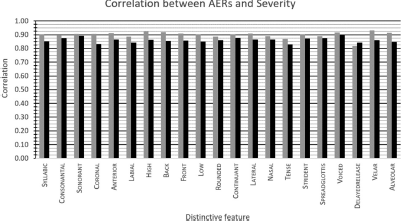
We also conducted analysis between AERs of DFs against the severity of the condition. Results are shown in Figure 1. We observe that there is high correlation between AERs and severity levels across the 21 DFs, with the average at 0.90 in the word-reading task.
For the sentence-reading task, AERs range from 7.7% to 17.7% with a mean of 11.6%. The values are generally lower in sentence-reading than in the word-reading task. The error patterns are consistent, i.e., DFs with the highest error rates are also [anterior] (AER:17.7%), [coronal] (AER:16.3%), and [alveolar] (AER:16.6%). Also, the DFs with the lowest error rates are [syllabic] (AER:7.3%), [delayed release] (AER:8.3%), and [lateral] (AER: 8.6%). The lowest standard deviation is also [syllabic] (AER:7.3%), and the highest is also [anterior] (AER:17.7%). The sample standard deviation of the DF error rates ranges from [tense] (SD: 9.3%) to [anterior] (SD: 20%). Similar to the results of the word-reading task, we observe that the AERs of the sentence reading task are highliy correlated with the severity levels, averaging at 0.86 over all the 21 DFs (please see Figure 1).
5 Acquiring Deviant Articulations based on Automatic Transcriptions
The use of manual phonetic transcriptions to obtain articulatory errors (AERs) is time-consuming and difficult to apply at scale. In this section, we present our study in the development of DF detectors based on automatically transcribed phones using a phone recognizer.
5.1 Sequence-to-sequence (Seq2Seq) Model Trained on Healthy Speech Data
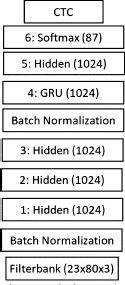
Manual phonetic transcription can be considered a sequence of phonetic labels corresponding to a sequence of speech signal. The two sequences often have different sequence lengths, hence, step-wise mapping between sequences is inapplicable. We utilize the sequence-to-sequence (Seq2Seq) model to map the sequence of acoustic frames extracted from the speech signal to the sequence of phonetic labels. In order to model the temporal dynamics, the recurrent neural networks (RNNs) [35] are used to construct the encoder of the seq2seq model. The gated recurrent unit (GRU)-based RNN is adopted [7]. Upon the RNN-based encoder, the connectionist temporal classification (CTC) [14] loss function is used to tackle the alignment between the input and output sequences, as shown in Figure 2. More specifically, we use an 80-dimensional filterbank feature with first- and second-order derivatives as input features to the encoder. The filterbank features are extracted using a 25 ms window with a window shift of 10 ms. 23 consecutive frames (the 11 previous frames, the current and the next 11 frames) are used and downsampled to a 30ms frame rate [6]. Batch normalization is applied to the input features. Three fully-connected layers of 1024 units with rectified linear activations are used. Batch normalization is applied again before the fully-connected layer outputs are fed to the bidirectional GRU layer with 1024 cells, followed by one fully-connected layer with 1024 units. The output layer is a softmax layer that predicts 87 classes (84 phones + 1 silence + 1 utterance boundary + 1 blank label).
The phone labels include both Cantonese and English phones because we found that using both language corpora can improve the ASR performance as discussed in the next paragraph. The blank label is used by the CTC loss to enable alignment between input and output sequences [14].
The training set consists of the CUSENT corpus (20.4 hours) [22] and the healthy speech part of the TORGO corpus (21 hours) [36], the TIMIT corpus (4.2 hours) [13], and the training set (including both the word-reading task and the sentence-reading task) of healthy speech in the CU DYS corpus (Section 3.3). We adopt an early stopping strategy [31] which terminates the training process when there is no further improvement of phone error rate (PER) on the CU DYS healthy speech development set within last N epochs (N = 20). Stochastic gradient descent is used as the optimizer [34]. The PER evaluated on the healthy speech of CU DYS testing set is 7.6%. If we only use the Cantonese corpora (i.e., CUSENT and CU DYS) without the extra English corpora in training, the PER is increased to 10.8%.
5.2 Phonetic Decoding of Dysarthric Speech
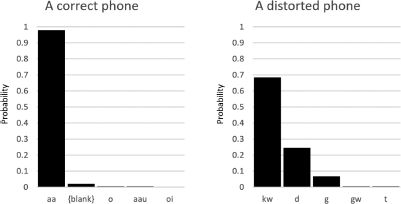
The trained seq2seq model is used to perform phonetic decoding of dysarthric speech. For a correctly pronounced phone, the probability outputs show a sharp distribution, as illustrated in the left plot in Figure 3, where the segment has the same label of /aa/ for both the canonical phone and the manually transcribed phone. In automatic phone transcription, the label /aa/ receives the highest probability (0.98), in stark contrast with the second highest probability (0.02) for the blank label. However, for the case of a deviant production in dysarthric speech, as illustrated in the right plot of Figure 3, there is much more uncertainty - the label /kw/ receives the highest probability (0.69), and the label /d/ receives the second highest probability (0.25). For this particular segment, the canonical label is /s/ and there is disagreement between the two manually transcribed labels (namely, /b/ and /d/). We also noted that for dysarthric productions, the manually transcribed label(s) often appear(s) among the top labels with highest probability. Based on this observation, we further align two sequences of phonetic labels (i.e. the canonical phonetic labels, and the one from seq2seq model) in the next section.
5.3 Phonetic Alignment for Computing AERs
The recognized phonetic labels output by the seq2seq model need to align with the canonical phonetic labels for calculation of the AERs. Since non-Cantonese corpora (i.e. English corpora) are used in model training, it is possible that the recognizer may output a non-Cantonese phone label for a frame because it received the highest probability. However, the manual transcriptions (treated as the ground truth) do not include any non-Cantonese phones. Hence, in preparation for the alignment, we need to identify each recognized non-Cantonese phone label and map it to the “back-off” Cantonese phone label, which has the least number of differing DF values. This mapping process leads us to assign the probability of the “back-off” phone to be the sum of the probability of the non-Cantonese phone label and the probability of the replacement (back-off) Cantonese phone label. Specifically, let α denote the non-Cantonese phone label with the highest probability for a frame; and β denote Cantonese phone label closest to α in terms of DFs; and let p[ϕ] denote the probability of the phone ϕ. Then, the mapping due to the “back-off” phone β will lead us to updated probability p′(β) for the recognized phone label:
Another point to note is that consecutive acoustic frames may often be repeated as they belong to the same phone segment. For these repeating phone labels in successive frames, we assign the {blank} label. For example, given three consecutive acoustic frames that belong to the same phone segment /w/, if the recognition outputs are the phone labels /w/-/w/-/w/, the procedure will relabel the repeated /w/ so that the sequence becomes /w/-{blank}-{blank}.
As a consequence of the above procedures, we have two sequences of phonetic labels that will be aligned using dynamic programming [1]. The two sequences are: (i) the sequence of canonical phones c1, c2,…,cj,… ,cM; where M is the length of the sequence of canonical phones in the utterance; and (ii) the sequence of frame f1, f2,…, fk,… fN ; where N is the total number of frames. The similarity between a pair of aligned phones cj and γk∈ Γ in the frame fk, may be the proportion of their common DFs values, but we may also consider a more refined “similarity” based on the frequencies of errors observed in the CU DYS training set. For example, in the case of a canonical phone bigram /a n/, we observe that the substitution of /n/ with /ng/ is much more common than with the phone /m/ (even though all are nasal phones). We believe that is important to capture such phenomenon in the similarity metric, and hence it is useful to consider the frequency of substitution errors as a reflection of similarity. For a given canonical phone pair (cj_1,cj), if cj is substituted with γk very frequently, then it suggests that they are more similar in the given context and are thus harder to discern clearly. Therefore, we propose a similarity term based on the relative frequencies of corresponding substitutions found in the training set, which is used as a correction factor for the probability of the recognized phoneme label γk– and this is used as the weighting factor for the DF similarity during the alignment by dynamic programming (please see Equation 3).
The DF similarity between cj and γk is the proportion of DF with common values between their DF vectors. If there is an insertion or deletion, then the DF distance is 42 (i.e., 21 DFs for each of 2 vectors as mentioned in Section 2.2). If recognition produces a blank output, the DF distance is arbitrarily set to (21 DFs * 1.5), to be lower than the cost of insertion/deletion.
6 Comparing Articulatory Analyses based on Manual and Automatic Transcriptions
Thus far, we have described our framework for articuatory analyses of dysarthric speech through the use of DFs, whose values are obtained from the comparison between the canonical phonetic transcription of text prompts and the manual phonetic transcription of the spoken utterances. This section aims to examine the feasibility of replacing manual phonetic transcription with automatic phonetic transcription.
6.1 Phone Error Rates from Recognition
When comparing manually transcribed phones and automatically transcribed (i.e. recognized) phones, the PER is calculated as:
where Sp, Dp, Ip, and Tp, are the counts of substitutions, deletions, insertions, and total number of phones respectively.
We consider a phone error to have occurred if the recognized phone is different from the two manually transcribed phones for the same speech segment. PERs of the word-reading task is 33.0%, and the sentence-reading task is 35.6%. The performance is similar to other low-resource phone recognition systems [23].
6.2 DF Error Rates from PER
Since automatic phone transcription will inevitably have recognition errors, these areas will translate into DF errors during articulatory analyses. As mentioned earlier, there are 21 DFs in total and each phone is mapped to two DF vectors to capture possible dynamics. Therefore, in comparing an automatically transcribed phone with a manually transcribed phone, the maximum distance between their DF vectors is 42.
Analysis shows that misrecognized phones tend to be close counterparts of the canonical phone and hence their DF vectors tend to have more values in common. For example, confusable vowels like /a/ and /aa/ differ only in the DF [tense]; confusable nasals /m/ and /n/ differ in the 3 DFs [coronal], [labial] and [alveolar].
The range of DF error rates (as a consequence of phonetic misrecognition) for word-reading tasks range from a minimum of 12.1% for [lateral] to 17.7% for [high], with an average DF error rate of 14.6%. For sentence-reading tasks, the DF error rates range from a minimum of 13.7% for [spread glottis] to 19.7% for [high], with an average of 16.4%. Details are shown in Table 5(a).
6.3 Root Mean Squared Errors (RMSE) of AER
Recall from Section 4.1 that we can derive the DF vectors from the manually transcribed phones of a subject’s read speech, and compare then with the DF vectors derived from the canonical phones of the textual prompts for reading. This comparison is used to compute the AER (articulatory error rate) for each DF, to characterize the deviant articulations in the subject’s recordings. Since manual phonetic transcription is laborious, it will be more efficient if we can use automatically transcribed phones in place of manually transcribed phones. Therefore, it will be useful to examine the AERs obtained for the full set of DFs based on manual phonetic transcriptions and compare them with the automatic transcriptions. This comparison is done for each DF, and for each subject we obtain the squared error, then we compute the mean squared error across all testing subjects, and finally the square root to obtain the RMSE (root mean squared error). Results are shown in Table 5(b). In the word-reading task, RMSE values range from 0.029 (for the DF [lateral]) to 0.205 (for the DF [delayed release]) with a mean of 0.053. For the sentence reading task, the range of RMSE is from 0.046 (for [lateral]) to 0.300 (for [delayed release]) with a mean of 0.085. These are new results in the current using the seq2seq model for phone recognition first, before mapping the phones to the DF representations. Our previous approach (reported in [46]) used multi-layered perceptrons (MLP) for direct DF recognition, and reported only results on correlation but not RMSE. The current work compares both approaches using RMSE and obtains superior improvements (from 26.7% to 51.5%) in reduction of RMSE. From Table 5, We observe that [delayed release] presents an outlier. The reason is that this DF is only applicable to /c/ (e.g. /ce/ “車” <translation: car>) or /z/, with the DF values in “+”. When the canonical phone is /c/ and the manual transcribed phone is also /c/, then it is no error of [delayed release]. However, the recognizer misrecognized the phone as /s/, or /h/, which [delayed release] is “x”, so there all become articulatory errors.
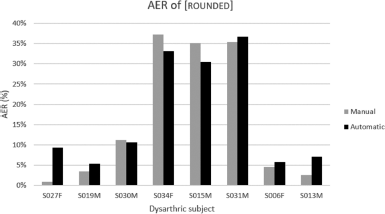
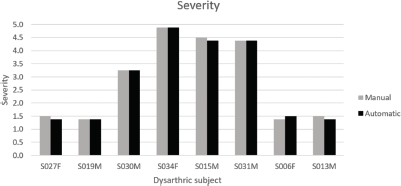
In addition to computing RMSE, we also wish to compute the correlation, for each DF, between the AERs obtained from manual versus automatic phonetic transcription across all testing speakers. Results are shown in Table 5(c). For the word-reading task, the mean correlation is 0.97. For the sentence-reading task, the mean correlation is 0.95. As an illustration, we can visualize in Figure 4 the AERs of the feature [rounded] across subjects, where the mean correlation is at 0.98. These results based on DFs obtained from seq2seq phone recognition are also significantly improved, when compared with our previous approach based on direct DF recognition using MLP [46], which obtained 0.90 and 0.91 for word- and sentence-reading tasks.
Overall, with the lower RMSE and high correlation values, we establish that the use of automatic phonetic transcriptions for DF-based analysis is a viable alternative to the use of manual phonetic transcriptions.
7 Applications in Analysis of Dysarthric Speech
This section discusses potential applications of DF-based AERs for the analyses of dysarthric speech. In this section, the AERs are derived from automatic phonetic transcriptions.
7.1 Comparing Healthy and Dysarthric Speech using AERs
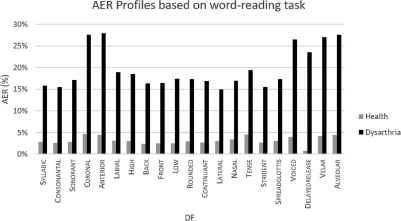
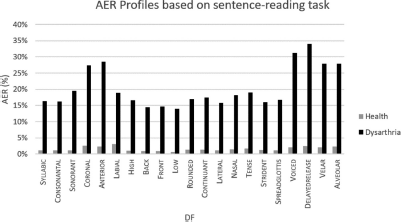
Average AERs for each DF, computed from the recordings of healthy and dysarthric subjects in the CU DYS test set are shown in Figure 5 (for word-reading task) and Figure 6 (for sentence-reading task). Healthy subjects have lower AERs in all 21 DFs, compared with dysarthric subjects. In the word-reading task, the range of AERs from healthy subjects is from 0.8% (for [DELAYED RELEASE]) to 4.7% (for [coronal]), compared with corresponding figures in the range for dysarthric subjects, i.e., from 15.0% (for [lateral]) to 27.9% (for [anterior]) in the word-reading task. A similar trend is observed for the sentence-reading task – ranging from 0.7% (for [low]) to 3.1% (for [labial]) from healthy subjects, 14.0% in [low] to 34.1% in [delayed release] from dysarthric subjects.
The patterns of AERs across the two tasks are also similar. DFs with the AERs higher than 25% include [coronal], [anterior], [voiced], [velar], and [alveolar]; while the corresponding AERs in healthy speech are lower than 5%. All [coronal], [velar], and [alveolar] are related to articulation with the tongue in consonants. This finding is consistent with Whitehill and Ciocca [43], which also indicates that consonants have lower accuracies than vowels.
7.2 AER Profile of Individual Dysarthric Subject
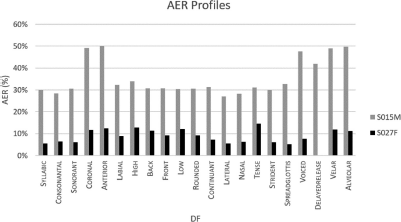
Figure 7 illustrates the AER profiles of two dysarthric subjects (S015M, male with cerebral palsy; and S027F, female with spinocerebellar ataxia) based on the word-reading task. The average AER of S015M is 35.5%. He has difficulties pronouncing consonants like [coronal] (49.3%), [anterior] (50.0%), [velar] (49.0%), and [alveolar] (49.7%). The average AER of the other dysarthric subject, S027F, is 8.7%. S027F has difficulties in pronouncing vowels such as [high] (12.9%), [tense] (14.6%). Distinct AER profiles may inform the design of more personalized articulation practice.
7.3 Relationship between AERs and Speech Severity Levels
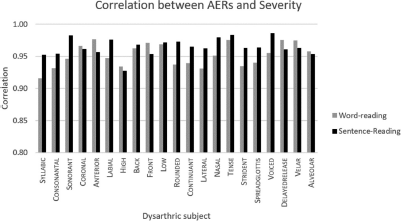
Figure 8 shows the correlations between the automatically derived AERs and speech severity levels based on the test set for both tasks. All the correlations are higher than 0.9 - with an average of 0.95 (standard deviation 0.02) in the word-reading task, and 0.96 (standard deviation 0.02) in the sentence-reading task. Among the DFs, [tense] has the highest correlations for both tasks, which may potentially offer some indication of severity.
Next, we explored the possibility of estimating the speech severity level based on AERs based on the data from a subject. We applied Random Model Trees [30] for regression, implemented with Weka [11]. Modeling is based on the training and development data sets of CU DYS. Estimation of severity level based on AER is conducted on the test set. An illustration is provided in Figure 9 based on the word-reading task. The correlation between estimated severity levels and clinician-assessed severity levels is 0.998 (with RMSE 0.085) for the word-reading task; and 0.921 (with RMSE 0.598) for the sentence-reading task.
8 Conclusions and Future Work
This paper presents our approach in the use of distinctive features (DFs) as descriptors of articulation as a representation of dysarthric speech (i.e., a type of disordered speech) that can reflect its deviations from normal speech. The main contribution of this study is unlocking the potential research area of articulatory analyses in dysarthria through the use of a distinctive feature (DF) representation. The paper demonstrates various articulatory analyses, including the identification of potential articulatory problems, profiling personal articulatory problems, and using the articulatory problems to estimate severity.
The study is conducted using our home-grown speech corpus known as CU DYS. We need to overcome the challenge of recruiting dysarthric speakers who are willing and capable of attending speech recording sessions. The linguistically-motivated DF representation is mapped from the phonetic representation obtained through manual transcription, to obtain a DF vector representation for each phone. Human perceptual variability between the two transcribers is accommodated through treating the two transcriptions as two phone occurrences. To alleviate the costly process of manual transcription, we have also developed a seq2seq model for automatic phonetic recongition. Any phonetic transcription errors from automatic recognition will lead to DF errors. While the PER (phone error rates) are at 33.0% and 35.6% respectively for the word-reading and sentence-reading tasks, the average DF error rates are at 14.6% and 16.4% respectively.
Next, we used the DF representation obtained from automatic phonetic transcriptions and compare them with those obtained from the canonical phonetic labels mapped from the text prompts. This comparison leads to the AERs (articulatory error rates) and we found that the RMSE is low at 0.053 with a high correlation at 0.97 for the word-reading task, and the corresponding values for the sentence reading task are 0.085 (RMSE) and 0.95 (correlation). These low RMSE and high positive correlations demonstrate the feasibility of automatic DF-based analyses for identifying articulatory problems in dysarthric speech. Automatic Speech Recognition (ASR) technologies have been proposed for speech analyses, e.g., in Xiong et al.[48], and phone posteriors are often used to support severity analysis [25]. In this work, we present the use of AER (articulatory error rates) derived from the automatic phone transcriptions, to elucidate the articulatory difficulties shown in the dysarthric speech signal from individual subjects. The AER profile of a subject may potentially help inform the design of intervention plans.
Future work will be devoted to further improvement of phone recognition performance to lower DF error rates and AER. We note that previous efforts in neurological research and clinical practice have been dedicated to categorizing speech characteristics and underlying neuro-pathophysiology of dysarthria [10] because the type of dysarthria can provide a clue to identify the causal disorder and suitable treatment plans [28, 49]. It has also been shown that phonological features can reveal some dysarthria types [4]. We believe that it will be useful to investigate the use of the AER profiles to inform categorization of dysarthric type, as well as the design of personalized intervention plans for dysarthric subjects.
The authors would like to thank Professor Edwin Chan, Professor Patrick Wong, Professor Raymond Tong, and Mr. Borislav Dzodzo from The Chinese University of Hong Kong for their referral and comments, and Ms. Wing-Sum Yeung for her assistance in data collection. This research is partially sponsored by a grant from the Hong Kong SAR Government General Research Fund (Reference No. GRF415513), and Microsoft Research Asia Regional Seed Grant.