Early diagnosis of Alzheimer’s disease (AD) remains a significant challenge in modern healthcare. Positron emission tomography (PET) imaging combined with machine learning offers a powerful framework for this task, where brain atlases play a critical role in feature extraction. Although predefined atlases are widely used, they may provide suboptimal representations. This study introduces the novel PET-driven C-Atlas for AD diagnosis. Unlike conventional predefined brain atlases derived from healthy-control magnetic resonance imaging data, the C-Atlas is specifically designed for AD diagnosis and directly captures disease-relevant metabolic patterns from PET images. The C-Atlas learning consists of two phases: coefficient learning and atlas learning. In the first phase, PET images together with their corresponding labels (AD, MCI, NC) are used to train a linear support vector machine (SVM) classifier. The coefficients learned by SVM are subsequently employed in the second phase, where the simple linear iterative clustering algorithm is applied to learn the proposed atlas. Experimental results demonstrate that C-Atlas consistently outperforms predefined atlases. In addition, its construction process exhibits stable performance, and structural analysis reveals a moderate relationship between atlas organization and classification outcomes. Its superior and robust performance highlight its potential as a useful brain atlas and a promising tool for advancing early AD diagnosis and related neuroimaging applications.
1. Introduction
Alzheimer’s disease (AD) is a progressive and irreversible neurodegenerative disorder, considered the most common cause of dementia in elderly populations (Patterson, 2018). As of 2024, over 55 million individuals were globally estimated to be living with dementia, a number projected to rise to 152 million by 2050 due to global population aging, especially with very fast aging rates occurring in low- and middle-income countries (Patterson, 2018; World Health Organization, 2024). Therefore, accurate early diagnosis of AD has become increasingly essential and critical, not only to enable timely therapeutic intervention but also to provide reliable prognostic insights.
In clinical practice, AD diagnosis involves a multifaceted approach, combining cognitive assessments, patient history and imaging-based biomarkers (Juganavar et al., 2023; Hojjati et al., 2024). Among neuroimaging techniques, fluorodeoxyglucose positron emission tomography (FDG-PET) has emerged as an effective tool for early detecting metabolic changes in the brain associated with AD (Nestor et al., 2003; Petrie et al., 2009; Jagust et al., 2010; Ota et al., 2015; Zhang et al., 2022). FDG-PET measures glucose uptake in neurons and glial cells, offering a direct view into the functional state of the brain (Verger and Guedj, 2018). This makes it well-suited for identifying subtle abnormalities even before structural atrophy becomes apparent in the brain.
AD is associated with reduced cerebral glucose metabolism. In a longitudinal study of subjects followed from normal cognition to pathologically verified AD, the FDG-PET scans of subjects who received a diagnosis of definite AD were reported to indicate a progression of reduction in the cerebral metabolic rate for glucose (CMRglc) from the hippocampus to the parietotemporal and posterior cingulate cortices (Mosconi et al., 2009). Beyond such whole-brain CMRglc measures, many studies have further exploited region-specific metabolic information derived from FDG-PET. For instance, empirically predefined regions of interest (ROIs) have been used to characterize and track metabolic declines in probable AD and amnestic mild cognitive impairment (MCI) (Chen et al., 2010). At the same time, other works coregister FDG-PET onto structural magnetic resonance imaging (MRI) and quantify regional uptake within MRI-derived ROIs (Bailly et al., 2015; Schöll et al., 2014). These observations indicate that FDG-PET conveys not only a global hypometabolic shift but also quantitative regional differences that are informative for AD. Therefore, we are motivated to directly capture quantitative regional metabolic patterns from PET, under the hypothesis that a brain representation built from these patterns can support more accurate AD diagnosis.
Recent advancements in machine learning have opened new avenues for automated AD diagnosis using FDG-PET images (Alberdi et al., 2016). Most existing studies have used either voxel-based (Kerrouche et al., 2006; Desgranges et al., 2007; Cabral et al., 2015; Hinrichs et al., 2009) or region-based (Ota et al., 2015; Gray et al., 2012; Pagani et al., 2015; Garali et al., 2018) approaches to extract features from FDG-PET images. Among them, the region-based approach, wherein the brain is segmented into meaningful ROIs, is generally preferred because it can reduce dimensionality and improve robustness to noise. This segmentation often relies on predefined anatomical atlases such as Automated Anatomical Labeling (AAL) (Nathalie et al., 2002), LONI Probabilistic Brain Atlas (LPBA40) (Shattuck et al., 2008), and Schaefer Atlas (Schaefer et al., 2018), which are grounded in healthy anatomy or cytoarchitecture. See Section 2 for their details.
However, predefined brain atlases suffer from some limitations when applied to disease-specific or modality-specific settings. These atlases do not always align with the functional or pathological heterogeneity seen in diseases like AD (Arslan et al., 2018). This limitation arises because these atlases often divide the brain into fixed regions, which may be much larger or smaller than actual AD-related regions. In addition, most of them were derived from MRI images of healthy subjects (Craddock et al., 2012; de Reus and van den Heuvel, 2013; Thirion et al., 2014) and, thus, may not reflect the altered structure and function found in FDG-PET images of diseased brains (Eickhoff et al., 2018). Therefore, extracting features using these atlases can lead to suboptimal representations and poorer classification performance. Accordingly, they are often only suitable for general research purposes and less effective in reflecting relevant information about certain diseases (Arslan et al., 2018). Meanwhile, building a new functional brain atlas adapted to specific subjects and/or certain diseases is a potential approach (Wang et al., 2021). This kind of atlas can capture the most relevant information about the target disease as well as observe functional changes from subject to subject within and between stages associated with the disease.
In the context of Alzheimer’s diagnosis, developing disease-specific brain maps is essential for effective brain parcellation and accurate characterization of disease-related alterations. In the literature, numerous studies have investigated various approaches to brain mapping, including methods based on random criteria (Hagmann et al., 2008; Zalesky et al., 2010), structural properties (Zilles and Amunts, 2010; Glasser and Van Essen, 2011), and inter-regional connectivity information (Craddock et al., 2012; Thirion et al., 2014). A broad range of techniques has been employed, such as k-means clustering, Gaussian mixture models, and spectral clustering (see (Arslan et al., 2018) for a comprehensive review). Although these approaches have shown promising results in constructing brain atlases, they often face compatibility limitations when applied to feature extraction from PET images for AD diagnosis. In particular, the mismatch between the principles underlying atlas construction and disease-specific pathological patterns may reduce their effectiveness, leading to several challenges.
Most existing atlases are constructed from MRI data of healthy control subjects (Eickhoff et al., 2018), with many studies specifically focusing on resting-state functional MRI (rs-fMRI) data (Craddock et al., 2012; de Reus and van den Heuvel, 2013; Thirion et al., 2014). Consequently, these atlases may be suboptimal for extracting informative features from brain regions affected by neurodegeneration. In addition, PET and MRI differ substantially in their imaging mechanisms and the types of biological information they capture. Therefore, applying atlases derived from MRI data to PET-based feature extraction may not be appropriate. Furthermore, because most existing atlas-construction methods rely solely on healthy control data, they fail to fully exploit discriminative information across different subject groups, such as patients with and without AD. In contrast, we hypothesize that incorporating information from multiple patient groups is crucial for constructing disease-adapted brain maps that better capture pathological patterns associated with specific neurological disorders.
Therefore, to address the limitations of existing approaches and to validate our hypothesis, we propose a novel brain-mapping framework for AD diagnosis using FDG-PET images in this paper. The proposed atlas can be regarded as a data-driven representation designed to complement rather than replace conventional brain atlases. In particular, our main contributions are summarized as follows [1].
First, we introduce an effective AD-driven brain-mapping framework, termed C-Atlas, which provides a disease-adaptive solution for feature extraction from PET images. The proposed framework integrates the simple linear iterative clustering (SLIC) algorithm for image segmentation and a support vector machine (SVM) classifier as a supervision-guided criterion for atlas construction. Unlike classical predefined brain atlases derived from healthy-control MRI data, the C-Atlas is specifically designed for AD diagnosis and directly captures disease-relevant metabolic patterns from PET images. Moreover, the C-Atlas enhances interpretability by ranking brain regions according to their contribution to AD classification, thereby providing clinically meaningful insights and helping radiologists focus on the brain regions most relevant to AD.
Second, we conduct a comprehensive evaluation to assess the effectiveness of the C-Atlas. Specifically, we perform extensive robustness and stability analyses by examining the consistency of the C-Atlas parcellations across different random data splits and benchmarking them against established atlases at comparable scales. We further provide an in-depth interpretability analysis through region-level feature ranking to identify the ROIs that contribute most significantly to classification performance. In addition, we compare the spatial characteristics of these highly ranked regions with those of the established AAL Atlas, providing insights into the neuroanatomical relevance of C-Atlas regions.
This work extends our earlier conference paper (Tuan et al., 2022) by providing a more systematic, comprehensive, and consolidated learning and evaluation framework of the C-Atlas as well as experimental results. Compared with the conference version, the journal extension substantially enhances the C-Atlas construction pipeline through the integration of linear SVM-based discriminative learning and the maskSLIC clustering method. Building upon this improved framework, we further introduce an enhanced variant, termed C-Atlas+, which achieves better performance. In addition, we introduce a comprehensive evaluation framework for assessing the effectiveness of brain atlases in general, and the proposed C-Atlas in particular. To further demonstrate the consistency of the proposed framework, we conduct extensive robustness and stability analyses by comparing the C-Atlas with the Schaefer Atlas at matched spatial scales. This journal version also includes detailed feature extraction and brain region ranking analyses, providing deeper insights into the contributions of specific brain regions to AD. Furthermore, we investigate the structural differences between the top regions identified by the C-Atlas and those defined by the AAL Atlas, to explain the advantages of the proposed atlas better. Beyond the methodological contributions, we provide a more comprehensive overview of widely used predefined brain atlases, highlighting their main characteristics and limitations. Finally, the manuscript substantially expands the discussion on data considerations, methodological aspects, disease-specific brain regions, potential applications, and several open research challenges.
The remainder of this paper is organized as follows. Section 2 discusses predefined brain atlases. Section 3 describes our C-Atlas methodology. Section 4 presents a comprehensive framework for evaluating the C-Atlas for AD tasks. Section 5 presents the data sets and experimental results. Section 6 provides further discussions, followed by conclusions and future works in Section 7.
2. Related works
The choice of a brain atlas has a significant impact on the outcomes of brain imaging analyses. This effect has been observed in studies involving FDG-PET (Tuan et al., 2025) and AD analysis (Tuan et al., 2024). In the literature, several predefined brain atlases have been proposed (Nowinski, 2021). In the following, we briefly review several well-established brain atlases and discuss their main advantages and limitations. See Table 1 for a summary.
One of the most widely used atlases in neuroimaging is the Automated Anatomical Labeling (AAL) atlas, a standardized anatomical brain template introduced by (Nathalie et al., 2002). The AAL Atlas divides the brain into labeled ROIs, enabling researchers to summarize neuroimaging signals (e.g., fMRI, EEG, and PET) within each region rather than analyzing data voxel-by-voxel. Subsequently, two updated versions, AAL2 (Rolls et al., 2015) and AAL3 (Rolls et al., 2020), were developed to include additional brain regions that were not previously defined but are relevant to many neuroimaging studies. However, the AAL Atlas may have limited population generalizability because it was derived from a single Montreal Neurological Institute (MNI) brain template. Furthermore, anatomical gyri do not necessarily correspond to functional networks or connectivity patterns, and some large regions may encompass multiple distinct functional subregions.
The LONI Probabilistic Brain Atlas (LPBA40) is a population-based probabilistic anatomical brain atlas developed by the Laboratory of Neuro Imaging (Shattuck et al., 2008). Specifically, it was constructed from high-resolution T1-weighted MRI scans of 40 healthy adult volunteers, enabling the atlas to capture inter-subject anatomical variability across the population. LPBA40 provides 56 manually delineated cortical and subcortical anatomical regions, together with probabilistic tissue maps for gray matter (GM), white matter (WM), and cerebrospinal fluid (CSF), maximum-likelihood label maps, and gray-matter-masked probability maps. Despite these advantages, LPBA40 also has several limitations. Compared with more recent fine-grained atlases such as the Schaefer Atlas, it contains a relatively small number of ROIs and therefore provides lower spatial resolution. In addition, its parcellation is primarily anatomy-based rather than functionally driven, which may limit its suitability for functional connectivity and network neuroscience studies.
The Schaefer Atlas is a widely used functional brain parcellation atlas designed for large-scale functional neuroimaging analysis (Schaefer et al., 2018). Unlike anatomically defined atlases such as AAL or LPBA40, the Schaefer Atlas is primarily based on functional connectivity patterns across the cerebral cortex. It partitions the cortex into spatially contiguous ROIs using resting-state fMRI data collected from a large population of healthy subjects. Consequently, the atlas offers several advantages, including multiple spatial resolutions, functionally meaningful parcellations, compatibility with modern connectomics pipelines, and strong performance in resting-state fMRI studies. Despite these strengths, the Schaefer Atlas also has limitations. It mainly focuses on the cerebral cortex and does not provide detailed subcortical parcellations. In addition, high-resolution versions may increase computational complexity and sensitivity to noise. Furthermore, because the atlas is derived from resting-state fMRI data, it may not fully generalize to task-specific brain activity or to populations with specific neurological disorders.
Apart from the three brain atlases discussed above, several other notable atlases have also been proposed. The Talairach Atlas is one of the earliest and most influential stereotactic brain atlases in neuroimaging (Lancaster et al., 2000). It was constructed from postmortem anatomical sections of a single 60-year-old female subject, whose brain was manually segmented and mapped into a proportional stereotactic space. The Talairach Atlas laid the foundation for modern neuroimaging localization systems, although it has now largely been replaced by MNI-based population templates.
Desikan–Killiany (DK) Atlas is one of the most widely used cortical anatomical atlases in structural MRI and neuroimaging (Desikan et al., 2006). The DK Atlas provides an automated cortical parcellation based on gyral anatomy, sulcal landmarks, and cortical folding patterns. It was developed using manually labeled MRI data sets, cortical surface reconstruction, and gyral pattern identification techniques. Since the resulting regions correspond to well-known gyri, sulci, and anatomical landmarks, the atlas offers good clinical interpretability. However, the atlas contains only 68 cortical ROIs, which may be insufficient for fine-scale network analysis and precision connectomics. In addition, because the DK Atlas is primarily anatomically defined, it is less optimized for functional connectivity and large-scale functional network studies.
The Brainnetome Atlas is a modern connectivity-based brain atlas developed to provide a fine-grained parcellation of the human brain using both structural and functional connectivity information (Fan et al., 2016). It was proposed as an alternative to traditional anatomy-based atlases such as AAL by incorporating connectivity patterns into the definition of brain regions. As a result, the atlas provides improved functional specificity, since connectivity-defined regions are often more homogeneous than anatomy-based ROIs. However, its application typically requires more complex preprocessing pipelines, including accurate image registration and diffusion MRI processing. Furthermore, connectivity-defined regions may be less intuitive for clinical interpretation compared with anatomically defined regions.
The Julich Brain Atlas is a probabilistic cytoarchitectonic brain atlas (Amunts et al., 2020), in which brain regions are defined according to their cellular composition and microscopic tissue structure. Consequently, the atlas provides biologically meaningful cortical boundaries while also capturing anatomical variability across individuals. Nevertheless, cytoarchitectonic regions are generally less intuitive than anatomical gyri, which may complicate their interpretation in clinical studies. In addition, the construction and application of the Julich Brain Atlas involve substantial computational complexity, as probabilistic maps require advanced registration techniques and careful thresholding procedures.
The Human Connectome Project Multi-Modal Parcellation (HCP-MMP1.0) is one of the most influential modern brain atlases in neuroimaging and connectomics (Matthew et al., 2016). Unlike traditional atlases that rely only on anatomy, cytoarchitecture, or functional connectivity, HCP-MMP1.0 combines multiple imaging modalities simultaneously to define cortical regions. Thus, this atlas captures fine-scale cortical specialization, network organization, and functional boundaries, but also offers better cortical localization than coarse anatomical atlases. However, its construction requires advanced preprocessing, surface reconstruction, and high-quality MRI. Moreover, it is difficult for low-resolution modalities, such as low-density EEG and clinical low-resolution imaging.
Using such predefined brain atlases may result in suboptimal representations and may not sufficiently capture disease-related alterations in brain organization (Eickhoff et al., 2018). As an alternative, data-driven brain atlas construction methods have been proposed to better reflect pathological variations and disease-specific brain patterns (H.E. Wang et al., 2021).
3. C-Atlas: a new functional brain map
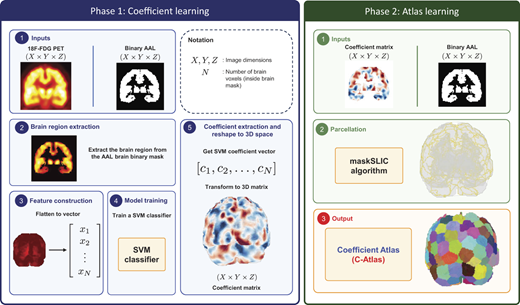
In this section, we introduce a novel functional brain atlas, termed the Coefficient-Atlas (C-Atlas), which is constructed through AD-driven learning. The C-Atlas learning consists of two phases, including coefficient learning and atlas learning, as illustrated in Figure 1. In the first phase, PET images together with their corresponding labels (e.g., AD and NC, for normal control) [2] are used to train a linear SVM classifier. The coefficients learned by the SVM are subsequently employed in the second phase, where the SLIC clustering algorithm (Achanta et al., 2012) is applied to learn the proposed atlas. The details of these two phases are presented in the following subsections.
3.1 Phase 1: Coefficient learning
In this phase, we utilize PET images to train a linear SVM classifier for binary classification between healthy controls and patients with a neurological disorder (e.g., AD). The trained classifier yields discriminative coefficients that enable us to quantify the relevance of brain regions, which are subsequently exploited for clustering. The choice of a linear SVM is motivated by two key observations. First, linear SVMs are particularly suitable for high-dimensional data (e.g., on the order of features in our setting), providing strong generalization performance while reducing the risk of overfitting. Second, the learned model coefficients offer a direct measure of feature importance, which can be leveraged for relevance analysis (Guyon et al., 2002). This characteristic is crucial for the subsequent stage of the proposed framework.
To achieve robust SVM classification performance, this phase first requires an appropriate preprocessing procedure. Each 3D brain PET image consists of two distinct regions: the background (non-brain area) and the foreground (brain tissue). Since the background contains little or no discriminative information while unnecessarily increasing computational complexity, we extract the brain region using a binary anatomical mask from the AAL Atlas. Importantly, in this study, AAL was used solely to define a common analysis mask and a fair reference for comparison; its anatomical labels do not guide region formation in C-Atlas. The extracted foreground region is subsequently vectorized and used as the input to the SVM classifier. Specifically, after masking and flattening, each PET image is represented as a feature vector corresponding only to voxels within the brain region. In our AD study, each image is represented by a vector containing about features (185355, to be exact).
Following the training of the linear SVM, we obtain a coefficient vector , where each coefficient corresponds to the contribution of the ith feature to the classification model. The magnitude of reflects the importance of the associated voxel in the classification task, whereas its sign indicates the direction of the contribution. Since this work focuses on quantifying the contribution level of brain regions, we consider the absolute values for subsequent analysis.
Finally, the coefficient vector is reshaped into a 3D volume, denoted by , which has the same spatial dimensions as the original PET images. Each voxel corresponds to the spatial coordinate in the 3D image space. Voxels located outside the brain region are assigned a value of zero, while voxels within the brain region are normalized to the range [0,1] using min-max normalization.
3.2 Phase 2: Atlas learning
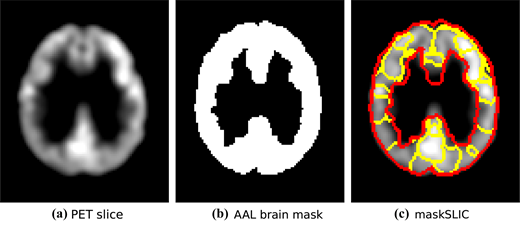
The coefficient matrix obtained from Phase I is used as the input for atlas learning. In this phase, we employ the Simple Linear Iterative Clustering (SLIC) algorithm (Achanta et al., 2012), an efficient clustering method based on the concept of supervoxels. SLIC partitions an image into spatially contiguous and locally homogeneous voxel clusters, thereby facilitating subsequent analysis and feature extraction. As discussed previously, the background region in 3D brain images contains little informative content. Therefore, we restrict the clustering process to the brain region by adopting maskSLIC, a masked variant of SLIC that performs supervoxel segmentation exclusively within a predefined brain mask, see Figure 2 for an illustration. This strategy avoids generating clusters in non-brain regions and improves both computational efficiency and segmentation quality.
The maskSLIC algorithm first initializes cluster centers at approximately regular spatial intervals within the brain mask, followed by an iterative localized k-means clustering procedure. Unlike conventional k-means, maskSLIC jointly considers voxel intensity similarity and spatial proximity. Specifically, the distance measure between two voxels located at and is defined as:
where and denote the grayscale distance and spatial distance, respectively, given by:
Here, is the compactness parameter controlling the trade-off between feature similarity and spatial regularity, while S denotes the approximate spacing between neighboring cluster centers. Larger values of emphasize spatial compactness, resulting in more regular and spatially homogeneous supervoxels.
The performance of maskSLIC depends on several parameters, including the compactness parameter, the number of iterations, and the number of clusters. To systematically evaluate the influence of these parameters, we conduct experiments using multiple combinations of compactness values, iteration numbers, and cluster counts. Since maskSLIC can be interpreted as a spatially constrained variant of k-means clustering, we employ the Mean Squared Error (MSE) and its normalized version (nMSE) as quantitative evaluation metrics. Lower MSE values indicate higher intra-cluster homogeneity and thus better clustering quality.
We consider two forms of reconstruction error: one computed using the cluster centroid intensity and another using the cluster mean intensity. These measures are respectively defined as:
where denotes the k-th cluster, is the coefficient value at voxel , is the intensity value at the centroid of cluster , and is the mean intensity of cluster . To compensate for cluster size variations, we additionally define the normalized MSE measures as:
where denotes the number of voxels in cluster . Based on empirical experiments, in our implementation, the compactness parameter was set to 0.001, and the algorithm was run for 200 iterations to ensure stable convergence (see Algorithm 1 for more details).
Algorithm 1. C-Atlas construction and evaluation
Applying maskSLIC to the coefficient matrix produces a label matrix , in which each voxel is assigned a cluster label. Voxels sharing the same label belong to the same supervoxel, thereby partitioning the brain into spatially contiguous regions. Consequently, the label matrix can be interpreted as a learned brain atlas, referred to as the Coefficient Atlas (C-Atlas), which is subsequently used for region-based feature extraction.
Furthermore, by jointly analyzing the learned atlas and the coefficient matrix , the importance of each supervoxel can be quantified through the average coefficient magnitude within the corresponding region. This provides a natural mechanism for ranking brain regions according to their contribution to the classification task. As a result, the proposed framework not only constructs a data-driven brain parcellation but also intrinsically identifies discriminative ROIs that can be effectively exploited for feature selection and interpretability.
3.3 C-Atlas+
Building on the original C-Atlas pipeline, we introduce the C-Atlas+, an enhanced variant that targets two specific limitations identified during the analysis of the C-Atlas: (i) the high variance of a single linear SVM, which produces a coefficient map that changes substantially with the training sub-sample and undermines atlas reproducibility, and (ii) the use of a single coefficient channel as the input feature for maskSLIC, which collapses several pieces of information that the segmentation algorithm could otherwise exploit. The C-Atlas+ replaces these two stages of the C-Atlas pipeline with a bagging-SVM coefficient estimator and a multi-channel maskSLIC segmenter (see Algorithm 2 for more details).
Algorithm 2. C-Atlas+ construction and evaluation
3.3.1 Bagging-SVM coefficient estimation.
A single linear SVM fit on the entire training set yields a coefficient map that is highly sensitive to the particular training sub-sample, which directly translates into structural instability of the learned atlas across repeated runs. To reduce this variance, we replace the single fit by an ensemble of N classifiers, each trained on an independent bootstrap re-sample of the training cohort. Let denote the training set. For each estimator , we draw a sub-sample of size uniformly with replacement and fit a linear SVM to obtain a coefficient vector . The aggregated coefficient and its per-voxel uncertainty are:
In our implementation, and . As is standard for bagging, the bias of matches that of the base learner, while the variance is reduced by approximately a factor of , yielding a far more stable input for the segmentation stage.
Three voxel-wise maps are derived from the bagged ensemble and stored: (a) in min–max-normalized form, used by maskSLIC; (b) the raw signed mean , used for region-level importance ranking (Section 5.3.4); and (c) , retained as a per-voxel uncertainty map for quality assurance.
3.3.2 Multi-channel maskSLIC.
In the original C-Atlas, a single normalized coefficient map is supplied as input to maskSLIC. This collapses three complementary cues that the algorithm could otherwise weigh independently: the direction of class-gain (AD-gain versus NC-gain), the anatomical context that distinguishes gray from white matter, and the multi-scale spatial structure of the coefficient field. To make these cues explicit, we extend the input to a four-channel feature volume:
where indexes a voxel, is the signed mean coefficient from the bagging step, is its magnitude, is the cohort-mean cerebellum-normalized FDG-PET intensity (an anatomical prior), and is a Gaussian-smoothed version of that provides a coarser scale-space level. Each channel is z-scored within the brain mask so that maskSLIC treats them on a common footing. The clustering is then driven by the multi-channel CIELAB-style distance:
where S is the expected supervoxel size and c a compactness parameter. The remaining maskSLIC mechanics (initialization on a regular grid, iterative assignment, restriction to the brain mask) follow the original formulation (Achanta et al., 2012).
This extension is in line with the multi-channel philosophy of the original SLIC formulation (Achanta et al., 2012), where color and spatial coordinates are jointly clustered; here, the channels carry neuroscience-informed information rather than perceptual color.
4. C-Atlas: an effective functional brain map for Alzheimer’s diagnosis
In this section, we present a comprehensive experimental framework to demonstrate the effectiveness of the C-Atlas for AD detection in terms of classification accuracy, stability, interpretability, and anatomical validity.
First, we investigate the stability and consistency of the C-Atlas by examining the reproducibility of the learned parcellations across multiple random training/testing splits, and compare the resulting atlases with the Schaefer Atlas at equivalent spatial resolutions. Second, we evaluate the classification performance for AD detection to assess the effectiveness of the learned atlas. Third, we conduct a region-level feature importance analysis to identify the most discriminative brain regions associated with the classification task. The spatial distributions of these regions are further compared with those defined by the AAL Atlas to assess the anatomical consistency and neurobiological interpretability of the C-Atlas [3].
4.1 Stability and consistency of C-Atlas
Since the C-Atlas is a data-driven and data-dependent framework, variations in the input data set may lead to differences in the resulting parcellations. Therefore, it is essential to evaluate the consistency and stability of both the learned C-Atlas and the atlas construction procedure.
To this end, the data set is randomly divided into two equal subsets: one subset is used for atlas learning, while the other is reserved for evaluating the effectiveness of the learned atlas in AD classification tasks (see Algorithm 1). We constructed the C-Atlas 100 independent times using different random data splits, and then compared the resulting atlases to evaluate the variability and stability of the atlas construction process across runs. This experimental design enables us to investigate how the learned atlas behaves under varying data partitions and whether the resulting parcellations remain stable across independent runs.
Experimental Setup: We perform two types of comparisons: (i) comparisons between C-Atlases obtained from different iterations to evaluate inter-run consistency, and (ii) comparisons between each learned C-Atlas and a predefined atlas, such as the Schaefer Atlas with a matched number of regions, to assess structural similarity with established brain parcellations. Several criteria are commonly considered in brain parcellation evaluation, including stability (reproducibility), cluster validity measures, and network-based characteristics (Arslan et al., 2018). In this work, our primary objective is to construct a brain atlas that is well-suited for PET-based feature extraction and classification. Consequently, we focus mainly on evaluating the stability, consistency, and computational efficiency of the proposed framework.
From a data mining perspective, the proposed atlas learning framework can be interpreted as a clustering problem, since the SLIC algorithm is employed in Phase II of our C-Atlas learning to partition the brain into spatially contiguous supervoxel regions. Therefore, in addition to classification performance, we also leverage clustering-based evaluation metrics to quantitatively assess the quality and robustness of the learned parcellations of the C-Atlas.
Evaluation Metrics: To assess clustering performance, we adopt two widely used metrics for evaluating clustering quality: Dice coefficient (Dice, 1945) and Adjusted Mutual Information (AMI) (Lawrence et al., 2021).
Given two brain regions A and B, the Dice coefficient is defined as:
where denotes the cardinality of a set. A higher Dice value indicates a greater degree of spatial overlap between the two regions.
To compute the Dice similarity between two brain atlases, we adopt the approach proposed in (Blumensath et al., 2013). Specifically, we first calculate the Dice coefficient for all possible pairs of regions across the two atlases. We then iteratively match region pairs with the highest Dice values, removing matched regions from further consideration at each step. The overall similarity between the two atlases is quantified by the global Dice coefficient, defined as the average Dice value over all matched region pairs. In cases where the two atlases contain different numbers of regions, any unmatched regions are assigned a Dice value of zero in the averaging process. A higher global Dice coefficient reflects a better correspondence between the two atlases.
Adjusted Mutual Information (AMI) is a metric used to quantify the agreement between two clustering results while correcting for chance. Unlike the Mutual Information (MI) score, AMI accounts for the expected similarity between random clusterings, thereby providing a more reliable and unbiased comparison. The AMI between two clusters A and B is defined as:
where is the MI between clusters A and B, is the expected MI between A and B for random clusters, and are the entropies. AMI score ranges from 0 (independent clusters) to 1 (perfectly matching clusters), with higher values indicating stronger similarity between the two clustering results.
We refer the reader to Section 5.3.1 for the experimental results of this task.
4.2 AD classification
After validating the consistency and stability of the C-Atlas, the next objective is to investigate whether the learned atlas can effectively support feature extraction from FDG-PET images for AD detection tasks.
Experimental Setup: The proposed C-Atlas is employed to compute region-wise mean metabolic values from each FDG-PET scan. Specifically, for each atlas region, the voxel intensities within that region are averaged to obtain a compact regional representation of brain metabolism. We focus on region-wise mean features because they have been shown to provide robust and discriminative biomarkers for distinguishing between AD, MCI and NC subjects, and have been widely adopted in previous neuroimaging studies (Ota et al., 2015; Gray et al., 2012; Pagani et al., 2015; Asim et al., 2018).
The extracted regional features are subsequently used to train an SVM classifier for the binary AD/NC classification task. The performance of the proposed framework is then compared against classifiers constructed using: voxel-wise PET features, features derived from predefined single-scale atlases, such as AAL and LPBA40, and features extracted from multi-scale atlases, including the Schaefer Atlas.
Evaluation metrics: Let TP, TN, FP and FN denote true positives, true negatives, false positives and false negatives, respectively. The classification performance is evaluated using standard metrics, including accuracy (ACC), specificity (SPE), sensitivity (SEN) and the area under the receiver operating characteristic curve (AUC). In particular, they are defined as follows:
While measures the probability that a classifier ranks a randomly selected positive instance higher than a randomly selected negative one. Higher values of these metrics indicate better classification performance. We also perform statistical tests on ACC values across independent runs to determine whether the performance differences between C-Atlas and the reference atlases are significant.
We refer the reader to Section 5.3.2 for the experimental results of this task.
4.3 Feature ranking
The proposed C-Atlas framework naturally enables the ranking of brain regions according to their discriminative contributions to the classification task. Since the C-Atlas is constructed from the coefficient matrix learned by a linear SVM, the resulting parcellation intrinsically preserves disease-relevant information. Consequently, the C-Atlas provides an interpretable and data-driven mechanism for identifying informative brain regions, making it particularly suitable for feature selection in AD detection tasks.
Experimental setup: Let denote the label matrix obtained from maskSLIC and let denote the learned coefficient matrix derived from the linear SVM classifier. For each region defined in , we compute the average coefficient magnitude within the corresponding supervoxel to quantify its discriminative importance. The regions are subsequently ranked in descending order according to these importance scores.
Based on the resulting ranking, we progressively select the top M regions, where M varies from 1 to the total number of atlas regions. The features extracted from these selected regions are then used to train a linear SVM classifier for the AD detection task. The corresponding classification performance is reported to evaluate the effectiveness of the proposed feature ranking strategy.
Evaluation metrics: To assess the effectiveness of the proposed region-ranking framework, we compare the classification accuracy (ACC) achieved using C-Atlas-based feature selection against: (i) a conventional voxel-wise feature ranking method based on the T-score (Li et al., 2018), and (ii) region-wise features extracted from the Schaefer Atlas at the same spatial resolution.
This comparison allows us to evaluate whether the proposed C-Atlas can more effectively identify compact and discriminative brain regions relevant to AD. We refer the reader to Section 5.3.4 for the experimental results of this task.
5. Experiments and results
5.1 Data sets
Data used in our experiments were obtained from the Alzheimer’s Disease Neuroimaging Initiative (ADNI) database (Link to adni.loni.uscLink to website of adni.loni.usc). ADNI was launched in 2003 as a public-private partnership with the primary goal of testing whether serial MRI, PET, other biological markers, and clinical and neuro-psychological assessment can be combined to measure the progression of MCI and early AD.
5.1.1 Data selection.
We obtained 18F-FDG PET images from ADNI and used them for our study. In the ADNI data set, participants may undergo multiple scans at different time points to monitor disease progression. The initial scan is referred to as the baseline, followed by subsequent scans at 6, 12 and 18 months, which are collectively termed follow-up visits.
As we focus on AD detection tasks, only baseline scans are considered. To ensure label consistency and reliability, we further restrict the data set to subjects whose diagnostic status remains unchanged throughout the follow-up period. Specifically, the selected data satisfy the following criteria: (i) AD group, for subjects diagnosed with AD at baseline and maintaining the same diagnosis during follow-up; and (ii) NC group, for subjects diagnosed as normal controls at baseline with no change in diagnosis over time.
To examine whether the C-Atlas can also support more challenging prediction tasks, we evaluate the same classification pipeline on the MCI subtype classification problem, where the goal is to distinguish stable MCI (sMCI) from progressive MCI (pMCI). We use 100 pMCI and 100 sMCI FDG-PET scans.
5.1.2 Data preprocessing.
PET images are spatially normalized to the Montreal Neurological Institute (MNI) template using the Statistical Parametric Mapping (SPM) software, with a voxel resolution of and an image dimension of voxels (902,629 in total). In this work, normalization is performed using the PET template available in SPM without MRI as an intermediate modality. This preprocessing step is widely adopted in previous studies (Rosa et al., 2014; Katako et al., 2018; Teng et al., 2020; Blazhenets et al., 2018). The MNI template is used here only for normalization, to bring all brain images into a common space for fair comparison with reference atlases, rather than to guide region formation in C-Atlas. Intensity normalization is subsequently performed by scaling each voxel value by the mean intensity of the cerebellar region. The images are then smoothed using a Gaussian kernel with a full width at half maximum of 8 mm. All preprocessing steps are implemented in SPM12 (Penny et al., 2011).
After preprocessing, a total of 598 baseline FDG-PET images are retained for analysis (303 AD and 295 NC). The cohort is split into two subsets: one half is used for atlas construction (148 NC and 151 AD, totaling 299 subjects), and the other half is used for evaluation (147 NC and 152 AD, totaling 299 subjects). The demographic and clinical characteristics of both subsets are summarized in Table 2, where MMSE denotes the Mini-Mental State Examination (Mitchell, 2009).
5.2 Experimental setup
We randomly partition the data set, without replacement, into two disjoint subsets of equal size (see Table 2), which are used for C-Atlas construction and evaluation, respectively. These two stages are designed as independent learning processes. Moreover, the nature of data utilization differs between them. In the first stage, voxel-wise intensities are used to learn coefficient weights, which subsequently define the ROIs. In the second stage, the C-Atlas is evaluated using features derived from the mean intensity within these predefined ROIs. This separation ensures methodological independence and prevents bias arising from shared data or feature representations.
For classification, unless otherwise specified, we employ fivefold cross-validation. All experiments are repeated 100 times, and the average performance is reported. The implementation is based on the scikit-learn (Pedregosa et al., 2011) and scikit-image (van der Walt et al., 2014) libraries. The experimental parameters are listed in Table 3, and all other parameters were set to the default values provided by the corresponding libraries when not explicitly specified.
5.3 Experimental results
5.3.1 Clustering results.
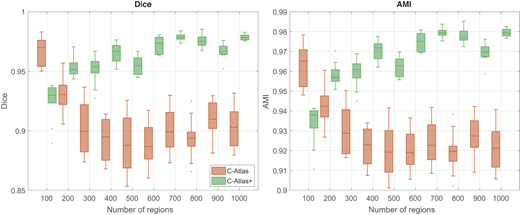
Figure 3 reports the Dice coefficient and AMI computed between independent atlas constructions, evaluated across multiscale resolutions from 100 to 1000 regions. For each scale, ten pairwise comparisons are aggregated as a boxplot, separating the C-Atlas (baseline) and the C-Atlas+. Both C-Atlas and C-Atlas+ exhibit high inter-run stability.
For the C-Atlas, Dice values across iterations remain in the 0.88–0.97 range and the corresponding AMI values lie in 0.91–0.96. The lowest median is observed at 400–500 regions, where the parcels are small enough for minor boundary perturbations to noticeably affect the overlap; the median recovers at finer scales because larger boundaries are statistically harder to disrupt overall.
The C-Atlas+ further increases inter-run stability at every scale: median Dice rises from approximately 0.93 (C-Atlas) to 0.97 (C-Atlas+) at scales of 400 and above, the interquartile range shrinks by roughly a factor of two, and the AMI behaves analogously. This improvement is consistent with the bagging-SVM coefficient estimator (Section 3.3) reducing the variance of the input to maskSLIC by approximately , which in turn yields a far more reproducible supervoxel partition. The only scale at which the C-Atlas+ does not improve upon the C-Atlas is , where the parcels are already large and the C-Atlas baseline is itself near its ceiling.
Together, these observations indicate that the proposed atlas-construction pipeline is robust to random data partitioning, and that the C-Atlas+ enhancements deliver a measurable and scale-consistent gain in reproducibility on top of the already-stable C-Atlas baseline.
5.3.2 Classification results.
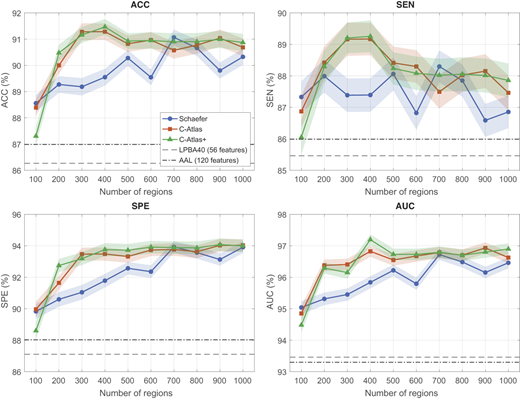
Table 4 and Figure 4 compare their performance with predefined atlases and with the voxel-wise representation in which all brain voxels are used as features. We evaluate the C-Atlas across multiple scales, including 50 and 120 regions to align with single-scale atlases (LPBA40 and AAL), and from 100 to 1,000 regions to match the multiscale Schaefer Atlas. The C-Atlas+ is evaluated over the same multiscale range. Overall, both proposed atlases achieve comparable performance across all evaluation metrics (ACC, SEN, SPE and AUC), with the C-Atlas+ (400) attaining the best result on every metric.
Specifically, when compared to single-scale atlases, the C-Atlas with more than 100 regions outperforms LPBA40 and AAL. In the best case, the C-Atlas (300) improves classification performance by approximately 5.4%, 4.19%, 6.6% and 3.5% in ACC, SEN, SPE and AUC, respectively, relative to AAL. When the number of regions exceeds 200, the C-Atlas also outperforms the all-voxel-wise representation (i.e. full voxels in PET images), while requiring substantially fewer features, approximately of the original dimensionality ().
It is worth emphasizing that the C-Atlas is constructed based on an SVM model initially trained on voxel-wise data within brain regions. The superior performance achieved with significantly fewer features highlights both the efficiency of the C-Atlas and the effectiveness of its construction framework. These results demonstrate that the C-Atlas provides a more powerful representation than single-scale predefined atlases, particularly for feature extraction from PET images.
For multiscale atlases, we compare the C-Atlas with the Schaefer Atlas at matched numbers of regions, as illustrated in Figure 4. In most cases, the C-Atlas achieves better performance across all evaluation metrics, particularly in terms of ACC, SPE and AUC. On average, when the number of regions exceeds 200, the C-Atlas yields an improvement of approximately 1% across all metrics compared to the Schaefer Atlas. Although this improvement is modest, the fact that the C-Atlas is data-driven suggests that, with more data, there is potential for further enhancement. This implies that with a larger data set, the C-Atlas is likely to outperform the Schaefer Atlas even more significantly. Therefore, the C-Atlas appears to be more effective than the Schaefer Atlas at various scales.
As shown in Table 4, increasing the number of regions in the C-Atlas from 100 to 400 leads to a consistent improvement in classification performance. Performance then stabilizes and reaches its peak in the range of 400–600 regions, while further increasing the number of regions beyond 600 results in a gradual decline. These observations highlight the strong influence of atlas scale on analysis outcomes and provide practical guidance for selecting an appropriate number of regions. In contrast, the performance trend observed with the Schaefer Atlas is less consistent and less pronounced across scales. Overall, these results suggest that the C-Atlas is more adaptive in capturing disease-relevant patterns in the brain, while also emphasizing the critical role of atlas scale in determining analytical performance.
Paired two-sided t-tests were applied to the 500 fold-aligned ACC scores (100 repeats 5 folds) for each (method, scale) pair. As shown in Table 5, at each scale , both proposed atlases (C-Atlas and C-Atlas+) were tested against the two single-scale baselines (AAL, LPBA40) and against Schaefer at the matched scale. C-Atlas and C-Atlas+ achieved significantly higher ACC than the two single-scale baselines (). Against Schaefer at the matched scale, the proposed methods were also significantly superior in the central range (). At the lowest scale (), C-Atlas+ underperformed Schaefer. In the high-scale range , the differences narrowed: C-Atlas was significantly worse than Schaefer at and indistinguishable at (ns), while C-Atlas+ was not significantly different from Schaefer at either scale (ns). Performance separation reemerged at , where both proposed methods regained a significant advantage over Schaefer.
5.3.3 sMCI vs pMCI classification.
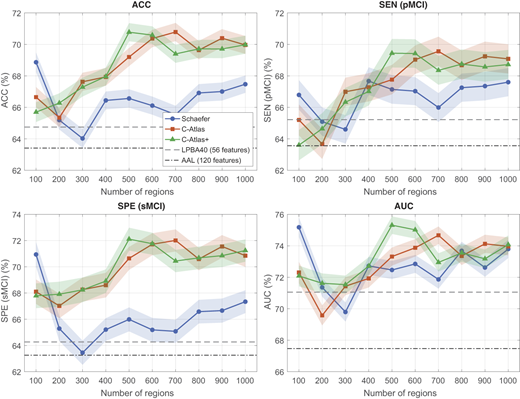
Figure 5 illustrates the performance of C-Atlas and its variant on the task of classifying sMCI and pMCI. We observe that classifying MCI subtypes is substantially harder than discriminating between AD and CN, with ACC typically around 20% lower. This observation holds true across all brain atlases. However, both C-Atlas and C-Atlas+ still result in the best performance as compared to LPBA40, Schaefer and AAL. Particularly, C-Atlas (700) and C-Atlas+ (500) achieve an ACC of approximately 70.8%. In terms of AUC, C-Atlas+ (500) attains the highest score at 75.31%. Among the multiscale Schaefer atlases, the best performance is obtained by Schaefer (100) with an AUC of 68.87%, whereas the single-scale baselines LPBA40 and AAL lag behind with AUCs of 64.75% and 63.41%, respectively.
5.3.4 Feature ranking results.
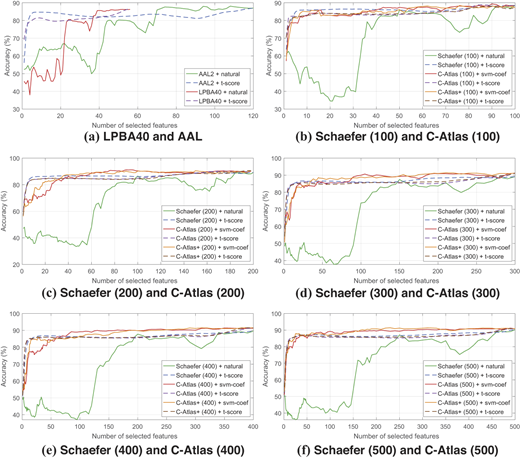
The C-Atlas is capable of identifying important features essential for the diagnosis of AD. Figure 6 illustrates the ACC curves as the number of selected features increases from 1 to 50, 1 to 100, 1 to 200, 1 to 300, 1 to 500 and 1 to 1000, corresponding to the LPBA40 and the C-Atlas (aligned with the Schaefer Atlas) at resolutions of 100, 200, 300, 500 and 1000 regions, respectively. These curves clearly demonstrate that feature ranking substantially improves the performance of predefined atlases, both at single-scale and multiscale configurations. Notably, the C-Atlas exhibits a strong intrinsic ranking capability, achieving performance comparable to T-score-based ranking within the C-Atlas framework. Furthermore, it consistently outperforms predefined atlases in terms of feature ranking effectiveness.
For example, in Figure 6(a), comparing classifiers with and without T-score-based feature ranking for the LPBA40 and AAL atlases shows a performance improvement of about 10% when fewer than 20 features are selected. Beyond this point, performance stabilizes and reaches its peak. A similar trend is observed for the Schaefer Atlas across multiple scales [Figure 6(b)–(f)], where performance peaks and stabilizes after approximately 200 features. These results highlight the effectiveness of feature ranking in improving classifier performance across both single- and multiscale predefined atlases, while also indicating the influence of atlas scale on ranking outcomes.
For the C-Atlas, combining it with T-score generally yields performance comparable to the Schaefer Atlas with T-score, and substantially better than Schaefer without feature ranking, with gains often exceeding . However, unlike the Schaefer Atlas, the C-Atlas exhibits strong intrinsic ranking ability: its native ranking consistently outperforms its T-score variant. In many cases, using only the top-50 features already achieves over accuracy. Although performance with the top-1 feature is relatively limited, the C-Atlas surpasses both its T-score version and predefined atlases (with or without ranking) from the top-10 features onward. Performance further improves up to the top-50 features and stabilizes around the top-100. These results highlight that the C-Atlas not only extracts informative features from FDG-PET images but also effectively ranks them, distinguishing it from predefined atlases.
5.4 C-Atlas structural analysis
In the previous subsections, we evaluated the C-Atlas from both clustering and classification perspectives. To further elucidate its effectiveness, we now examine its structural properties by analyzing the C-Atlas across multiple scales and comparing it with predefined atlases such as AAL and Schaefer.
5.4.1 Structural variability and performance of C-Atlas at various scales.
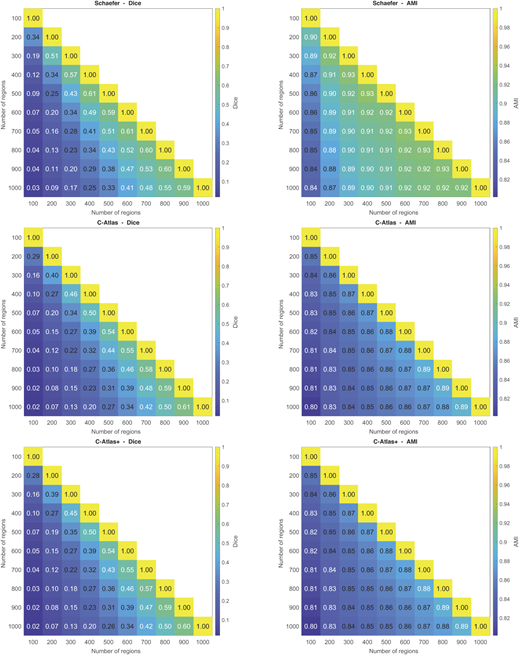
Figure 7 illustrates the structural variations of the C-Atlas and the Schaefer Atlas across multiple scales. These differences help explain the performance variability of the C-Atlas across scales, as well as its comparative performance against the Schaefer Atlas in AD classification (Table 4).
Specifically, Figure 7 shows that Dice coefficient analysis reveals substantial structural differences between lower and higher scales. For example, when comparing atlases with 100 regions to those with 200–1000 regions, the Dice coefficient decreases from 0.34 to 0.03 for the Schaefer Atlas and from 0.29 (resp. 0.28) to 0.02 for the C-Atlas (resp. the C-Atlas+). This reduction is expected, as regions become smaller at higher resolutions. These structural variations across scales lead to corresponding differences in classification performance. Moreover, when considered alongside Figure 3, they further explain the performance discrepancies of the C-Atlas across scales and in comparison with the Schaefer Atlas, confirming that performance differences are closely linked to structural variations between atlases.
From Figure 7, we also observe that the Dice coefficient and AMI values of the C-Atlas are slightly lower than those of the Schaefer Atlas. This suggests greater structural variability of the C-Atlas across scales, which may explain its differing performance trends relative to the Schaefer Atlas. These findings indicate that specific scales of the C-Atlas may be better suited for AD analysis. Combined with its superior performance, this suggests that each scale of the C-Atlas captures more informative AD-related patterns than the corresponding scales of the Schaefer Atlas.
5.4.2 Structure of C-Atlas.
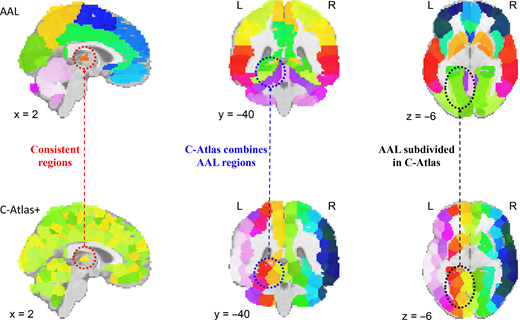
We further investigate the structural characteristics of the C-Atlas by comparing it with the AAL Atlas, one of the most widely used predefined atlases in AD research. For clarity and consistency, we focus on the C-Atlas+ containing 400 regions, as it achieved the best performance in the AD classification experiments.
Figure 8 provides a visual comparison between the C-Atlas and the AAL Atlas. Several regions exhibit strong structural correspondence between the two atlases (red dashed circles). However, substantial differences can also be observed. Specifically, some AAL regions are subdivided into multiple smaller regions in the C-Atlas (black dashed ellipses), while others are merged into larger regions (blue dotted ellipses). Additional quantitative details regarding voxel overlap between corresponding ROIs are fully reported in Table A1 in the Appendix. These observations indicate that the C-Atlas reorganizes anatomical structures differently from the predefined AAL Atlas, potentially enabling a representation that is more adaptive to AD-related patterns.
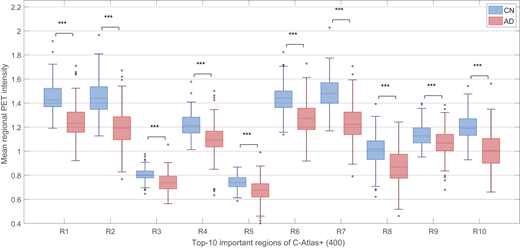
To further understand the discriminative capability of the C-Atlas, we analyze the top-10 most important regions identified by the framework. As shown in the boxplots of Figure 9, these regions demonstrate strong separability between groups, with all t-test p-values below 0.0001, suggesting their high relevance for AD detection. Mapping these regions to their corresponding anatomical areas in the AAL Atlas (Table 6) reveals that they are primarily distributed within the parietal and frontal lobes, which are known to be strongly associated with AD-related neuro-degeneration (Bohnen et al., 2011).
Interestingly, Table 6 further shows that many of the most discriminative regions in the C-Atlas correspond to merged subregions of the AAL Atlas rather than direct one-to-one anatomical matches. For example, the top-ranked C-Atlas ROI consists primarily of Cuneus_R and Precuneus_R from the AAL Atlas. Similarly, the second-ranked C-Atlas ROI is mainly formed by the merging of the Precuneus_L and Precuneus_R regions. This finding suggests that the C-Atlas not only preserves anatomically meaningful structures but also adaptively redefines them into more informative spatial units that better capture disease-specific characteristics. Such structural adaptation may explain the superior diagnostic performance of the C-Atlas compared with the predefined AAL Atlas.
Overall, these results imply that the C-Atlas effectively reorganizes brain regions according to disease relevance, producing spatial representations that more accurately reflect the neurodegenerative patterns associated with AD.
6. Discussions
The experimental results on AD classification tasks and feature ranking analysis in Section 5 demonstrate that the C-Atlas outperforms classical predefined atlases in supporting AD detection. This superiority can be attributed to the fact that the C-Atlas is constructed directly from data sets containing AD-related information, whereas predefined atlases are typically derived from NC subjects and therefore lack disease-specific characteristics. These findings suggest that constructing atlases designed to disease-specific data sets, such as AD-driven atlases, is both feasible and highly effective for improving diagnostic performance.
The proposed framework for constructing and evaluating the C-Atlas provides several insights and considerations for future research. In the following discussions, we examine key aspects of the framework, including data-related considerations, methodological design, disease-specific brain region analysis, potential applications and some open research challenges.
6.1 Data-related consideration
Previous studies have focused on constructing brain atlases using data exclusively from NC groups. In contrast, our C-Atlas construction method uses SVM to simultaneously construct brain mapping data across multiple groups, including AD and NC. By leveraging the learned SVM coefficients for atlas construction, our method allows the integration of information from diverse disease states into a unified framework for brain mapping. This strategy innovatively incorporates data from various groups beyond NC, thus fulfilling the need for comprehensive brain mapping that includes patient data (Moghimi et al., 2022).
Acknowledging the lower spatial resolution of PET compared with MRI, our atlas is not learned directly from raw voxel intensities alone; instead, classifier-guided coefficient maps are used to drive the parcellation process. The results suggest that this learning strategy can still produce adaptive brain representations from lower-resolution modalities such as PET, where discriminative information is captured by the learned coefficients rather than by fine anatomical detail.
Moreover, although our study focuses on FDG-PET imaging, the proposed C-Atlas framework is adaptable to other neuroimaging modalities, including MRI and fMRI, which broadens its applicability across diverse types of brain data. In future work, the framework can be further extended to other modalities and tracers, including MRI, fMRI and PET with alternative tracers such as AV45 and AV1451, to evaluate its robustness and broader utility.
In our work, the selection of 400 regions was determined empirically as the empirical optimum based on the averaged classification results from 100 independent runs using fivefold cross-validation. And, it should not be interpreted as a biologically optimal scale. Moreover, the best-performing configuration was identified on the evaluation data rather than through a fully independent model-selection procedure. These observations underscore that the reported scale should be regarded as a practical experimental choice under the current setting, and further investigation is needed to study how atlas granularity influences stability, interpretability and downstream classification performance.
6.2 Methodology consideration
In the construction phase of the C-Atlas, the SLIC algorithm is used to construct the atlas due to its simplicity and efficiency. The masked version of SLIC allows us to focus specifically on the brain area, thereby enhancing the effectiveness of clustering. Another intriguing aspect of SLIC is its adaptability to integrate information across various dimensions (2D, 3D and 4D). This feature enables us to consider data from multiple 3D images together when constructing brain atlases.
Specifically, the distance calculation method of SLIC can be enhanced to facilitate the integration of information from different tasks, such as AD versus NC and Parkinson versus NC, or to integrate information from different modalities, such as PET and MRI data, for brain mapping. This versatility meets the increasing demand from the research community for brain atlases that integrate information from diverse data sources (Fan, 2021).
In this work, we choose a linear SVM because it is simple, widely used and provides directly interpretable voxel-wise discriminative weights, which are essential for atlas construction. This choice also makes the proposed framework easier to analyze and reproduce results. At the same time, the framework can be naturally extended to nonlinear classifiers, for example, by replacing the linear SVM with a radial basis function-kernel SVM, to capture more complex disease-related patterns. Future work will compare linear and nonlinear variants more systematically to obtain a clearer picture of their relative benefits for atlas learning and downstream classification.
6.3 Disease-specific brain region consideration
The C-Atlas distinguishes itself from predefined atlases by not only segmenting the brain into distinct regions but also prioritizing these regions according to their relevance to specific diseases. This characteristic is particularly beneficial for radiologists, as it enables them to concentrate on the most disease-relevant regions during interpretation. In contrast to traditional atlas construction methods that often focus on anatomical segmentation, the C-Atlas framework jointly incorporates structural parcellation and quantitative evaluation of region-wise disease relevance.
Furthermore, the experimental findings in this study are consistent with previous literature and can be well justified. In particular, the comparison between the C-Atlas and the AAL Atlas reveals that the highest-ranked C-Atlas regions overlap with important AAL ROIs such as Hippocampus and Precuneus (see Table 6). These regions have been widely reported as strongly associated with AD (Bohnen et al., 2011), thereby supporting the validity of our results. In addition, Table 6 shows that the top-ranked ROIs in the C-Atlas are formed by combining multiple AAL sub-ROIs. This suggests that the C-Atlas construction process identifies the most discriminative components of AAL and merges them into larger and more informative regions, which may explain the superior performance of the C-Atlas for AD diagnosis compared with conventional atlases. For example, the top-ranked C-Atlas ROI integrates the regions Cuneus_R and Precuneus_R, whereas the tenth-ranked ROI corresponds to Angular_R. These regions are known to be highly vulnerable to AD (Tuan et al., 2021).
6.4 Application consideration
In this study, the C-Atlas was used for the AD classification. However, its potential applications are not limited to classification alone. It can be expanded into frameworks for comparing brain atlases across different neurodegenerative diseases, revealing both commonalities and distinctions among conditions. In addition, the C-Atlas shows promise for tasks such as brain network analysis and detailed analyses involving multiple scales of features. Moreover, the C-Atlas can identify sub-important regions from predefined atlases, or serve as a supplementary tool by offering ranking features that enhance these atlases in related tasks. Addressing these areas represents promising avenues for future research.
Taken together, the results of this study suggest that C-Atlas provides a complementary view of conventional brain atlases. FDG-PET captures cerebral glucose metabolism, which is closely associated with neuronal activity, and therefore offers information that differs from structural sMRI and fMRI. From this perspective, C-Atlas should be regarded as a data-driven representation designed to complement existing atlases, while also demonstrating the possibility of deriving an adaptive and task-relevant representation even from low-resolution imaging. At the same time, its value extends beyond improved classification accuracy, as it also provides a balance between the number of features, performance and ranking capability. More broadly, it may serve as a useful tool for comparing and integrating information across brain diseases and imaging modalities.
6.5 Open problems
While several important results have been demonstrated with the C-Atlas, there are interesting open problems to be further investigated. First, this study focuses solely on PET images; therefore, it is important to investigate the applicability of the PET-driven C-Atlas with other medical imaging modalities, such as MRI and fMRI, to further extend the usefulness of the C-Atlas. Second, it is of interest to apply it to other data sets and brain diseases to confirm or increase its generalizability. Third, since this study exclusively used SVM classifiers, examining the effectiveness of the C-Atlas with other types of classifiers is of interest. In addition, parameter selection for SLIC is a time-consuming process, emphasizing the need to automate this step or explore better alternative segmentation algorithms. Finally, further studies on the effectiveness of the C-Atlas in different tasks such as network analysis are of great interest for broadening the applicability of the C-Atlas.
7. Conclusions
In this work, we have introduced a novel brain mapping approach for AD diagnosis, termed C-Atlas, and provided a comprehensive evaluation of its capability and applicability through stability analysis and cross-task assessments. Experimental results have shown that the C-Atlas has enabled more effective extraction and selection of discriminative features, leading to significant improvements in classification performance compared to predefined atlases. These findings support the feasibility of developing disease-adaptive functional brain atlases. Moreover, the C-Atlas construction framework is flexible, allowing the generation of atlases with varying numbers of ROIs while maintaining robustness. This makes the C-Atlas a practical tool for learning and comparing brain atlases across different conditions. Further evaluation on diverse data sets and diseases will help clarify its broader applicability.
The research of Nguyen Linh Trung, Pham Minh Tuan, Trung Thanh Le and Mouloud Adel was funded by the National Foundation for Science and Technology Development (NAFOSTED) of Vietnam, under grant number 102.04-2021.55.
Data collection and sharing for the ADNI is funded by the National Institute on Aging (National Institutes of Health Grant U19AG024904). The grantee organization is the Northern California Institute for Research and Education. In the past, ADNI has also received funding from the National Institute of Biomedical Imaging and Bioengineering, the Canadian Institutes of Health Research, and private sector contributions through the Foundation for the National Institutes of Health (FNIH) including generous contributions from the following: AbbVie, Alzheimer’s Association; Alzheimer’s Drug Discovery Foundation; Araclon Biotech; BioClinica, Inc.; Biogen; BristolMyers Squibb Company; CereSpir, Inc.; Cogstate; Eisai Inc.; Elan Pharmaceuticals, Inc.; Eli Lilly and Company; EuroImmun; F. Hoffmann-La Roche Ltd and its affiliated company Genentech, Inc.; Fujirebio; GE Healthcare; IXICO Ltd.; Janssen Alzheimer Immunotherapy Research and Development, LLC.; Johnson and Johnson Pharmaceutical Research and Development LLC.; Lumosity; Lundbeck; Merck and Co., Inc.; Meso Scale Diagnostics, LLC.; NeuroRx Research; Neurotrack Technologies; Novartis Pharmaceuticals Corporation; Pfizer Inc.; Piramal Imaging; Servier; Takeda Pharmaceutical Company; and Transition Therapeutics.
Declarations Ethics approval and consent to participate
For this study we used human data from the ADNI initiative. The authors did not recruit any of the subjects ourselves, and we did not do any of the measurements ourselves. Informed consent was obtained from each subject at the ADNI site that recorded data for that subject, and in each informed consent the following wording was used: “Study investigators will maintain and be responsible for deciding how your data will be used for future research. All links with your identity will be removed from the data before they are shared. Only de-identified data, which does not include anything that might directly identify you, will be shared with ADNI members and the general scientific community for research purposes.” [Link to adni.loni.uscLink to website of adni.loni.usc]. For that reason, we did not need to seek additional ethics committee advice.
Consent for publication
Notes
A short part of this work was presented in the IEEE RIVF International Conference on Computing and Communication Technologies (Tuan et al., 2022).
Our C-Atlas can also be constructed from PET images involving other neurological disorders.
We note that the proposed experimental framework can also be readily extended to other neurodegenerative disease detection tasks.