Automatic speech recognition (ASR) has been increasingly adopted for generating transcriptions to train text-to-speech (TTS) models, substantially reducing manual annotation costs. However, transcription errors introduced by ASR systems inevitably degrade TTS performance, and existing approaches lack explicit quality awareness, leaving it unclear whether TTS models can learn to distinguish and respond to varying transcription quality. This study investigates whether explicit quality supervision can enable TTS models to develop quality-aware representations and achieve controllable stable synthesis. This study proposes transcription quality labels (TQL), automatically derived from connectionist temporal classification scores. During training, TQL provides explicit quality supervision, enabling the model to associate transcription quality with acoustic characteristics. During inference, setting TQL to high values guides the model toward stable synthesis that faithfully follows the input text. Under controlled conditions isolating the effect of transcription quality, our best TQL-based model achieves 8.4% word error rate compared to 15.9% for the baseline, a 47% relative reduction. While synthesis accuracy gains are significant, naturalness improvements are modest (mean opinion score of 3.66 vs. 3.55), indicating that TQL primarily enhances synthesis stability rather than perceptual quality. Further analysis confirms that synthesis quality varies systematically with TQL values at inference, demonstrating learned quality-conditioned behavior.
1. Introduction
Text-to-speech (TTS) synthesis aims to generate natural and intelligible speech from text input. Recent advances in neural generation techniques have driven considerable progress in synthesis quality. Representative approaches include attention-based sequence-to-sequence models (Wang et al., 2017) and generative models based on flow architectures (Kim et al., 2020, 2021) or diffusion processes (Popov et al., 2021; Yasuda and Toda, 2023). When trained on large-scale high-quality data sets, these methods have achieved near human-level synthesis performance.
However, assembling high-quality TTS corpora remains resource-intensive, requiring hundreds of hours of professional recordings, accurate manual transcriptions and meticulous speech-text alignment. To reduce this burden, cost-effective alternatives use publicly available speech, either with existing text sources (Zen et al., 2019) or with automatic transcriptions generated by ASR systems (Chen et al., 2023; He et al., 2025). While these approaches enable rapid, large-scale data set construction, ASR-induced transcription errors, including substitutions, deletions and hallucinations inevitably pose challenges for training robust TTS models.
One established approach for handling noisy transcriptions is data-centric preprocessing: filtering or selecting utterances to discard low-quality or mismatched text-speech pairs based on acoustic or textual criteria (Braunschweiler et al., 2010; He et al., 2025; Seki et al., 2023; Stan et al., 2013). These approaches can effectively improve corpus quality by removing severely mismatched samples, and have been successfully applied in large-scale corpus construction pipelines. However, filtering inevitably enforces a trade-off between data quantity and quality: aggressive filtering discards a substantial portion of the training data, potentially losing valuable acoustic diversity, while lenient filtering retains noisy samples that may degrade synthesis quality.
A separate research direction investigates model behavior when trained directly on noisy transcriptions, rather than filtering the data beforehand. Prior studies have investigated the impact of transcription noise on TTS training under controlled conditions using clean audio paired with noisy transcriptions at varying error rates to isolate the effect of transcription quality from audio quality (Feng et al., 2026, 2024). These studies established that recent diffusion-based TTS models (Popov et al., 2021; Yasuda and Toda, 2023) exhibit notable implicit robustness, yet training on noisy transcriptions still leads to unstable synthesis behavior under high error rate conditions. Importantly, this robustness remains implicit models lack explicit quality awareness, limiting inference time controllability and risking the inadvertent learning of patterns associated with low-quality transcriptions.
Building on these findings, we propose transcription quality labels (TQL) and investigate whether explicit quality supervision can enable TTS models to develop quality-aware representations and achieve stable, controllable synthesis. TQL is derived from connectionist temporal classification (CTC) scores (Graves et al., 2006; K¨urzinger et al., 2020), which have been validated as effective indicators of text-speech alignment quality (Seki et al., 2023). Since computing TQL requires only a pre-trained ASR model and the existing audio-transcript pairs, it serves as an automatic substitute for manual quality annotation, without requiring additional human labeling effort. We derive TQL at both utterance-level and character-level granularities through different normalization strategies of CTC scores: utterance-level TQL captures overall transcription reliability, while character-level TQL identifies which specific characters are likely erroneous, allowing the model to learn fine-grained quality-aware representations. During training, TQL provides explicit quality supervision, enabling the model to learn distinct acoustic synthesis patterns conditioned on transcription quality. This learned quality-conditioned behavior can then be leveraged at inference: by setting TQL to high values, the model is guided toward stable synthesis that faithfully follows the input text.
The main contributions of this work are summarized as follows:
We propose a TQL method based on CTC scores. Under controlled experimental conditions that isolate the effect of transcription quality, we demonstrate that explicit quality supervision enables TTS models to learn quality-aware representations.
We establish a comprehensive evaluation protocol using a balanced test set that includes diverse transcription quality conditions. This design allows systematic assessment of model behavior across varying levels of transcription quality.
Experimental validation demonstrates significant improvements: our best TQL-based model achieves 8.4% word error rate compared to 15.9% for the baseline trained on noisy transcriptions, representing a 47% relative reduction. Analysis reveals that the method primarily enhances synthesis stability rather than perceptual naturalness, which sheds light on the distinct roles of explicit quality supervision.
The remainder of this paper is organized as follows: Section 2 reviews related work on noisy transcription robust TTS- and CTC-based quality assessment. Section 3 presents the proposed TQL method and its integration into the TTS framework. Section 4 details the experimental setup and training configurations. Section 5 reports evaluation results on the balanced test set and analyzes the effects of TQL-based quality control. Section 6 provides further analysis of inference time TQL behavior, positional encoding parameters and input style effects. Section 7 discusses the scope and generalizability of the current approach. Section 8 concludes with implications and future directions.
2. Related work
2.1 Noisy transcription robust TTS
The robustness of TTS systems to transcription errors has been investigated across multiple paradigms, each providing distinct insights into error tolerance mechanisms.
Early unit selection systems (Clark et al., 2007; Matousek et al., 2012) exhibited inherent robustness through direct acoustic unit matching, as transcription errors had minimal impact when the required acoustic units existed in the database. Statistical parametric synthesis (Yamagishi et al., 2008) demonstrated that parameter averaging during model training provides noise tolerance, although synthesis quality degrades as errors accumulate.
The advent of neural TTS introduced both new challenges and opportunities for handling noisy transcriptions. Prior work on Tacotron (Fong et al., 2019) noted that while attention-based mechanisms demonstrate some tolerance to specific error patterns (e.g., word insertions), they remain fundamentally vulnerable to more disruptive error types such as substitutions and deletions. To address textual errors, Yang et al. (2020) introduced a VQVAE-based approach that generates discrete acoustic representations to supplement unreliable transcription features, showing that acoustic-side information can provide robustness against text side errors.
Feng et al. (2026, 2024) found that recent diffusion-based TTS models (Popov et al., 2021; Yasuda and Toda, 2023) exhibit strong robustness to noisy transcriptions, with analysis showing that noise propagation in the diffusion process enables effective acoustic information integration during training. However, their evaluation focused exclusively on clean-style text inputs, potentially missing instabilities under diverse input conditions.
While these approaches have achieved varying degrees of robustness, a common limitation persists: models lack explicit awareness of transcription quality, leaving no mechanism to distinguish reliable from unreliable training samples or to control synthesis behavior at inference time. Whether explicit quality supervision can address these limitations remains unexplored.
2.2 Connectionist temporal classification and CTC score
CTC (Graves et al., 2006) is a sequence-level criterion widely adopted in automatic speech recognition (ASR) for aligning variable-length acoustic observations with shorter target transcript sequences , where and each belongs to a vocabulary of output symbols (e.g., characters). CTC introduces a special blank symbol and defines an alignment path with such that collapsing consecutive non-blank labels and removing blanks recovers . The conditional probability of given sums over all valid paths:
where is the frame-level posterior from the acoustic model and denotes the inverse of the CTC collapse operation. The forward-backward algorithm computes this sum in time. In ASR training, acts as the objective to be minimized.
We define a CTC score derived from the Viterbi (forced-alignment) path. Let:
be the most-probable CTC path that realizes the transcript given the frame-level posteriors . From this path, we segment into consecutive frame sets grouped by transcript symbols:
Then, we obtain the average log-likelihood score for each symbol as follows:
The CTC score is defined as the vector of these per-symbol likelihood scores:
Higher values in indicate stronger local agreement between the corresponding speech segments and transcript characters. In practice, one may aggregate (e.g., by computing its mean, median or minimum) to detect misaligned text–speech pairs in data sets of unknown quality.
2.3 Text-speech alignment and transcription quality
Beyond its role in ASR training, CTC (Graves et al., 2006) has been applied to text-speech alignment in speech synthesis alongside other approaches such as HMM (Hidden Markov Model) based forced alignment (McAuliffe et al., 2017) and attention mechanisms (Chorowski et al., 2015). Recently, Liu et al. (2026) leveraged CTC-based alignment to construct interleaved text-speech training sequences for LLM-based TTS. In addition to providing alignment paths, the alignment process yields per frame likelihood scores that reflect how well each text segment corresponds to the observed speech, which can serve as indicators of transcription quality.
Beyond alignment applications, confidence scores derived from ASR or speech processing models have been applied in various ways, including data filtering for corpus curation (Seki et al., 2023; Takamichi et al., 2021), confidence based data selection and weighting in semi-supervised ASR (Veselý et al., 2017) and output filtering to detect hallucinations in generative speech enhancement (Yamauchi et al., 2026). These approaches use confidence information either at the data preparation stage (removing low confidence samples), during training (adjusting sample contributions to the objective) or at the output stage (rejecting unreliable generated outputs). Our work differs in that we expose quality information as an explicit conditioning input at multiple granularities (utterance-level and character-level), which allows the model to learn quality-aware representations during training and enables direct control over synthesis behavior at inference time. Among various confidence measures, CTC scores are particularly suited to transcription quality assessment because they directly measure text-speech alignment at the character level and are readily available from standard ASR models without requiring additional computation. It should be noted that CTC scores are conditional probabilities under a specific ASR model rather than absolute quality measures – they are influenced by factors such as model capacity and training domain. Nevertheless, as relative quality indicators within a given data set, CTC scores can effectively distinguish samples of varying transcription quality.
In this work, we transform CTC scores into explicit quality labels provided as conditioning input features for TTS training, investigating whether such explicit quality supervision can enable quality-aware synthesis behavior and inference time controllability. We adopt CTC scores as quality indicators in this work, noting that our goal is to investigate whether explicit quality supervision can enable controllable synthesis, rather than to identify the optimal quality measure.
3. Proposed method
Building on the CTC-based quality assessment paradigm discussed in Section 2.3, this section presents our method for transforming CTC alignment scores into TQLs at two granularities for quality-aware TTS training and quality conditioned inference.
3.1 System overview
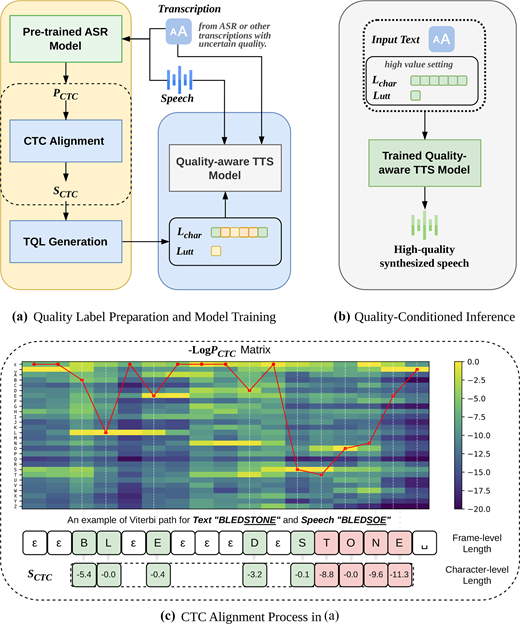
Figure 1 illustrates the overall framework of our proposed method. When training TTS models on transcriptions with varying quality (e.g. ASR generated noisy transcriptions), the model implicitly learns quality varying mappings, which can lead to degraded synthesis quality. We hypothesize that providing explicit quality information can enable the model to distinguish these quality variations and achieve controllable synthesis. To this end, we introduce TQL.
As shown in Figure 1(a), we first compute TQL from speech transcription pairs. A pre-trained ASR model generates CTC alignment probabilities , from which we derive CTC scores and transform them into quality labels at two granularities: an utterance-level label providing global quality assessment, and character-level labels capturing position specific quality variations. The TTS model is then trained with these quality labels to learn explicit associations between transcription quality and acoustic characteristics.
During inference [Figure 1(b)], we exploit this learned quality awareness for controllable synthesis. By setting and to high values, we guide the model to synthesize high-quality speech, effectively overriding the quality varying patterns learned during training. This quality conditioning mechanism enables stable and accurate synthesis even when the training data contains variable transcription quality.
The following sections detail each component: Section 3.2 describes TQL computation, Section 3.3 presents the linguistic encoder architecture with TQL features, and Section 3.4 explains the training and inference procedures.
3.2 CTC score-based transcription quality labels
To assess transcription quality, we calculate the CTC score sequence [equation (4)] for each text-speech pair. As defined in equation (3), each element of is obtained by averaging the frame-level log posteriors over the frames aligned to the corresponding character, thereby aggregating frame-level acoustic evidence into a per character quality indicator [Figure 1(c) shows an example of this process]. We further process to derive both utterance- and character-level TQL. We denote the th element of as [corresponding to in equation (3)].
We design distinct transformations for these two granularities to capture complementary quality aspects. Utterance-level labels use binarization to provide a coarse global assessment, distinguishing generally reliable from unreliable samples. Character-level labels use continuous normalization to preserve fine-grained quality variations that correlate with specific error patterns (e.g. substitutions often yield different CTC score distributions than deletions). This dual-granularity design enables the model to learn both global quality awareness and local error specific representations.
For utterance-level labeling, we apply a threshold to the CTC scores. The CTC scores are discretized into binary labels: ‘1’ for scores above the threshold and ‘0’ otherwise. The utterance-level quality label [equation (6)] is then computed as the mean of the binarized sequence [equation (5)]:
For character-level labeling, the raw CTC scores are clipped at a threshold to obtain [equation (7)], then normalized via Min-Max scaling to yield the character-level quality label [equation (8)]:
3.3 Linguistic encoder and feature alignment
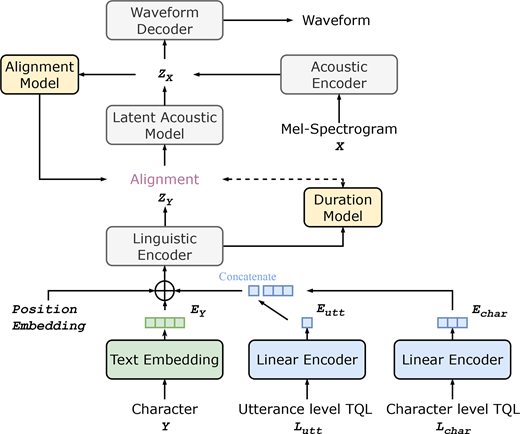
Our approach uses the same transformer-based linguistic encoder (Kim et al., 2020, 2021; Shaw et al., 2018) as VITS (Kim et al., 2021). Consistent with VITS text processing, blank tokens are interspersed within the sequence. The first blank token is replaced with a placeholder token to carry utterance-level quality information, as described below.
Since utterance-level TQL is a single scalar that carries no positional information, we additionally incorporate sinusoidal absolute positional encoding (APE) (Vaswani et al., 2017) as an auxiliary feature to capture potential position-dependent error patterns. Unlike the positional encoding used within multi-head self-attention layers (which operates on query–key relationships), our APE is applied directly to the input embeddings before the transformer layers.
The sinusoidal positional encoding is computed for each position and dimension index with embedding dimension :
To allow the model to adaptively determine the importance of positional information, we introduce a learnable scaling coefficient (initialized to 1.0) that modulates the positional embedding:
The position enhanced embedding is then computed by adding to the token embeddings.
We hypothesize that transcription quality may exhibit position-dependent patterns, for example, ASR systems might show systematic differences in recognition accuracy at sentence boundaries, word initial positions, or specific phonetic contexts. Section 6.2 empirically analyzes the learned positional scaling behavior and the interaction between positional encoding and quality supervision.
We apply different feature alignment strategies depending on the quality representation configuration. For utterance-level labels alone, is broadcast to match the text sequence length. For character-level labels alone, each element in is replicated such that every character and its subsequent blank token in share the same quality value, while the placeholder receives a quality label of 1.0. For combined utterance- and character-level representations, we follow the character-level alignment and set the placeholder’s quality to . We encode and using linear projection layers to produce embeddings and , respectively. These quality embeddings are combined with text and positional embeddings via element-wise addition before being fed into the multi-head self-attention layers.
3.4 TQL in training and controllable inference
Building on the quality-aware representations described above, we now explain how TQL enables both quality-aware training and quality conditioned inference.
During training, by incorporating quality embeddings into the linguistic encoder alongside text embeddings, the model learns to generate quality-aware linguistic representations. These representations encode not only the textual content but also quality specific patterns, allowing the model to learn mappings that correlate transcription quality with corresponding acoustic synthesis characteristics. High-quality labels guide the model to learn robust text to acoustic mappings, while low-quality labels help the model adapt to degraded transcription patterns.
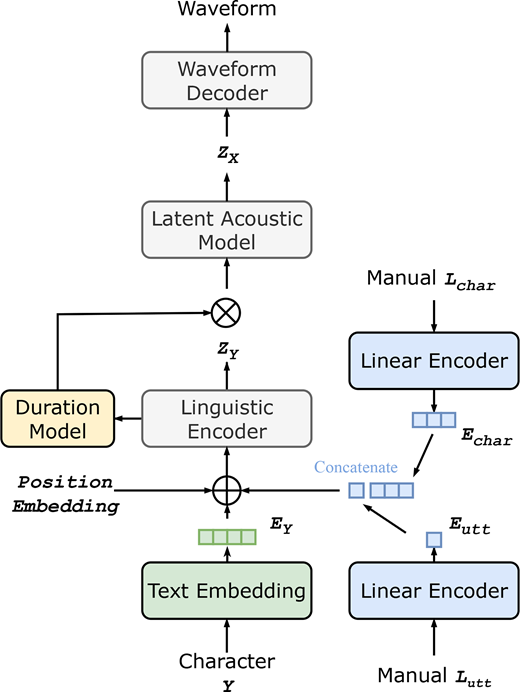
During inference, we exploit this quality-aware learning for quality conditioned synthesis. By setting both and to high values, we signal the linguistic encoder to produce representations characteristic of high-quality transcriptions. The acoustic model, conditioned on these quality-enriched linguistic features, generates speech that faithfully follows the input text. Importantly, TQL is treated as a controllable conditioning variable rather than an estimated latent; during inference, we manually specify high TQL values to guide synthesis toward high-quality behavior.
3.5 Implementation
Figures 2 and 3) illustrate the training and inference architectures of our proposed method. Our model builds upon DVT (Yasuda and Toda, 2023), a diffusion-based latent variable TTS framework, comprising a linguistic encoder, duration model, latent acoustic model and waveform model. The linguistic encoder converts character embeddings into hidden sequences , which the duration model expands to match the target acoustic length. The latent acoustic model uses diffusion to predict acoustic representations conditioned on linguistic features, and the waveform model decodes into audio. Prior work (Feng et al., 2026, 2024) has shown that diffusion-based acoustic models can generate coherent speech even when conditioned on degraded linguistic features, suggesting an inherent capacity to balance text conditioning against the learned speech distribution. TQL leverages this property by embedding explicit reliability signals within . Although TQL is injected at the encoder level, it effectively informs the acoustic model about the trustworthiness of the text condition and promotes quality-aware synthesis behavior. During inference (Figure 3), TQL is set to high values as described in Section 3.4.
4. Experimental conditions
4.1 Simulated ASR noisy transcriptions and training data
We created controlled noisy transcription conditions by introducing random background noise into high-quality speech samples to create degraded speech of varying quality, which was then processed by an ASR model to generate noisy transcriptions. In this simulation, we used high-quality speech from LJSpeech corpus (Ito and Johnson, 2017) and environmental noise from DEMAND data set (Thiemann et al., 2013). Speech samples were randomly paired with noise samples and mixed according to a randomly assigned signal-to-noise ratio (SNR) to produce degraded speech. Following previous study (Feng et al., 2024; Seki et al., 2023), we set the SNR range to [−20, 0]. Finally, a pre-trained Transformer-based ASR model [1] built with the ESPnet toolkit (Watanabe et al., 2018), trained on LibriSpeech with BPE tokenization, transcribed the degraded speech, producing noisy transcriptions. Details of the noisy transcriptions are provided in Table 1.
In our experiments, we used character text representations and applied pre-processing to all transcriptions, including lower casing, removing punctuation and normalizing numbers, ordinals and monetary units. Following the controlled experimental paradigm established in prior studies (Feng et al., 2026, 2024), we used the original high-quality recordings from LJSpeech for training with a single speaker, single data set configuration. This simplified setup is motivated by the difficulty of tracing synthesis errors back to specific causes in training data: when multiple noise sources co-occur (e.g. audio degradation, speaker variability and transcription errors), attributing observed synthesis behavior to any single factor becomes intractable. By controlling these variables, observed differences can be attributed directly to the proposed quality supervision mechanism. We constructed two parallel data sets by pairing these high-quality recordings with either clean transcriptions or ASR-generated noisy transcriptions as described in Table 1. Each data set was divided into training, validation and test sets with sample sizes of 12,500, 100 and 250, respectively. For evaluation, we merged both test sets to create a balanced test set of 500 samples total, ensuring equal representation of both transcription conditions. This balanced approach enabled thorough assessment of model robustness under diverse input conditions.
4.2 Transcription quality labels
For CTC score computation, we used a separate Transformer-based hybrid CTC/Attention ASR model [2] from ESPnet (Watanabe et al., 2018), trained on the WSJ corpus with character-level tokenization (CTC weight 0.3, 12 layer encoder, output dim. 256). We used a character-level ASR model for CTC computation because TQL requires per-character alignment scores, which are directly available from character-level CTC outputs. The BPE-based ASR model used for transcription generation (Section 4.1) operates at the subword level and does not provide character-level CTC scores suitable for TQL derivation. Although this model is trained with joint CTC/Attention objectives (Watanabe et al., 2017), we computed alignment scores using only the CTC log posteriors from the encoder output. Under the CTC formulation, frame-level outputs are conditionally independent given the encoder states (Graves et al., 2006), meaning that CTC scores reflect purely acoustic evidence without incorporating inter-label dependencies. In contrast, the attention decoder does not make such conditional independence assumptions and implicitly combines acoustic, lexicon and language model information (Watanabe et al., 2017), which could assign high scores to linguistically fluent but acoustically mismatched text. Since TQL aims to assess transcription-speech correspondence, CTC scores, which directly measure how well the given text aligns with the observed speech signal without linguistic bias are more suitable for this purpose.
Using this model, we aligned transcriptions with speech in both the clean and noisy transcription condition data sets, obtaining CTC scores for each character. Following the pre-process described in Section 3.2, we processed the CTC score sequence as follows: (i) Utterance-level TQL (), we applied a binarization process to the CTC score sequence using a threshold of (Seki et al., 2023; Takamichi et al., 2021) and then computed the mean value. (ii) Character-level TQL (), we compressed the CTC score values into the range [−20, 0) using a threshold of . This threshold was empirically determined by analyzing the distribution of CTC scores across the training data, where very few scores fell below −20, ensuring the threshold effectively captures the meaningful quality spectrum while excluding outliers. The scores were then normalized to obtain the final character-level quality labels.
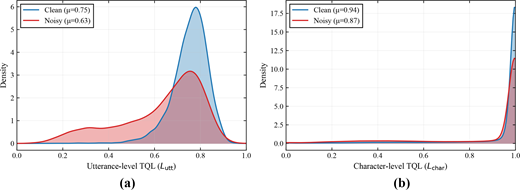
Figure 4 shows the TQL distributions for clean and noisy transcription conditions across both granularities. At the utterance level, clean transcriptions exhibit a concentrated distribution with , while noisy transcriptions show a more dispersed distribution with . At the character level, both conditions are concentrated near 1.0, but noisy transcriptions exhibit a more pronounced tail toward lower values ( vs ). These distributions confirm that TQL effectively captures transcription quality differences, with noisy transcriptions yielding consistently lower quality scores.
4.3 Model configuration and training settings
Following the DVT-based framework described in Section 3.5, we detail the specific model configuration and training settings used in our experiments. The linguistic encoder employs six transformer modules, each with a self-attention layer (hidden dim. 192) and feed forward layer (hidden dim. 768). TQLs are encoded via a two layer MLP with SiLU activation (Elfwing et al., 2018). We incorporate APE (Vaswani et al., 2017) with a learnable scaling coefficient (initialized to 1.0), allowing the model to adaptively weight positional information. Table 2 summarizes the encoder architecture.
We followed the original DVT training configuration (Yasuda and Toda, 2023), utilizing a pre-trained waveform model with frozen parameters, ensuring that only the linguistic encoder, duration model and latent acoustic model are trained. No additional pre-training alignment was applied. In the latent acoustic model, we set the number of diffusion steps to 100 and sample diffusion time uniformly. Training was conducted on an NVIDIA Tesla V100 GPU with a batch size of 64 and learning rate decay until convergence.
We trained two baseline models: Clean Model Baseline (trained on clean transcriptions) and Noisy Model Baseline (trained on noisy transcriptions). In addition, we implemented model variants with different TQL configurations, each trained on noisy transcriptions with varying feature combinations. To investigate whether positional information interacts synergistically with quality supervision, we evaluate APE both in isolation and in combination with different TQL granularities (utterance-level, character-level and combined), which allows systematic analysis of how positional and quality features contribute to synthesis stability. Model details are provided in Table 3.
5. Experimental evaluation
5.1 Evaluation conditions
We conducted objective synthesis accuracy evaluation and subjective naturalness evaluation to assess the proposed TQL method. Our primary goal is to verify whether the synthesized speech accurately follows the input text, we refer to this as synthesis accuracy, measured by comparing ASR-recognized output against the input transcription.
To comprehensively evaluate our method, we constructed a balanced test set of 500 samples containing equal representation from the clean transcription test set (250 samples) and the noisy transcription test set (250 samples) as defined in Table 1. This design enables assessment of model behavior across diverse input quality conditions.
We assessed synthesis accuracy using automatic speech recognition (ASR) (ČCernák et al., 2009; Taylor and Richmond, 2021), with character error rate (CER) and word error rate (WER) as metrics. We used the same ASR model used for noisy transcription generation (Section 4.1); although this introduces potential evaluation bias, all models are assessed under identical conditions, ensuring fair comparison. For TTS evaluation, the ground truth for CER/WER calculation is always the input transcription used for synthesis.
For naturalness evaluation, we conducted a five-point mean opinion score (MOS) test to assess synthesized speech naturalness. We selected four proposed models along with baseline models for evaluation. Each model generated 300 samples from the balanced test set (150 from each transcription condition), divided into 30 groups of 10 samples each. We recruited 30 workers from Amazon Mechanical Turk to evaluate the samples. Each worker was assigned one group and evaluated samples from that group across all models plus ground truth references from LJSpeech, totaling 70 samples per worker.
During synthesis, we set both utterance- and character-level TQL to 0.99, corresponding to high-quality transcription labels in training, ensuring the model operates at its highest synthesis quality during inference.
5.2 Synthesis accuracy results
Table 4 presents the synthesis accuracy results on the balanced test set.
The Clean Model Baseline achieves the highest synthesis accuracy (5.2% WER), as it faithfully reproduces the input text regardless of whether the input contains errors. However, the Noisy Model Baseline exhibits substantial degradation (15.9% WER), despite the diffusion model’s inherent robustness. Notably, this performance is worse than the results reported in our prior work (Feng et al., 2024), which evaluated exclusively on clean-style text inputs and achieved lower error rates. This comparison demonstrates that training on noisy transcriptions alone, without explicit quality supervision results in unstable synthesis when evaluated on diverse input conditions.
All six TQL-based models show significant improvements over the Noisy Model Baseline. Among non-APE variants, the best performance is achieved by the model with combined utterance and character TQL (w/ UTT+CHAR TQL), reaching 8.4% WER. This represents a 47% relative reduction compared to the baseline result of 15.9%. This substantial improvement validates our hypothesis that explicit quality supervision enables models to learn quality-aware representations and maintain stable synthesis.
Ablation analysis reveals complementary effects: utterance-level TQL (10.4% WER) and character-level TQL (9.6% WER) each provide improvements, with their combination yielding the best results (8.4% WER). This suggests that both global and local quality information contribute to synthesis stability.
Incorporating APE shows marginal further improvements. Among APE enhanced variants, the model with combined TQL (w/ APE+UTT+CHAR-TQL) achieves the best performance of 8.3% WER, representing a modest 1.2% relative improvement over its non-APE counterpart.
It is worth noting that APE alone without quality labels degrades performance (17.1% vs 15.9% baseline), suggesting that positional information without quality cues may interact suboptimally with noisy transcriptions. However, when combined with TQL, APE provides measurable benefits. This pattern suggests that positional encoding requires quality supervision to be effective, possibly because position dependent error patterns are subtle and only become useful when contextualized by explicit quality labels. The marginal improvement (8.3% vs 8.4% WER) indicates limited practical impact, though Section 6.2 provides detailed analysis of the learned positional scaling behavior to further investigate this interaction.
5.3 Naturalness results
Table 5 presents the naturalness evaluation results. The Clean Model Baseline achieves MOS of 3.90 ± 0.09, approaching the ground truth quality (4.01 ± 0.09). The Noisy Model Baseline exhibits degradation to 3.55 ± 0.13, reflecting the impact of training on noisy transcriptions. The proposed models show varying naturalness performance. The model w/ UTT+CHAR TQL achieves the highest naturalness score of 3.66 0.10, representing a modest improvement of 3.1% relative to the Noisy Model Baseline. However, this difference is small (0.11 points) and not statistically significant (Mann–Whitney U test, ). Models incorporating APE show comparable naturalness (3.57–3.59) with no statistically significant differences among them (, Mann–Whitney U test).
Note that while TQL-based quality supervision primarily targets transcription quality and text-speech alignment, naturalness is more closely related to prosodic features (rhythm, intonation, stress) that are less directly affected by character-level transcription errors. These results indicate that while the proposed method significantly enhances synthesis stability (47% WER reduction), its impact on perceptual naturalness is limited. This suggests that TQL primarily addresses synthesis accuracy rather than perceptual quality enhancement, which aligns with its design goal of guiding the model toward its high-quality synthesis behavior.
6. Further analysis
To gain deeper insight into TQL’s behavior and the model’s learned representations, we conduct three further analyses. First, we examine how varying TQL values at inference time affects synthesis quality, revealing distinct response patterns across TQL granularities (Section 6.1). Second, we analyze the learned positional encoding scaling coefficient to understand the interaction between positional and quality features (Section 6.2). Third, we evaluate synthesis performance separately across different input text styles to assess robustness under varying conditions (Section 6.3).
6.1 Inference quality label settings
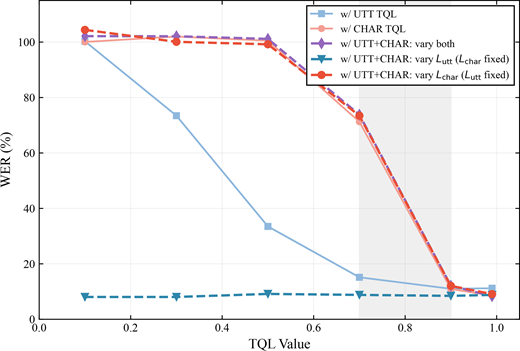
To investigate how inference-time TQL values affect synthesis quality, we systematically varied TQL parameters from 0.1 to 0.99 across five experimental configurations, as shown in Figure 5. For single-modality models, we swept the utterance-level TQL (w/ UTT TQL) and character-level TQL (w/ CHAR TQL) independently. For the dual-modality model (w/ UTT+CHAR TQL), we evaluated three sweep strategies: varying both parameters simultaneously, varying only with fixed at 0.99, and varying only with fixed at 0.99.
The results reveal two contrasting response patterns. Character-level TQL exhibits a sharp cliff effect: the three configurations that sweep character-level TQL (w/ CHAR TQL, w/ UTT+CHAR: vary , and w/ UTT+CHAR: vary both) produce nearly identical curves, with WER remaining above 99% for TQL 0.5, dropping to 71.3%–73.8% at TQL = 0.7, and sharply decreasing to 10.9%–12.1% at TQL = 0.9. In contrast, utterance-level TQL shows a gradual degradation pattern: the w/ UTT TQL curve decreases progressively from 100.3% at TQL = 0.1%–33.5% at TQL = 0.5 and 15.2% at TQL = 0.7.
In the dual-modality model, when is fixed at 0.99, varying has virtually no effect on synthesis accuracy: WER remains within 8.1%–9.2% across all values, even when is set as low as 0.1. This indicates that character-level TQL is the decisive factor for synthesis accuracy in the dual-modality model, while utterance-level TQL becomes redundant for inference-time control when character-level quality is guaranteed.
These contrasting behaviors can be explained by the training data TQL distributions shown in Figure 4. Character-level TQL values are concentrated near 1.0 in both clean () and noisy () conditions, meaning the model rarely encounters character-level TQL values below approximately 0.7 during training. When such out-of-distribution low values are provided at inference, the model lacks learned behavior for these conditions, resulting in the observed cliff effect. In contrast, utterance-level TQL exhibits a wider distribution ( for clean, for noisy), providing the model with broader exposure to intermediate values during training. This wider training coverage enables the model to produce a more gradual, interpolated response across the full TQL range. The cliff threshold at approximately 0.7–0.9 for character-level TQL corresponds to the lower boundary of the training distribution, further supporting the link between training data coverage and inference time behavior. From a modeling perspective, this cliff effect is consistent with prior findings that diffusion-based TTS models tend to reduce their reliance on text conditioning when it becomes unreliable (Feng et al., 2026, 2024). TQL explicitly triggers this behavior: low values function as a signal for the model to disregard the text input, effectively pushing it toward unconditional generation. Since the model was not trained under such extreme conditions, this transition manifests as synthesis collapse rather than coherent text independent speech.
At high TQL values (0.9), all five configurations converge to WER levels between 8.4% and 11.2%, supporting our choice of setting TQL to 0.99 during inference as an effective strategy for achieving stable synthesis quality.
6.2 Position encoding alpha parameter analysis
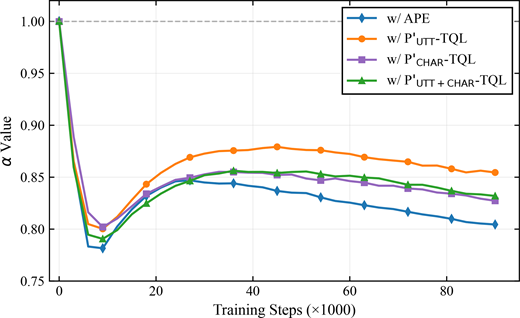
As discussed in Section 3.3, APE was incorporated to capture potential position dependent error patterns, with the learnable coefficient indicating how much the model relies on positional information. Figure 6 shows the evolution of during training across configurations.
The converged values reveal two patterns. First, all three TQL configurations converge to higher (–) than the APE-only configuration (), indicating that explicit quality supervision enables the model to leverage positional cues more effectively. Without quality context, the APE-only model derives less benefit from positional information, resulting in a lower . Second, within the TQL configurations, utterance-level TQL converges to the highest , while character-level TQL yields lower values ( for CHAR-TQL, for UTT+CHAR-TQL). This is consistent with the nature of each representation: utterance-level TQL carries no positional information, requiring stronger reliance on APE, whereas per-character quality labels implicitly encode positional information, partially fulfilling the role of positional encoding.
Despite these differences, APE alone does not improve synthesis performance (17.1% vs 15.9% WER in Table 4), and the gap between the best TQL model with and without APE is minimal (8.3% vs 8.4% WER), confirming that TQL is the primary driver of improvement.
6.3 Evaluation on diverse input styles
Our balanced test set evaluation demonstrates substantial improvements in synthesis stability, with our best model achieving 8.4% WER compared to 15.9% for the baseline, a 47% relative reduction. When comparing our balanced test results to prior work that evaluated solely on clean-style text inputs (Feng et al., 2024), we observe that mixed inputs present greater challenges for synthesis. This suggests that comprehensive evaluation protocols using diverse input styles are essential for accurately assessing model robustness in deployment scenarios.
A detailed breakdown of synthesis performance by input text style reveals additional insights. Table 6 presents synthesis accuracy results separately for samples from the clean transcription test set (Clean-TS) and the noisy transcription test set (Noisy-TS). It is important to note that Clean-TS samples tend to have higher linguistic complexity, including longer sentences and rarer vocabulary, while Noisy-TS samples are on average simpler. This complexity difference should be considered when interpreting the results, as it may partially explain why the Clean Baseline achieves lower error rates on Noisy-TS samples despite them being derived from noisy transcription processes.
The Noisy Baseline exhibits markedly different performance between input conditions, with Clean-TS achieving 11.3% WER while Noisy-TS results in 20.4% WER, an 80% relative increase. In contrast, the TQL model shows more consistent performance (Clean-TS: 10.1% vs Noisy-TS: 6.6%). This variable behavior suggests that models trained on mixed quality data without explicit quality supervision may exhibit unstable synthesis patterns. Our explicit quality supervision approach appears to mitigate this instability, contributing to the robust average performance reported on the balanced test set in Section 5.
To further investigate the factors contributing to this variable synthesis behavior, we analyze the linguistic encoder’s embedding space across different model configurations.
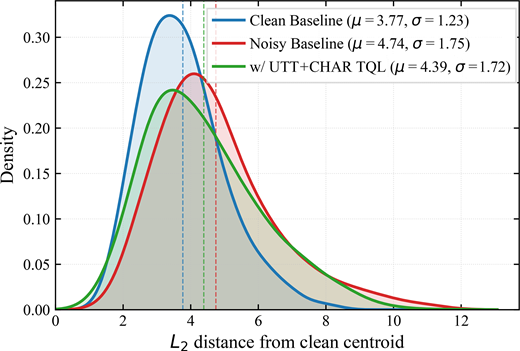
Figure 7 presents the distribution of per token distances from the clean centroid across three model configurations. For each character type, we compute the mean embedding vector across all Clean-TS instances as the clean centroid, then measure the distance from each individual Noisy-TS token to its corresponding centroid. To ensure balanced representation across character types, each of the 26 character types is capped at 200 instances per model.
The results reveal distinct patterns across model configurations. The Clean Baseline (, ) serves as the upper bound, representing the tightest embedding distribution around clean centroids. The Noisy Baseline shows the largest mean distance () and highest variance (), indicating that training on noisy transcriptions without quality supervision leads to larger and more inconsistent representation deviations. The TQL model (, ) substantially reduces the distance compared to the Noisy Baseline, closing approximately 36% of the gap toward the Clean Baseline profile.
These findings help explain the variable synthesis behavior observed in Table 6. The Noisy Baseline’s broader distribution and pronounced right tail indicate that training on noisy transcriptions without quality supervision produces a wider range of embedding deviations, including outlier tokens with substantially larger shifts. This inconsistency in internal representations may contribute to the variable synthesis performance observed across different input conditions. In contrast, the TQL model suppresses this broad spread and shifts its distribution toward the Clean Baseline profile, suggesting that explicit quality supervision yields more consistent text to embedding mappings. These more stable representations likely underlie the robust synthesis performance of the TQL model on the balanced test set.
7. Discussion
Our experiments show that explicit quality supervision through TQL enables quality-aware TTS behavior under controlled conditions. Several aspects warrant discussion regarding the scope and generalizability of these findings.
Our approach relies on CTC scores from a pre-trained ASR model as quality indicators, which may be affected by domain mismatch between the ASR training data and target speech. In addition, we use a fixed TQL value (0.99) at inference throughout our experiments. While Section 6.1 demonstrates that high TQL values consistently yield stable synthesis, exploring adaptive TQL prediction based on input characteristics could further enhance flexibility. The preprocessing overhead for computing CTC scores (approximately 4.4 min per 10 h of audio on a V100 GPU) is modest for offline data set preparation.
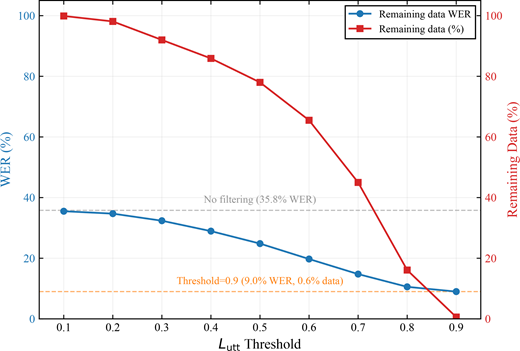
It is also worth examining the nature of CTC scores as quality indicators and their suitability for different uses. As noted in Section 2.3, CTC scores are conditional probabilities under a specific ASR model, functioning as relative indicators rather than absolute quality measures. Figure 8 illustrates this limitation by examining the trade off when is used as a hard threshold for data filtering. Moderate thresholds yield limited quality improvement, at threshold 0.5, 78.0% of data is retained but WER only decreases from 35.8% to 24.8%. Aggressive thresholds substantially reduce the data set, at threshold 0.7, only 45.0% of data remains (5,618 samples), yet WER is still 14.8%. At threshold 0.9, the data set is reduced to just 81 samples (0.6%), while the remaining transcriptions still exhibit 9.0% WER. This confirms that CTC scores lack the precision required for hard binary decisions. Nevertheless, as our experiments demonstrate, these imprecise but informative signals can be effectively utilized through soft conditioning. Prior work (Feng et al., 2026, 2024) has shown that TTS models exhibit implicit robustness to noisy transcriptions, and TQL builds on this foundation by providing explicit quality information that transforms this implicit capability into controllable quality-aware synthesis. It should be noted that this work aims to validate whether explicit quality supervision can enable such controllable behavior, rather than to identify an optimal quality measure; the experimental results confirm that CTC-based TQL is sufficient for this purpose.
Our experiments are conducted on the LJSpeech corpus with a single English female speaker, and we employ simulated noisy transcriptions created by mixing clean speech with background noise before ASR processing. This controlled experimental setup follows the paradigm established in prior studies (Feng et al., 2026, 2024), which isolates the effect of transcription quality from audio quality. We adopted this simplified configuration because tracing synthesis errors back to their specific causes in training data is inherently difficult TTS synthesis artifacts such as skipping, repetition and mispronunciation can arise from multiple interacting factors (audio quality, speaker inconsistency, transcription errors, etc.), making attribution intractable when these factors co-occur. Since our approach of automatically transforming CTC scores into explicit quality labels for TTS training has not been previously explored, we prioritize validating the mechanism and understanding its behavior under controlled conditions, which provides the necessary foundation for subsequent generalization studies. While this approach enables rigorous validation of the TQL method under challenging conditions with relatively high error rates (35.8% WER), naturally occurring ASR errors in real-world scenarios may exhibit different distributions. Extending this work to multi-speaker settings, other languages and data sets containing authentic transcription errors represents important directions for validating the generalizability of explicit quality supervision in TTS training.
8. Conclusions
We proposed TQL, automatically derived from CTC scores. Under controlled experimental conditions, we investigated whether explicit quality supervision can enable TTS models to learn quality-aware representations and achieve stable, controllable synthesis. Building on the implicit robustness observed in prior studies, our approach provides explicit quality information during training, and the resulting quality conditioned behavior can be leveraged at inference.
Experimental validation on a balanced test set containing diverse transcription quality conditions demonstrates significant improvements: our best TQL model (without auxiliary positional encoding) achieves 8.4% word error rate compared to 15.9% for the baseline trained on noisy transcriptions, representing a 47% relative reduction. While synthesis accuracy gains are substantial, naturalness improvements remain modest (MOS 3.66 vs 3.55 baseline), indicating that the method primarily enhances synthesis stability rather than perceptual quality.
These findings suggest that explicit quality supervision offers a promising approach to improving TTS robustness in scenarios with variable transcription quality. Future work will explore developing adaptive mechanisms for predicting optimal TQL values during inference based on input characteristics, and validating the approach on real-world data sets containing naturally occurring transcription errors.