Major depressive disorder (MDD) is a globally prevalent mental illness. Functional connectivity (FC) analysis based on resting-state functional magnetic resonance imaging resting-state fMRI (rs-fMRI) provides new opportunities for neurobiological mechanism research and objective diagnosis of MDD. However, existing methods are prone to overfitting when handling high-dimensional FC data and predominantly rely on single-feature learning strategies, which limits their ability to fully leverage synergistic information between local connectivity patterns and global network features. To address these challenges, this study proposes a multi-task dual-branch denoising autoencoder (MT-DBDAE) framework for automatic MDD diagnosis. The framework uses a heterogeneous dual-pathway module (HDM) that integrates FC transformer and graph attention networks (GATv2) to achieve multi-scale feature extraction, applies hidden space mixup technology for data augmentation in latent space and finally jointly optimizes three objectives – classification, reconstruction and contrastive learning – through a multi-task learning strategy. Nested cross-validation experiments were conducted on the large-scale multi-center resting-state (REST)-meta-MDD data set, achieving favorable classification performance on both the CC200 and anatomical automatic labeling atlases. This effectively alleviates issues of high-dimensional FC data and medical data scarcity, providing an effective tool for objective MDD diagnosis.
1. Introduction
Major depressive disorder (MDD) is a globally prevalent psychiatric disorder characterized by persistent depressed mood, cognitive dysfunction and significant suicidal tendencies as core symptoms (Mulders et al., 2015). According to the World Health Organization, MDD affects about 300 million people each year and is a leading cause of disability (Lim et al., 2018). Its mortality rate is 60–80% higher than the general population (Cuijpers et al., 2014; Walker et al., 2015). In recent years, the rapid development of neuroimaging technology has made significant contributions to understanding the pathological mechanisms of brain diseases while also providing new avenues for exploring the neurobiological mechanisms of MDD and developing objective biomarkers. In this context, artificial intelligence (AI)-based automated classification is considered a promising tool for the diagnosis of MDD.
Resting-state functional magnetic resonance imaging resting-state fMRI (rs-fMRI) can capture spontaneous brain activity patterns in individuals under non-task-specific conditions, revealing intrinsic functional connectivity (FC) networks that reflect baseline brain organization. In recent years, FC analysis based on rs-fMRI has been recognized as a powerful tool for identifying potential biomarkers of various brain diseases [such as MDD and Alzheimer’s disease (AD)] (Drysdale et al., 2017; Li et al., 2018; Liu et al., 2023, 2024; Zhang et al., 2023). In MDD research, FC analysis has revealed FC abnormalities in key brain networks [such as the default mode network (DMN) and central executive network (CEN)] (Mulders et al., 2015), indicating that these abnormal patterns have potential as clinical diagnostic biomarkers (Yang et al., 2021).
In recent years, machine learning (ML) and deep learning (DL) technologies have opened new pathways for FC-based automatic MDD classification. Traditional ML methods, such as support vector machine, logistic regression typically require feature selection and dimensionality reduction to handle high-dimensional FC data and achieve reasonable classification performance (Dadi et al., 2019; Zhang et al., 2022a; Zhu et al., 2021). DL methods can automatically learn complex FC representations through multi-layer nonlinear transformations and have attracted widespread attention in fMRI-based brain disease classification (Deng et al., 2022; Jinji, 2022; Shan et al., 2022). Early CNN applications like BrainNetCNN (Kawahara et al., 2017) and its improvements such as BrainNet-GA CNN (Oh et al., 2022) have shown promising results in brain network analysis. However, most CNN-based methods ignore the spatial structure and local connectivity patterns between region of interests (ROIs), overlooking the non-Euclidean topological relationships in brain networks (Noman et al., 2024).
The emergence of graph neural networks (GNNs), transformers and diffusion architectures provides new perspectives for processing brain FC data. GNNs can effectively model non-Euclidean topological relationships between brain regions and capture complex patterns in graph-structured data (Dosenbach et al., 2010; Scarselli et al., 2008; Sun et al., 2024). For example, X.Li et al. (2021) proposed BrainGNN based on graph convolutional networks (GCNs) to learn brain functional network representations, demonstrating superior performance on various neural and cognitive data sets. Transformer architecture can naturally model dependencies between ROIs through self-attention mechanisms and has been used to analyze FC variations (Bullmore and Sporns, 2009; Sporns, 2018). For instance, Kan et al. (2022) proposed BrainNetTF, attempting to use transformers for joint learning and classification within a unified framework. However, pure transformers require sufficient data training, which is a significant challenge in medical scenarios (Zhang et al., 2022b). Diffusion models can participate in medical image processing by generating synthetic data to augment limited training data sets. Hierarchical diffusion models (HCDM), such as the HCDM proposed by Tang et al. (2025), demonstrated strong generative capabilities through multi-scale conditional generation and hierarchical control. Brain-net-diffusion adapts transformer-based latent diffusion models specifically for fMRI data, achieving accuracy improvement for autism spectrum disorder classification (Zhao et al., 2025). Nonetheless, such approaches require substantial computational resources and careful parameter tuning.
Although these methods have achieved certain progress in brain disease classification, existing research still faces several key challenges:
High-dimensional FC data easily leads to model overfitting, while existing methods lack effective regularization and data augmentation strategies to adequately mitigate this problem; and
Most methods adopt single-feature learning strategies and cannot simultaneously account for collaborative modeling of local connectivity patterns and global network features.
To address these challenges, we propose a multi-task dual-branch denoising autoencoder (MT-DBDAE) framework for MDD classification. Our framework introduces three innovations: First, we propose heterogeneous Fisher-score masking combined with learnable dual-pathway fusion. Heterogeneous masking preprocesses inputs according to each pathway’s requirements and then by learnable gating dynamically fuses both pathways to balance global and local information for MDD classification. Second, we adopt an ROI-as-token formulation inspired by vision transformers (Dosovitskiy et al., 2021). For each ROI, we linearly project its ROI-wise FC vector, the corresponding row of the FC matrix, into a patch-like token embedding. Finally, we apply hidden-space mixup combined with latent-space reconstruction and adaptive multi-task learning, which provides synergistic regularization that outperforms traditional data augmentation by operating at the semantic level rather than the input level, reducing overfitting in the limited-data medical imaging regime.
The main innovations of this study include:
We propose heterogeneous Fisher-score masking and learnable dual-pathway fusion. The Transformer branch uses a higher threshold (70%–80%) to retain feature diversity for global attention. The GNN branch uses a lower threshold (30%–50%) to ensure edge quality for local aggregation. On the resting-state (REST)-meta-MDD data set with 5-fold cross-validation, our model attains 69.06% accuracy and an area under the curve (AUC) of 74.35%, surpassing all baselines.
We introduce hidden-space mixup in the latent space and train with a multi-task learning to strengthen regularization. Ablation results show that removing either mixup and the multi-task loss reduces accuracy to 64.37% and AUC to 70.82%, confirming effective overfitting mitigation and improved MDD diagnosis.
2. Related work
2.1 Resting-state functional magnetic resonance imaging in major depressive disorder research
Resting-state fMRI (rs-fMRI) is a noninvasive technique that captures spontaneous brain activity without task stimulation, offering a window into the neural basis of MDD. FC matrices quantify temporal synchrony among brain regions and provide candidate biomarkers for MDD neurobiology (Yang et al., 2021). However, conventional statistical analyses rely on strong priors and often fail to exploit the complex structure of high-dimensional FC data. Traditional ML also depends on hand-crafted feature engineering, including feature selection and dimensionality reduction (Zhu et al., 2021). These limitations motivate DL approaches with stronger representation-learning capacity.
2.2 Graph Neural Networks-based functional connectivity analysis
In recent years, GNNs have been extensively studied and have demonstrated strong modeling capabilities across a wide range of domains (Carlo et al., 2025; Ju et al., 2025). Given the inherent graph-structured nature of brain functional networks, GNNs provide a more natural modeling approach for processing brain functional network data. GNNs can directly perform information propagation and aggregation operations on brain network graphs, effectively capturing complex dependencies between ROIs (Bessadok et al., 2022).
GCNs were among the first GNN variants applied to brain network analysis. Qin et al. (2022) explored the application of GCN in MDD recognition, using spectral graph convolutional filters to convolve graphs and learn low-dimensional representations of networks. Xing et al. (2019) proposed dynamic spectral graph convolutional networks for early mild cognitive impairment diagnosis using fMRI. Kazi et al. (2022) proposed combining differentiable graph modules with GCN for AD diagnosis. Li et al. (2021) designed novel ROI-aware graph convolutional layers that use topological and functional information from fMRI, along with ROI selection pooling layers (R pooling) to highlight important ROIs.
2.3 Transformer-based functional connectivity analysis
Transformer architectures, due to their powerful sequence modeling capabilities and self-attention mechanisms, have also been introduced into brain network analysis in recent years. They provide a more natural way to model relationships between ROIs based on attention for brain networks, offering new perspectives for understanding global brain network patterns.
Recently, Kan et al. proposed BrainNetTF and Dynamic brain Transformer (DRAT), respectively proposing an orthonormal clustering readout operation based on self-supervised soft clustering and orthogonal projection for generating distinguishable cluster-aware node embeddings and informative graph embeddings (Kan et al., 2022) and proposing DART, which combines static and dynamic brain networks for more effective and detailed brain functional analysis (Kan et al., 2023). Bannadabhavi et al. (2023) proposed Com-BrainTF, a hierarchical local-global transformer architecture that learns intra-community and inter-community aware node embeddings for autism spectrum disorder prediction tasks.
Although these methods have achieved certain progress in MDD classification, the following key challenges remain:
Most methods use a single feature-learning strategy and cannot jointly capture local connectivity and global network structure.
The scarcity of medical data makes DL models prone to overfitting and existing methods lack effective regularization and data augmentation strategies.
We address these gaps with MT-DBDAE that fuses a multi-head self-attention pathway with a GATv2 pathway to model global and local patterns. We further use latent-space mixup and multi-task objectives for strong regularization. This design mitigates overfitting and improves automatic MDD diagnosis.
3. Materials and methods
3.1 Data set
The fMRI data used in this study are from the open-access data repository REST-meta-MDD consortium, which is considered the largest public MDD database (Yan and Zang, 2010). This database contains data from 2,428 participants from 25 hospitals, including 1,300 MDD patients and 1,128 healthy controls (HC). We adopted the same data screening steps mentioned in Yan et al.’s paper (Yan and Zang, 2010), selecting 1,642 participants from 17 sites from this data set. Additionally, we added a sample exclusion step to exclude samples with missing ROI signals. Table 1 and Table 2 show detailed statistical information for all participants after using anatomical automatic labeling (AAL) atlas and CC200 atlas and removing samples with missing ROI signals, respectively.
3.2 Data preprocessing
The fMRI data for each subject in the REST-meta-MDD data set underwent standard preprocessing steps provided by the data processing assistant for resting-state fMRI (Yan and Zang, 2010), preprocessing followed the steps described by Yan et al., including removal of initial time points (to eliminate magnetization instability effects), slice timing correction, realignment, spatial normalization to standard templates, regression of noise covariates (including head motion parameters, white matter signals and cerebrospinal fluid signals) and application of 0.01–0.10 Hz band-pass filtering to preserve low-frequency oscillation signals (Yan et al., 2019).
Considering that using different brain atlases may affect classification results, we adopted two different atlases to extract time series for subsequent comparative analysis of classification performance. These two atlases are the CC200 atlas (Craddock et al., 2012), which divides the human brain into 200 regions based on brain function and the AAL atlas (Tzourio-Mazoyer et al., 2002), which divides the brain into 116 regions based on brain anatomical structure.
3.3 Functional connectivity
Based on the time series extracted from the above atlases after preprocessing, a whole-brain FC matrix was constructed for each subject. FC is defined as the temporal correlation of blood-oxygen-level-dependent (BOLD) signal fluctuations between different ROIs (temporal correlation). The Pearson correlation coefficient (PCC) is the most commonly used metric for defining this correlation (Rubinov and Sporns, 2010). The PCC formula used in this study is defined as follows:
where represents the PCC between the i-th and j-th ROIs; and are the BOLD signal values of the i-th ROI and j-th ROI at time point t, respectively; and are the mean values of the BOLD signals of the i-th ROI and j-th ROI over the entire time series, respectively; T is the length of the time series.
3.4 Feature selection method based on fisher score
High-dimensional FC data (, where N is 116 or 200) contains substantial noise and redundant connections, directly training tends to result in model overfitting. We use Fisher discriminant analysis to quantify the inter-class discriminative ability of each FC connection (Supekar et al., 2022) and use its discriminative strength as the basis for feature selection. Due to the symmetry of the FC matrix, we extract its upper triangular part and vectorize it to form a one-dimensional feature vector for subsequent analysis. The Fisher score for each feature can be calculated using the following formula:
where and represent the sample sizes of MDD patients and HCs, respectively; and are the mean values of the j-th feature in both classes of samples; and are the variances of the j-th feature in both classes of samples; is the overall mean of the j-th feature across all samples. The larger the Fisher score, the stronger the discriminative ability of that feature (Gu et al., 2012). However, feature selection requires finding a balance between reducing overfitting risk and retaining effective information: excessive removal of low-scoring features may reduce noise but may also lose potentially useful discriminative information.
This study designs a task-specific feature selection strategy. Specifically, we rank features by Fisher score and retain the top and to create two binary masks. Then, each mask is mapped back to by filling the strictly upper triangle, mirroring across the diagonal and zeroing the diagonal, yielding for the Transformer branch and for the GNN branch. The key innovation lies in the asymmetric threshold design: retains a larger proportion (–) of connections because the Transformer pathway operates via multi-head self-attention, which computes global dependencies across all ROI pairs without locality constraints. This global, sequence-agnostic mechanism requires feature diversity to learn rich long-range dependency patterns. A permissive threshold preserves the information density necessary for effective attention-weight computation across varied ROI combinations. Conversely, retains a smaller proportion (–) because the GNN pathway operates via local graph aggregation, each node’s feature is updated by weighted aggregation from its neighborhood. In high-dimensional spaces, low-magnitude edges introduce noise that disrupts aggregation quality. A strict threshold ensures the graph comprises exclusively high-confidence, class-discriminative edges, improving representation learning.
3.5 Multi-task dual-branch denoising autoencoder
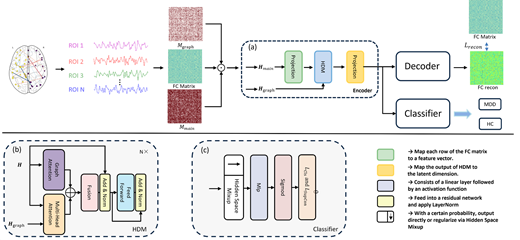
The framework architecture of the MT-DBDAE model is shown in Figure 1. The main input to the model is the FC matrix . By applying two mask matrices to , we obtain two different versions of FC matrices and . Meanwhile, to enhance the model’s robustness, adaptive Gaussian noise is added to during the encoding stage. The noise intensity is dynamically adjusted based on the statistical characteristics of the input data, effectively improving the model’s resistance to data perturbations.
3.5.1 Heterogeneous dual-pathway module.
Heterogeneous dual-pathway module (HDM) is the core component of the encoder, which achieves multi-scale feature extraction of FC data by fusing multi-head self-attention mechanisms and graph attention networks (GAT). This module contains two parallel feature learning pathways that separately capture global dependency relationships and local topological structural information:
Multi-head self-attention pathway: The self-attention mechanism can effectively capture dependency relationships between arbitrary positions in sequences without distance limitations (Vaswani et al., 2017). First, each row of is projected using projection matrix for feature projection to generate , where N is the number of ROIs and is the feature dimension. The self-attention mechanism first generates Query, Key and Value matrices through linear transformations:
where are learnable projection matrices. The attention weights are computed through the dot product between queries and keys and softmax normalization is applied to each row of the matrices. Finally, the obtained attention weights are used to perform weighted aggregation on the value matrices, yielding the self-attention output:
To enhance the model’s expressive capability, multi-head self-attention is used for parallel attention computation:
where is the output projection matrix. Finally, the multi-head output is mapped back to the original feature dimension to obtain .
GATv2 attention pathway: GAT is a neural network architecture specifically designed for graph-structured data (Velikovi et al., 2017), capable of effectively handling irregular graph topological structures. GATv2 improved upon the original GAT by enhancing the model’s expressive capability and dynamic properties through the nonlinear activation transfer of attention mechanisms (Brody et al., 2021). Furthermore, to fully use neighborhood information, GATv2 introduces edge features (such as edge weights) into the attention mechanism, achieving node-wise adaptive aggregation of neighbor information.
Specifically, first, the FC strength is calculated for each ROI feature vector to construct its neighborhood set :
After inputting into GATv2, we concatenate , and and multiply with a transformation matrix W. Then we learn an attention weight vector to transform the activation value of the product to attention coefficients:
where are the i-th and j-th rows of , representing the feature vectors of nodes i and j, respectively, is the linear transformation matrix, is the activation function and is the learnable attention weight vector.
The attention coefficients are normalized using softmax across all neighbors of , i.e. :
Finally, the node’s feature aggregation is obtained:
where K is the number of GAT heads and is the linear transformation matrix based on multi-head. This finally yields .
The outputs of the dual pathways are fused via learnable gating weights and connected through a residual network:
where the gate parameter , and is the sigmoid activation function.
Finally, feedforward network propagation is performed to obtain the HDM module output:
where l is the module layer number and FFN is the feedforward network layer. Multiple HDM modules are stacked to form the main body of the encoder. After the final output undergoes a Flatten operation, it passes through a multi-layer perceptron to map to hidden space.
The latent vector is obtained, which serves as the latent representation for subsequent classifier and decoder classification.
3.5.2 Decoder.
The decoder is responsible for reconstructing the latent representation (after hidden space mixup combination transformation) back to the original FC vector . We use multi-layer perceptrons for decoding:
where and are the weight matrices of the decoder, is hidden layer dimension of the decoder and the latent vector .
3.5.3 Hidden space mixup regularization.
Compared to data augmentation performed at the raw input level, mixing in latent space can generate new and diverse training samples at higher semantic levels, effectively improving the model’s generalization ability (Verma et al., 2019).
During training, we apply hidden-space mixup with probability p. Mixed samples are generated as follows:
where , , S is the number of samples, is the mixing coefficient, following a Beta distribution to ensure diverse mixing characteristics. is the shape parameter of the Beta distribution, controlling the mixing degree.
3.5.4 Classifier.
The classifier uses the latent layer features obtained after mixup (which can be original or mixed latent representations) for classification:
where is the classifier weight matrix, is the bias term, outputting a single logit value. The classifier output passes through the sigmoid function to convert to probability . The final classification decision is obtained through threshold comparison:
where is the classification threshold. We select via grid search on the validation set. We sweep , compute true positive rate (TPR) and false positive rate (FPR) and choose the threshold that maximizes :
Due to the existence of hidden space mixup, the loss function needs to consider both mixed and unmixed samples. For unmixed samples, the standard binary cross-entropy loss is used:
For mixed samples, the classification loss needs to consider the weighted combination of both original sample labels:
where and are the true labels of the two samples participating in the mixture, respectively and is the predicted label for the i-th sample. S is the number of samples and is the corresponding mixing coefficient.
3.5.5 Multi-task joint optimization.
To alleviate the overfitting problem during training, this study adopts a multi-task joint optimization strategy that combines reconstruction loss, classification loss and supervised contrastive loss.
First, the reconstruction loss is introduced as a regularization term to provide a self-supervised signal for the encoder, encouraging it to preserve the primary structural characteristics of the input in the latent space, thereby improving the generalization ability of the representations. The reconstruction loss is defined as follows:
where is the vector obtained by flattening the FC matrix of the i-th sample.
In addition, the model uses the supervised contrastive loss to enhance the intra-class compactness and inter-class separability of representations.
For each sample , denotes the set of samples belonging to the same class as and denotes the set of all samples except itself, is the cosine similarity function and is the temperature hyperparameter.
The final multi-task objective is formulated as follows:
where are the weighting coefficients for each loss term.
We adopt a multi-level joint optimization strategy to better achieve the model’s objectives. Hidden space mixup is used to generate diversified training samples, thereby enhancing the model’s generalization ability. Reconstruction learning provides self-supervised signals to facilitate the acquisition of effective data representations, while contrastive learning reinforces clustering characteristics and promotes clear class boundaries. This integrated approach effectively mitigates overfitting and ensures high-quality representations for MDD diagnostic tasks.
3.6 Implementation details
All experiments in this study were conducted on the following hardware and software environment: operating system Ubuntu 20.04.1 LTS, CPU dual AMD EPYC 7543 32-Core Processor, GPU NVIDIA GeForce RTX 4090, memory supporting NUMA architecture, software environment Python 3.9, PyTorch 2.4.1 (CUDA 11.8). For the model architecture, we stacked 2 HDMs with feature dimension and latent dimension . Hidden-space mixup used Beta distribution parameter with application probability . For the multi-task loss function in equation (26), the reconstruction loss weight and classification loss weight were set as adaptive learnable parameters initialized at 1.0, while the contrastive loss weight was fixed. The temperature parameter in the supervised contrastive loss was . Fisher-score thresholds were determined via grid search on the validation set: for the Transformer branch and for the GNN branch.
4. Results
This study used nested cross-validation to evaluate model performance. Specifically, we used both nested 5-fold cross-validation and nested leave-one-site-out cross-validation schemes. In the nested 5-fold cross-validation, the data set was partitioned into five equally sized subsets. In each iteration, one subset was designated as the external test set, while the remaining four subsets were used for model training and validation. For each external test set, the corresponding training data was further split into five folds, with four folds used for training and one fold for validation, repeated five times. This procedure yielded five external test results, which were then aggregated for performance evaluation. In the nested leave-one-site-out cross-validation, one site’s samples are used as the external test set in each iteration and the remaining sites’ samples are divided into training and validation sets with a ratio 4:1. We treat each site’s samples as an external test set and average the results of them as the final results.
We mainly use accuracy (ACC), sensitivity (SEN), specificity (SPE) and AUC four evaluation metrics to comprehensively evaluate model performance. ACC, SEN, SPE are defined as follows:
where TP, TN, FP and FN represent the numbers of true positives, true negatives, false positives and false negatives, respectively. Sensitivity measures the model’s recognition ability for MDD patients, specificity measures the model’s recognition ability for HC and AUC comprehensively reflects the model’s discriminative ability.
4.1 Comparison with baseline methods
We selected seven traditional ML methods and DL methods as baselines for comparative experiments. Traditional ML methods include support vector machine (SVM), random forest (RF) and logistic regression, which perform classification on original FC matrices. DL methods include ResDAE (Dai et al., 2024), 1DCNN, BrainNetCNN and BrainGNN network architectures. ResDAE uses residual connection-based autoencoders to perform feature learning and reconstruction on the upper triangular part of FC matrices, then uses latent representations for classification; 1DCNN transforms each FC matrix into a one-dimensional vector, which is then used for convolutional processing; BrainNetCNN is a network model specifically designed for processing brain network matrices; and BrainGNN is a graph neural network model specifically designed for brain connectivity network modeling.
Table 3 and Table 4 show the classification experimental results using CC200 and AAL atlas data sets for various methods. From the comparative experimental results, it can be seen that the MT-DBDAE method proposed in this paper achieved the best comprehensive performance on both atlas data sets. On the AAL atlas, MT-DBDAE achieved 67.17% accuracy and a 72.48% AUC value; on the CC200 atlas, MT-DBDAE achieved 69.06% accuracy and a 74.35% AUC value. It is worth noting that MT-DBDAE showed superior performance in sensitivity metrics, obtaining the highest sensitivity scores on both atlases, which is of great significance for early diagnosis of mental disorders.
The leave-one-site-out validation further demonstrates the generalization ability of MT-DBDAE. Leave-one-site-out validation is more stringent than nested 5-fold cross-validation, as it can better reflect true performance capabilities, MT-DBDAE still maintained excellent accuracy and sensitivity performance. On the AAL atlas, MT-DBDAE achieved 65.02% accuracy and 68.83% sensitivity. On the CC200 atlas, accuracy reached 66.59% and sensitivity was 66.21%.
In both types of nested cross-validation. The, ACC and SEN surpass other methods, but the SPE is lower than those of traditional ML models such as SVM. This is because we adopt data-augmentation strategies. These methods improve generalization but may increase false positives, causing some negative cases to be predicted as positive. As shown by the ablation in Table 5, removing these augmentations lowers ACC but raises SPE. In spite of this, MT-DBDAE achieves better overall performance.
Compared to different baseline methods, MT-DBDAE effectively improved model discriminative ability and generalization performance through dual-pathway feature fusion, hidden space mixup regularization and multi-task learning assistance, validating the effectiveness of the proposed method.
4.2 Ablation experiments
To verify the effectiveness of each module, ablation experiments were conducted, with results shown in Table 5. The ablations are organized into three categories: branch-wise fusion, feature selection and regularization mechanisms. The Transformer branch alone achieves only 53.63% accuracy, while the GNN branch alone reaches 60.34%. This synergistic effect validates that global dependencies and local topology are complementary rather than redundant and their joint modeling is necessary for robust MDD classification.
The feature selection strategy proves necessary. Without masking, accuracy is 67.36%. Applying the permissive transformer mask improves to 68.94%, while the GNN mask yields 67.30%. The dual-mask configuration reaches the peak at 69.06%, outperforming any single-mask strategy. This result indicates that each mask is most effective when applied jointly with its counterpart, as a single mask alone cannot fully exploit the complementary inductive biases of the two branches. It also supports the principle that different neural architectures have different information requirements: Transformers benefit from permissive feature selection that preserves input diversity, while GNNs benefit from strict selection that ensures aggregation-edge quality.
Among regularization components, supervised contrastive loss has the largest impact: removing it causes a 4.69% accuracy drop to 64.37%. Hidden-space mixup contributes 1.95% (from 69.06% to 67.11%) and reconstruction loss contributes 1.09% (to 67.97%). Removing both mixup and reconstruction simultaneously yields the same result as removing only contrastive loss, indicating that contrastive learning dominates while mixup and reconstruction provide complementary benefits.
These ablation results collectively demonstrate that MT-DBDAE’s effectiveness arises from the principled integration of complementary design components. The dual-branch architecture with heterogeneous feature masking captures both global and local connectivity patterns in an architecture-aware manner. The multi-task regularization combining mixup, reconstruction and contrastive objectives provides robust protection against overfitting in the limited-data regime typical of medical imaging. Rather than relying on any single component, the model’s strength emerges from their coordinated contribution to representation learning, class separation and generalization.
4.3 Identification of key ROI connectivity patterns for major depressive disorder classification based on Shapley additive explanations analysis
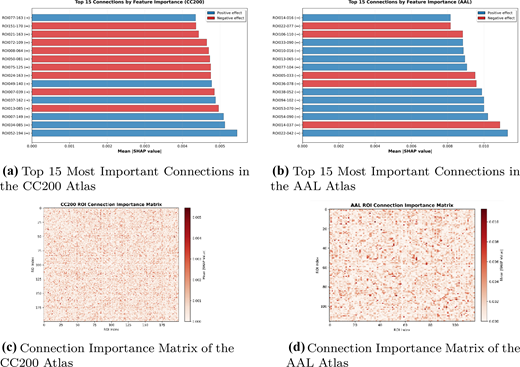
To further analyze the decision mechanism of the MT-DBDAE model and identify key neural biomarkers for MDD classification, this study used the Shapley Additive explanations (SHAP) method (Lundberg and Lee, 2017) to perform importance quantification analysis on the learned FC features. SHAP is based on the Shapley values in game theory and can decompose the contribution of each input feature to the model prediction, offering an effective approach for interpreting DL models in neuroscience research. We conducted analysis on both the CC200 and AAL atlases. Meanwhile, based on the CC200 atlas FC clustering results, this study further mapped the identified functional regions to standard anatomical structures, validating the neurobiological interpretability of the discovered patterns.
As shown in Figure 2, among the 15 most important connections, the left middle frontal gyrus, right angular gyrus and right temporal pole and other multiple brain regions were identified, where the angular gyrus and middle frontal gyrus are important components of the DMN.
DMN is a brain network that is most active during resting states and is mainly involved in self-referential processing, emotional regulation and introspection (Philippi and Koenigs, 2014). FC disruptions between the precuneus and regions such as the prefrontal cortex and hippocampus are directly associated with excessive self-focus and negative cognitive bias in patients with MDD (Kaiser et al., 2015). Meanwhile, the angular gyrus connection abnormalities reflect MDD patients’ deficits in self-reference processing and cognitive integration across multiple functional domains (Gao et al., 2021). At the same time, the precentral gyrus is a key region within the sensorimotor cortex and its abnormal FC suggests impairments in sensorimotor integration among MDD patients. This finding is highly consistent with clinical manifestations of MDD, such as psychomotor retardation, somatic symptoms and altered motor cortical plasticity (Tsujii et al., 2017).
SHAP analysis on the AAL atlas further validated the abnormal neural network patterns associated with MDD. Based on the connection importance ranking, among the 15 most important connections, the connections between the occipital cortex and amygdala, the interhemispheric connection between the triangular part of the inferior frontal gyrus and the left hippocampus, as well as connections between multiple cerebellar subregions, had a substantial impact on classification. The amygdala, a central limbic structure, plays a crucial role in integrating sensory information from the cortex and thalamus (Babaev et al., 2018) and is considered a key structure in emotional response and anxiety circuitry (Duval et al., 2015). Specifically, the amygdala and its connections with other brain regions (such as the hippocampus and olfactory areas) are associated with the emotional dysregulation observed in depression (Chai et al., 2015). Abnormal interhemispheric connections between the triangular part of the inferior frontal gyrus and the hippocampus reveal dysfunction in the memory-executive control network in MDD patients. The hippocampus is responsible for episodic memory encoding, while the prefrontal cortex is involved in executive control and emotional regulation; abnormalities in their connectivity result in cognitive biases and executive dysfunction in MDD patients (Tahmasian et al., 2013). Recent neuroscience research has demonstrated that the cerebellum is involved in cognitive control and emotional processing and also plays an important role in the pathology of MDD (Ma et al., 2013). Additionally, the spatial distribution of connection importance across both atlases indicated that interhemispheric connections were predominant, suggesting a significant imbalance in brain functional lateralization in MDD patients. This dominant pattern of interhemispheric connectivity may reflect impaired bilateral coordination in networks related to emotional regulation, cognitive control and attention (Li et al., 2025).
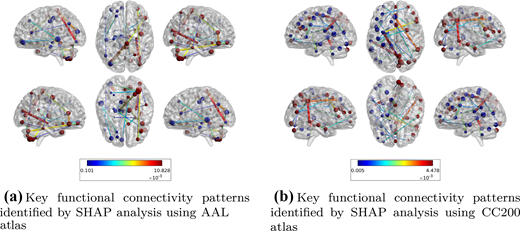
This study further used BrainNet Viewer to visualize the top 30 functional connections with classification contribution (Xia et al., 2013), as shown in Figure 3. The analysis results highly align with MDD-related neuroimaging research findings, validating that the MT-DBDAE model learned biologically meaningful neural connectivity patterns, providing potential neuroimaging biomarkers for more precise MDD diagnosis.
5. Discussion
We successfully constructed a MT-DBDAE framework for MDD automatic classification and validated its effectiveness on the large-scale multi-center REST-meta-MDD data set. This framework addresses the overfitting susceptibility issues in high-dimensional FC data analysis through innovative hidden space mixup data augmentation techniques combined with multi-objective joint optimization. The model achieved significant performance improvements in MDD classification tasks.
The HDM module designed in this study achieves dual-pathway integration through multi-head self-attention and GATv2 network architectures, effectively combining global dependency relationships and local topological structural information advantages. The multi-head self-attention mechanism captures long-distance dependencies between ROIs, while GATv2 optimizes the representation and structural properties of graphical networks through attention-enhanced mechanisms.
This dual-pathway design addresses a key problem by providing more comprehensive feature representations for FC data. Compared to traditional neural data augmentation methods, multi-task learning strategies and hidden space mixup contributed 4.69% accuracy improvement and 3.53% AUC improvement, effectively alleviating the overfitting problem of DL models on limited medical data.
Although our method achieved certain improvements in overfitting problems and classification effectiveness, this study still has some limitations that require further technical improvements in future work. We have not fully used the temporal dynamic connectivity information in large-scale resting-state functional data and dynamic FC can capture richer temporal change characteristics of brain networks, potentially containing more important neural information. Meanwhile, this study primarily focused on single-modal fMRI data and model performance on multi-modal MRI structural imaging diffusion tensor imaging, task-state fMRI and other neuroimaging modalities requires further validation. Multi-modal fusion may further improve diagnostic capabilities. Additionally, although multi-center data was used, differences in site demographics, cultural backgrounds, disease severity and other population factors require more extensive validation studies.
6. Conclusions
This study successfully developed an intelligent diagnostic framework for MDD based on a MT-DBDAE. Through heterogeneous dual-pathway feature fusion, hidden space mixup and multi-objective collaboration, the proposed approach effectively mitigates the challenges of high dimensionality in FC data and the scarcity of medical data. Experimental results on the large-scale, multi-center REST-meta-MDD data set demonstrate that the proposed method achieved optimal classification performance on both brain atlases, with an accuracy of 69.06% and an AUC of 74.35% on the CC200 atlas. SHAP-based interpretability analysis identified key FC patterns that are highly consistent with the neuropathological mechanisms of MDD, including DMN abnormalities, limbic system dysfunction and interhemispheric connectivity imbalance. Ablation experiments validated the effectiveness of each module, with hidden mixup and multi-task learning contributing the most to performance improvement. This study provides an effective tool for the objective diagnosis of MDD based on brain FC, holds significant clinical translational value and offers a new technological pathway for precision medicine in psychiatric disorders.