


Molecular Representation Learning (MRL) is widely applied in various downstream tasks, such as molecule generation, molecular property prediction and reaction prediction. Nevertheless, MRL faces several challenges posed by the vast chemical space and limited labeled-data availability. In this paper, we propose Hierarchical Graph Transformer (HieGT), integrating atom-level and motif-level representations to capture local-global characteristics of molecules over a hierarchical graph. Leveraging 2D topological and 3D geometric encoding, HieGT enhances intrinsic representation understanding of molecules. The proposed method achieves the state-of-the-art performance over the molecular property prediction dataset PCBA of Open Graph Benchmark (OGB), and competitive results on PCQM4Mv2 with better interpretability.
1 Introduction
Molecular Representation Learning (MRL) aims to utilize machine learning to encode molecules as numerical feature vectors for downstream applications, such as molecular property prediction [39], reaction prediction [31], drug design [32] and drug-drug interaction prediction [42]. However, the chemical space of molecules are extremely vast with limited labeled data, which poses great challenge to extract effective representations.
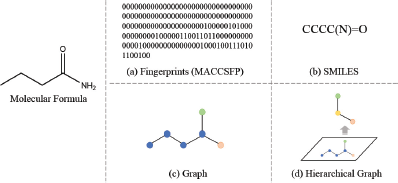
Representations of molecules. (a) Fingerprints calculated as MACCSFP by rdkit [18] in binary. (b) The SMILES. (c) The graph. (d) The proposed hierarchical graph representation, where molecules can be characterized by a set of motifs. Each motif may correspond to a certain type of local substructures and functions.
Representations of molecules. (a) Fingerprints calculated as MACCSFP by rdkit [18] in binary. (b) The SMILES. (c) The graph. (d) The proposed hierarchical graph representation, where molecules can be characterized by a set of motifs. Each motif may correspond to a certain type of local substructures and functions.
There are three main manners to represent molecules: the fingerprint, sequence and graph, as shown in Figure 1(a)–(c). The fingerprint [29] embodies hand-crafted information from molecules with a fixed length, which is not flexible for various tasks. The sequence [35] mainly refers to Simplified Molecular Input Line-Entry System (SMILES), which consists of ASCII strings to describe molecules. Though SMILES can be processed by Natural Language Processing methods, they are typically difficult to understand intuitively and may encounter ambiguity [15]. In contrast, the graph is a natural way to represent the topology of molecules. Typically the atoms are treated as nodes while the bonds are treated as edges, then additional information can be incorporated in nodes and edges from atom and bond features. Thus, graphs are widely adopted in recent studies [5, 13, 15, 21, 23–25, 40, 43]. In applications such as drug-drug interaction [42], drug-target binding affinity prediction [12] and biochemical reactions [36], edge directionality may be meaningful for learning asymmetric relationships between molecules. However, as we mainly focus on independent and static molecular representations rather than molecular interactions and dynamics, the chemical bonds between atoms within molecular graphs can be regarded as symmetric edges, on account of which we represent molecules as undirected graphs as in previous works [13, 23, 24, 40].
Previous works in graph-based molecular representation learning can be divided into three classes [7]: molecular-topology-based methods [15, 43], knowledge-graph-based methods [5], and spatial-learning-based methods [4, 4, 8]. Molecular-topology-based methods focus on the topological structures or substructures. However, most quantum chemical properties are derived from 3D conformations [23], which cannot be reflected from 2D topologies. Knowledge-graph-based methods extract molecular representations by knowledge graphs rather than molecular graphs. Nevertheless, knowledge graphs relies heavily on hand-crafted features and domain knowledge, and may discard large amounts of structural features. Spatial-learning-based methods focus more on 3D geometric features of molecules. Since 3D geometric features serve as a vital role in predicting molecular properties, we choose to integrate molecular-topology-based and spatial-learning-based paradigms to extract more comprehensive molecular representation combining both 2D & 3D graph features.
As one of the most powerful models to learn molecular topological and spatial representations, graph Transformer [41] has recently gained state-of-the-art performance on many MRL tasks [13, 23–25, 40], due to its distinct self-attention mechanism for capturing long-range structural dependencies. Previous works in graph Transformer [23, 23, 24] mainly focus on the global information flow among node representations. Edge representations are merely utilized as a bias term to the attention module. To emphasize the significance of edge representations equal to node representations, the Edge-augmented Graph Transformer (EGT) [14] introduced dynamic edge channels that are updated across layers, enabling information flow between node and pair representations. Furthermore, TGT-At [13] enabled direct communication between two adjacent pairs in a graph via novel triplet attention and aggregation mechanisms.
Though the atom-level global graph structure has been effectively exploited in previous works, the local context of molecules is not fully studied yet in the networks. It has been found that molecules can be characterized by a set of motifs, each of which may correspond to a certain type of local substructures and functions (similar to chemical functional groups) [34]. As illustrated in Figure 2, the sample molecule can be composed of four motifs, such as the benzene ring and the carbonyl group (the 3rd and 4th colored circle from left to right). Accordingly, the molecule can be represented as a motif-wise graph, embodying a hierarchical structure. Hence, we propose Hierarchical Graph Transformer (HieGT), the first hierarchical Transformer framework to learn molecular representation, to the best of our knowledge. We incorporate both atom-level and motif-level graph representations and come up with a hierarchical graph encoding strategy to shed new light on local-global characteristics of molecules.
In particular, we firstly decompose the atom-wise molecular graph into motifs based on three hand-crafted rules, as specified in Section 4.1. Then the motifs are assembled with the same connectedness, composing the motif-wise graph, as illustrated in Figure 2. The atom-wise and the motif-wise graphs are both exploited in the proposed method in a hierarchical manner, as illustrated in Figure 1(d).
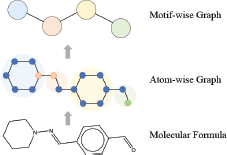
The atom-wise graph could be decomposed into the motif-wise graph by certain rules.
The atom-wise graph could be decomposed into the motif-wise graph by certain rules.
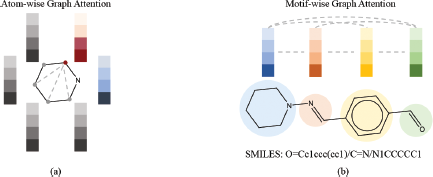
Then, we propose to learn molecular representations based on two natural assumptions. First, there exists information exchange among motifs via inter-motif edges. Second, the information flow among atoms in the same motif are regulated by the motif via intra-motif edges. Based on these two assumptions, we develop two procedures to learn Atom-wise Graph Attention (AGA) via intra-motif edges, as illustrated in Figure 3(a), and Motif-wise Graph Attention (MGA) via inter-motif edges, as illustrated in Figure 3(b). After AGA and MGA, the learned molecular representations are projected for downstream tasks.
Our main contributions are summarized as follows:
We propose a novel hierarchical molecular representation learning paradigm (HieGT), which integrates both atom-level and motif-level information.
We introduce Atom-wise Graph Attention and Motif-wise Graph Attention to learn the information flow within and among motifs, by constraining attention over intra-motif and inter-motif edges.
Experimental results demonstrate that our approach establishes a new state-of-the-art (SOTA) on the PCBA dataset [11] and achieves competitive performance with the SOTA on the PCQM4Mv2 dataset [10] while obtaining better interpretability.
2 Related Works
Previous works in graph-based MRL methods can be divided into three classes [7]: molecular-topology-based methods, knowledge-graph-based methods, and spatial-learning-based methods.
Molecular-topology-based methods. Molecular-topology-based methods focus on the topological structures or substructures of the molecular graphs. Jin et al. [15] generate molecular graphs from SMILES strings by the junction tree variational autoencoder for molecular graph generation. Zhang et al. [43] extract motifs from molecular graphs and design a self-supervised motif generation framework for molecular property prediction. However, motif features are used without explicit atom features, and 2D topology merely reveals the connectivity between atoms, while the actual 3D distances may significantly vary between different atom pairs sharing the same local topology.
Knowledge-graph-based methods. Knowledge-graph-based methods extract molecular-structure-invariant knowledge. KCL [5] adopts contrastive learning with an external knowledge graph, which is formed by triples in the form of (chemical element, relation, attribute). Nevertheless, atom pair-wise characteristics are largely neglected, especially quantitative features such as geometric features.
Spatial-learning-based methods. Spatial-learning-based methods pay more attention to 3D geometric features of molecules. GeomGCL [21] proposes graph contrastive learning by embedding distances and angles across 2D and 3D views. The properties of molecules are mostly determined by their 3D structures [4, 8], which explains why spatial-learning-based methods typically achieve better performance on MRL tasks.
By combining molecular-topology-based and spatial-learning-based paradigms, the graph Transformer model has recently achieved state-of-the-art performance across numerous downstream tasks in MRL with its unique self-attention mechanism. Graphormer [40] encodes the centrality, shortest path distance and edge features into the standard Transformer architecture. Nevertheless, only 2D topological information is encoded. Transformer-M [24] develops two separated channels to encode both 2D and 3D structural information and incorporates them with the atom features in the network modules. GPS++ [25] is a hybrid Message Passing Neural Network (MPNN) and Transformer to incorporate 3D atom positions and an auxiliary denoising task. Uni-Mol+ [23] generates an initial molecule conformation from simple methods such as RDKit [18], and iteratively updates the conformation, which will be used to further predict molecular properties. TGT-At [13] enables direct communication between two adjacent pairs in a graph via novel triplet attention and aggregation mechanisms. Our method adopts the transformer architecture but incorporates both atom-level and motif-level features in a hierarchical manner to extract local-global intrinsic molecular representation.
3 Preliminary
3.1 Graph Neural Networks (GNN)
We represent molecules on undirected graphs. An undirected graph 𝒢 = {𝒱, ℰ} is composed of a node set 𝒱 with cardinality |𝒱| = N, and an edge set ℰ connecting nodes. The typical GNNs iteratively update the representation of a node υi by aggregating representations of its neighbors:
where is the representation of υi at the l-th layer, and 𝒩(υi) is the set of neighbors of υi.
3.2 Transformer
The Transformer model consists of Transformer layers [33], each of which includes a self-attention module and a position-wise feed-forward network (FFN).
Multi-head self-attention. Denote Hl as the input of self-attention module on the transformer layer l, and d as the hidden dimension, one head k of self-attention Ak (Hl) is represented as:
where and are learnable projection matrices, and Bk is the graph structural encodings as the attention bias of the k heads.
Let Wl be the learnable projection matrix to map the concatenated output of all h heads on the layer l, the multi-head self-attention is denoted as:
Transformer layer. After the multi-head self-attention, the feed-forward network (FFN) is applied, which is composed of a pre-norm layer, a linear
transformation layer, a non-linear activation layer, followed by another linear transformation layer. As in previous works [13, 40], we choose the widely used Gaussian Error Linear Unit (GELU) [9] as the activation function. Both the output of self-attention and FFN of layer l is processed with pre-norm layer normalization and residual connection:
where Hl+1 is the output of the transformer layer l + 1.
4 The Proposed Hierarchical Graph Transformer
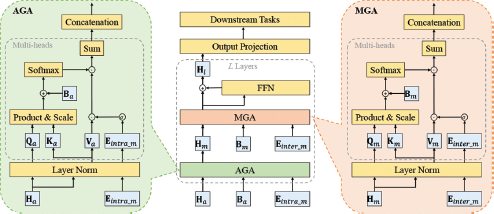
We propose a Hierarchical Graph Transformer framework, as illustrated in Figure 4. Our molecular representation learning consists of four steps:
hierarchical graph construction, where we design three hand-crafted rules to decompose the atom-wise graph into a motif-wise graph;
Atom-wise Graph Attention, which computes self-attention within motifs via intra-motif edges;
Motif-wise Graph Attention, which computes self-attention between motifs via inter-motif edges; and
output projection, which obtains representations of the whole graph by linear transformation.
We elaborate on these steps in the following.
Input atomic features and the corresponding rdkit functions.
| Features | Rdkit Functions |
|---|---|
| the atomic number | GetAtomicNum() |
| the chiral tag | GetChiralTag() |
| the degree | GetTotalDegree() |
| the formal charge | GetFormalCharge() |
| the number of connected Hs | GetTotalNumHs() |
| the number of radical electrons | GetNumRadicalElectrons() |
| hybridization | GetHybridization() |
| aromaticity | GetIsAromatic() |
| whether is in ring | IsInRing() |
4.1 Hierarchical Graph Construction
Graph motifs are frequently-occurring subgraph patterns (e.g., functional groups of molecules), which are fundamental for both the structure and function of molecules. For instance, the benzene ring is one of the most typical motifs among molecules, which embodies special chemical properties not reflected by individual atoms. Therefore, to better extract molecular features, we propose to construct atom-wise graph and motif-wise graph to learn both local and global molecular representations.
The atom-wise graph. Following previous works [13, 13, 24], we use the input atomic and bond features as calculated by the OGB [11] Python library. Specifically, they can be represented in Table 1 and Table 2 by rdkit functions. We treat atoms as nodes and bonds as edges, then the input atomic and bond features are projected via a learnable embedding layer into node embeddings Xa and edge embeddings Ea.
The motif-wise graph. To obtain motifs from a molecule in a universal manner, we consider bridge bonds that connect motifs based on three rules:
Rule 1: The bonds that connect rings and chains (non-ring subgraphs);
Rule 2: The bonds in chains that connect carbon and non-carbon atoms;
Rule 3: The bonds in chains whose types are not single (i.e. double or triple).
By breaking bridge bonds, a molecule is transformed from an atom-wise graph to a motif-wise graph, where each motif is represented as a node, and the bridge bonds serve as the inter-motif edges. The new node embeddings of the motif-wise graph are obtained via Atom-wise Graph attention discussed in Section 4.2, while the new edge embeddings are part of the atom-wise-graph edge embeddings, merely retaining embeddings of inter-motif edges.
4.2 Atom-wise Graph Attention (AGA)
Given the atom-wise graph, we can obtain the AGA via intra-motif edges ℰintra_m, illustrated as the module painted light green in Figure 4.
As the self-attention mechanism described in Section 3.2 only calculates the context between each node and all the other nodes, much structural information of a graph is neglected, such as the relation between node pairs. Therefore, we introduce three graph structural encodings of the previous work [40]: centrality encoding, path encoding and edge encoding.
Centrality encoding. Node centrality measures how important a node is in the graph. Because degree centrality is one of the standard centrality measures in literature, the degree encoding of node υi is defined as:
where denote embedding vectors with indegree deg−(υi) and outdegree deg+(υi) respectively. For undirected graphs like molecular graphs, deg−(υi) and deg+(υi) are equal.
Path encoding. In the Transformer architecture, positional dependency is generally encoded as bias terms to encode global structural information. To extract positional dependency between atom pairs of a molecule, encoding the distance is the most natural way. To avoid ambiguity with the 3D distance encoding, we apply 2D distance encoding for each connected atom pair (υi, υj) but rename it to path encoding:
where bSPD(υi, υj) is a learnable scalar indexed by the Shortest Path Distance (SPD) between υi and υj.
Edge encoding. For molecular graphs, edge features represent critical properties of bonds between connected atoms. For each connected atom pair (υi, υj), the edge encoding is defined as:
where is the feature of the n-th edge en in the shortest path between υi and υj, and wn is the n-th weight embedding of the same dimension as .
Though the above encoding methods effectively represent 2D structural features of molecular graphs, the 3D geometric features are neglected, which are more practical for discovering the actual properties of molecules. Therefore, we introduce the 3D distance encoding as [24], which is naturally invariant to translation and rotation of the 3D molecular graphs.
3D distance encoding. While path encoding can effectively represent topological distances, it fails to take the actual 3D Euclidean distances into account. Due to the complex conformation of a molecule, one atom can be close to another atom (which means a short 3D Euclidean distance) but have a long SPD. Hence, we apply 3D distance encoding as a complement for path encoding, similar to the one used in Transformer-M [24] and TGT [13]:
where dij is the 3D Euclidean distance between atoms i and j. are learnable scalars indexed by the pair of atom types, and μk, σk are learnable parameters for the k-th kernel (k = 1, …, K where K is the number of Gaussian Basis kernels [30]). Denoting ϕij as the concatenation of the outputs of all kernels, the 3D distance encoding of pair (i, j) is defined as:
where Wd1 and Wd2 are learnable weight matrices, and GELU is the Gaussian Error Linear Unit [9] as the activation function.
The path encoding, edge encoding, and 3D distance encoding are combined as the atom-wise attention bias:
For simplicity, we omit the notation of multi-heads. Inspired by EGT [14], we use the intra-motif edge embeddings Eintra_m to gate the information flow between atoms. Given node representations Ha, the attention matrix Aa in the atom-wise graph is denoted as:
The network outputs the embedded representation of each atom for the MGA module.
4.3 Motif-wise Graph Attention (MGA)
Given the motif-wise graph, we can obtain the MGA via inter-motif edges ℰinter_m, illustrated as the module painted light orange in Figure 4.
In this module, we deploy a similar network framework as in the AGA module, but choose different encodings. As the motif-wise graph possesses new topological structure and edges, we retain the above manners of computing the path encoding ΨPath′ and edge encoding ΨEdge′, and combine them as the motif-wise attention bias:
Nevertheless, the distances between motifs do not make much sense due to the nonexistence of explicit centers in each motif, so we discard them in the module. Similar to AGA, the attention matrix Am in the motif-wise graph is denoted as:
The network outputs the embedded representation of each atom for output projection.
Despite the similarity in the network architecture of AGA and MGA in Figure 4, there are some differences in the specific implementation of AGA and MGA. First, the input data are different. AGA takes the node representations Ha as input, while MGA takes the output of AGA as input. Second, the atom-wise attention bias Ba in AGA and the motif-wise attention bias Bm in MGA are calculated differently, as described in Eq. 12 and Eq. 15. Third, the information flows of AGA and MGA are gated by intra-motif edges and inter-motif edges, respectively.
4.4 Output Projection
In this module, the output representation from the motif module is projected as the overall graph representation by linear transformation for downstream tasks.
5 Experiments
5.1 Experimental Setup
We follow the experimental settings in previous works [13, 13, 24]. First, we pre-train our model on the large quantum chemistry datasets PCQM4Mbυ2 from
OGB Large-Scale Challenge [10]. After pre-training, we implement finetuning on PCBA [11] for the classification task.
PCQM4Mυ2. PCQM4Mυ2 is a quantum chemistry dataset originally curated under the PubChemQC project [26]. The total number of training samples is 3.37 million. The task of PCQM4M-LSC is to predict HOMO-LUMO energy gap of molecules calculated by density functional theory (DFT) [3] with their 2D molecular graphs, which is one of the most practically-relevant quantum chemical properties of molecule science [10]. We utilize the same dataset-division manner as [10] for fair comparison.
PCBA. PCBA is a molecular property prediction dataset with 437,929 molecules. We follow MoleculeNet [37] to split datasets into the training, validation and test set with a 80/10/10 ratio.
The experiments are conducted over eight RTX3090 (24GB RAM). We employ 24 transformer layers, and the dimension of hidden layers and feedforward layers is set to 768. The number of attention heads is set to 32.
5.2 Pre-training
The model is pre-trained on the training set of PCQM4Mυ2. The training set provides 3D structural information for training molecules computed by DFT. We calculate a rough version of coordinates by rdkit [18] for the validation set and the test set. The objective is predicting the HOMO-LUMO gap. The results are presented in Table 3 in terms of Mean Absolute Error (MAE) in eV unit. We compare our algorithm with 14 methods: GINE-VN [2, 6], GCN-VN [6, 17], GIN-VN [6, 38], DeeperGCN-VN [6, 20], TokenGT [16], GRPE [27], Graphormer [40], GraphGPS [28], GEM-2 [22], Transformer-M [24], GPS++ [25], Uni-Mol+ [23], and TGT-At [13].
As shown in Table 3, our method achieves competitive performance with other state-of-the-art methods. Though the MAE of our method on pre-training is slightly higher than that of TGT-At, the finetuning result in Section 5.3 is better, which shows greater potential on downstream tasks. In addition, the interpretability of our method is stronger, as will be specified in Section 5.4. The time cost of our method is competitive to other state-of-the-art methods with available efficiency data [13, 23], as shown in Table 4.
5.3 Finetuning
As the 3D coordinates are not provided for PCBA, we calculate coordinates by rdkit as well. The results are presented in Table 5 in terms of Average Precision (AP). We compare our algorithm with 7 methods: DeeperGCN [20], DGN [1], GINE [2], PHC-GNN [19], GIN-VN [6, 38], Graphormer [40] and TGT-At [13]. Our method outperforms the state-of-the-art approaches and achieves performance gain by around 4.99%, which gives credits to the effective local-global representation learning by the proposed hierarchical framework.
Results on PCQM4Mυ2. The evaluation metric is the Mean Absolute Error (MAEJ,) [eV], Bold values indicate the best performance.
| Model | Year | Source | Valid MAE↓ | Test-dev MAE ↓ |
|---|---|---|---|---|
| GINE-VN [2, 6] | 2020 | arXiv preprint, ICML | 0.1167 | - |
| GCN-VN [6, 17] | 2017 | ICLR, ICML | 0.1153 | 0.1152 |
| GIN-VN [6, 38] | 2018 | ICLR, ICML | 0.1083 | 0.1084 |
| DeeperGCN-VN [6, 20] | 2020 | arXiv preprint, ICML | 0.1021 | - |
| TokenGT [16] | 2022 | NeurlPS | 0.0910 | 0.0919 |
| GRPE [27] | 2022 | ICLR | 0.0867 | 0.0876 |
| Graphormer [40] | 2021 | NeurlPS | 0.0864 | - |
| GraphGPS [28] | 2022 | NeurlPS | 0.0852 | 0.0862 |
| GEM-2 [22] | 2022 | arXiv preprint | 0.0793 | 0.0806 |
| Transformer-M [24] | 2022 | ICLR | 0.0772 | 0.0782 |
| GPS++ [25] | 2022 | arXiv preprint | 0.0778 | 0.0720 |
| Uni-Mol+ [23] | 2023 | Nature Communications | 0.0693 | 0.0705 |
| TGT-At [13] | 2024 | ICML | 0.0671 | 0.0683 |
| HieGT | 0.0769 | 0.0781 |
Results on PCBA. The evaluation metric is the Average Precision (AP↑). Bold values indicate the best performance.
| Model | Year | Source | Test-AP (%) ↑ |
|---|---|---|---|
| DeeperGCN-VN-FLAG [20] | 2020 | arXiv preprint, ICML | 28.42±0.43 |
| DGN [1] | 2021 | ICML | 28.85±0.30 |
| GINE-VN [2, 6] | 2020 | arXiv preprint, ICML | 29.17±0.15 |
| PHC-GNN [19] | 2021 | ICANN | 29.47±0.26 |
| GIN-VN [6, 38] | 2018 | ICLR, ICML | 29.02±0.17 |
| Graphormer-FLAG [40] | 2021 | NeurIPS | 31.40±0.34 |
| TGT-Ag+TGT-At-DP [13] | 2024 | ICML | 31.67±0.31 |
| HieGT | 33.25 ± 0.27 |
5.4 Interpretation
To show the interpretability of the proposed method, we visualize the attention scores of two randomly sampled molecules in head 0 and head 1 after AGA and MGA, compared with the state-of-the-art method TGT [13], as shown in Figure 5. The results illustrate the main impact within intra-motif edges in AGA and inter-motif edges in MGA, which demonstrate the intuitive interpretability of the proposed method. For instance, in AGA, the attention weights are constrained in atoms of the same motif of the target atom. In MGA, the attention weights are significant in atoms of other motifs. In comparison, the distribution of attention weights in TGT is spread around and it is not easy to discover chemical mechanism. Moreover, the atoms with significant weights are consistent in Head 0 and Head 1 in AGA (the neighbor atoms of the candidate atom) or MGA (atoms in other motifs), while atoms with significant weights vary greatly in Head 0 and Head 1 in TGT (either the neighbor atom of the candidate atom, or one of the farthest atoms). That is to say, the weights of atoms are more stable across different attention heads in our method. This indicates that the latent features learned by AGA and MGA are more intrinsic than TGT for molecular representation learning.
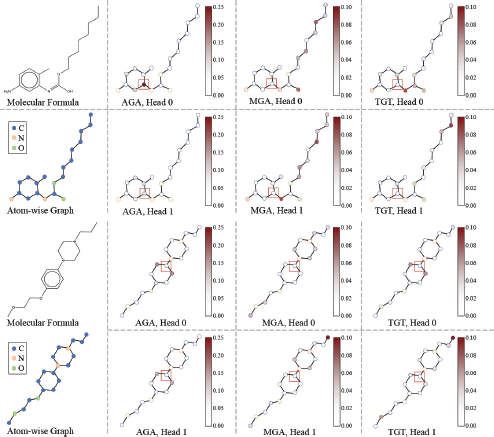
The visualization of attention weights of two randomly sampled molecules. The node marked by a red square represents the candidate atom, while the other atoms are shaded from red to white based on the magnitude of their attention weights relative to the candidate atom.
The visualization of attention weights of two randomly sampled molecules. The node marked by a red square represents the candidate atom, while the other atoms are shaded from red to white based on the magnitude of their attention weights relative to the candidate atom.
5.5 Ablation Study
We conduct ablation studies on the two major components of our algorithm: AGA and MGA. Experiments are conducted on the PCQM4Mυ2 dataset in Table 6. The evaluation metric is the Mean Absolute Error (MAE) in eV unit. The results with both AGA and MGA are significantly better than results with removing one of the modules, which validates the effectiveness of our method. In addition, keeping merely the AGA module achieves lower MAE than remaining merely MGA. This could suggest that atom features serve as a comparatively more important role in molecular representation learning.
6 Conclusion
In this work, we propose Hierarchical Graph Transformer to learn local-global molecular representations. As molecules can be decomposed into motifs that possess local substructures and functions, we develop rules to construct motif-wise graphs from atom-wise graphs, and design Atom-wise Graph Attention and Motif-wise Graph Attention constrained by intra-motif edges and intermotif edges. Experimental results show that the proposed method achieves competitive results on pretraining and significantly outperforms state-of-the-art graph representation learning approaches on finetuning. In the future, we plan to apply the proposed method on more downstream tasks, such as molecule generation and molecular conformation learning.

