
1 Introduction
It is estimated that the lifetime building maintenance cost is equal to 0.4 times the construction cost (Hughes et al., 2004). Maintenance actions aim to restore every part of a building back to its original status (British Standards Institution, 1993). Building failures and defects are common phenomena in construction. Some of the most typical types of such defects are: wall cracks, faulty electrical wiring, faulty fire/smoke detection system, not working lighting, moisture, blocked or inadequate drainage systems (Ahzahar et al., 2011; Othman, 2015). Such issues increase dramatically the maintenance cost. For example, moisture issues cost billions of dollars in the United States (Kubba, 2008).
Efficient planning of maintenance tasks is essential for the wellbeing of the users of residential and office buildings (Brugge et al., 2010). For example, a well maintained ventilation system can increase productivity by 2.5-5% during an eight hour work period (Park & Yoon, 2011). On the contrary, a delayed response to malfunctions of the heat, ventilation and air conditioning system (HVAC) can cause a productivity loss that ranges between 5% to 9% (Al Horr et al., 2017; Kosonen & Tan, 2004), and Sick Building Syndrome (SBS) (Lan et al., 2011). The latter has a very negative impact to the occupants of buildings, as it is linked to several illnesses, among them eye, nose, and throat initiation, headaches, and allergies (Au-yong et al., 2014). Previous studies show that insufficient maintenance quality, results in poor building indoor environmental quality (Diaz et al., 2018; Rauh et., 2008). Such environmental quality is linked to respiratory illnesses, among them, asthma, rhinitis, bronchitis, common cold and cough (May et al., 2017). In the US, the cost induced by such maintenance-related health issues is estimated to be equal to 168 US dollars (Wargocki, 2018). Similarly, in the UK, the annual costs incurred from asthma treatments are equal to 1 billion British Pounds (Mukherjee et al., 2014).
Maintenance actions are initiated either after an asset fails (corrective) or before (preventive) at regular intervals. In particular, the corrective actions need to be immediately addressed to avoid severe inconvenience to the users of buildings (Le et al., 2018). Such immediate response depends on budget allowance. However, the budget that is allocated for maintenance is limited (Le et al., 2018). This is mainly due to the lack of accurate estimation tools of the required maintenance funds (Yu et al., 2017). Given these budget restrictions, the organisations need to be able to prioritize the most ‘important’ maintenance tasks. However, this is not achievable. It is estimated that 1/3 of the maintenance cost is wasted insufficiently (Mobley, 2002).
2 Background
Most of the prioritization methods consider the probability of failure and the criticality of an asset (consequences of failure). The criticality of assets varies significantly between organizations, depending on their key performance indicators and maintenance objectives. The criticality is defined by the organisation (or asset owner) based on several parameters, among them safety, downtime cost, asset importance, productivity, whilst the probability of failure is determined based on deterioration models, regular manual inspections, or installed sensors. Current methods evaluate quantitatively the criticality of assets based on elaborate weighted score procedures and extensive maintenance historical data collection efforts (Crespo et al., 2016). However, such data are not always available. This lack of information it is confirmed in a recent study, which focuses on a three-step-methodology for planning the maintenance of the facades of 30 buildings (Madureira et al., 2017). In addition, the assessment of the consequences of assets’ failure is subject to experts’ subjectivity (Stadnicka et al., 2014). On that respect, Parlikad & Srinivasan (2016) propose a dynamic criticality-based method to optimize maintenance plans in terms of defining the optimal repair/replacement time for an asset. Sweis et al. (2014) developed a multi-attribute prioritization model that relies on predefined major criteria of major public healthcare facilities. Ratnayake & Antosz (2017) combine fuzzy logic with a risk matrix to optimize the prioritization of machinery maintenance. Chang et al. (2004) in a different approach, propose a knowledge-based method to prioritize the maintenance needs of public universities. Babashamsi et al. (2016) apply fuzzy analytic hierarchy process in combination with a multi-criteria optimization and compromise solution (VIKOR) to prioritize pavement maintenance alternatives. However, unscheduled downtime and waste of resources are the main limitations of the existing prioritization methods that rely on heuristic rules and experience-based common sense (Li & Ni, 2009). In a different approach, Ahmed et al. (2017) and Contreras-nieto et al. (2019) use the analytical hierarchy process method (AHP) to prioritize pavement and bridge maintenance actions respectively. However, such approach is limited by the exponentially increased number of pairwise comparisons. This is due to the increase of the alternatives to rank (Crespo et al., 2016). In addition, to the best of the knowledge of the authors of this paper, little focus is given on assets belonging to residential and office buildings. Current studies are predominantly designed for manufacturing and public infrastructure (e.g. bridges, pavements).
Currently, digital ‘twins’ are presented as a promising solution for improving maintenance decision making (Macchi et al., 2018; Watson, 2011). The ‘digital twin’ is defined as a virtual entity that consists of sensors and transmitted data. This paper presents an innovative machine learning-based approach that exploits the concept of a digital ‘twin’ to address the prioritization of maintenance tasks of residential and office buildings in an efficient way. This paper hypothesizes that the criticality of assets can be inferred through historical data. It features an accuracy of 59% on average in terms of classifying the maintenance tasks as “Urgent”, “non-Urgent”, “Critical”, “High”, “Medium” and “Low”. The remainder of this paper is structured as follows. Section 3 analyses the overall framework proposed in this paper, using the historical data that are provided by the Estate Management of the University of Cambridge. Section 4 presents the performance of the proposed method and lastly, Section 5 summarizes the outcomes of this paper.
3 Proposed Solution
3.1 Internet of Things (IoT) for Maintenance
The proposed method exploits the IoT in order to establish a continuous ‘communication’ among managers and assets. Such communication will inform managers about the condition of multiple assets real time. Digital profiles of assets are created to achieve such ‘communication’. The users scan unique identification tags to access the digital profiles of the assets (see in Figure 1-a,-b, and-d).
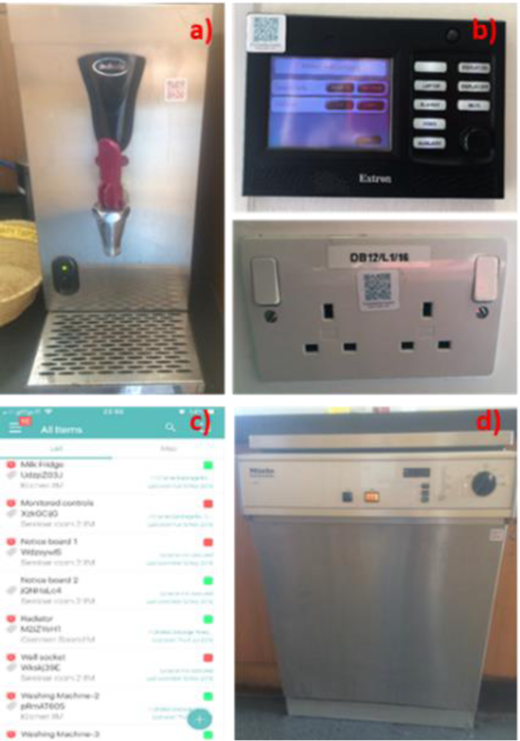
Asset tagging
These tags are directly linked to a software application that manages the digital profiles all assets (The Simple Asset Management Software, 2019) as shown in Figure 1-c above. The digital profiles contain useful information about the location of assets, the past maintenance inspections (e.g. date, issue resolved), and most importantly they allow the users to send feedback about any potential failures.
The users’ feedback is the input of a machine learning (ML) based-method that infers the criticality of every asset failure. The proposed method uses this criticality to prioritize the maintenance tasks, which are provided by the users. This prioritization indicates the response time. Figure 2 illustrates the overall proposed framework proposed of this paper.
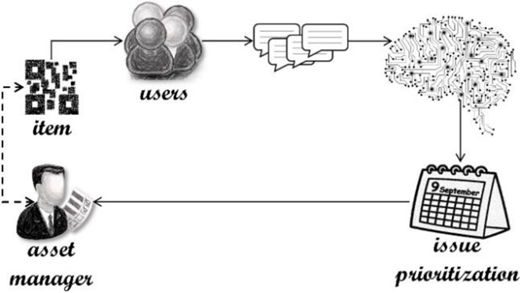
Proposed framework
2.1 Machine learning-based inference of asset failure impact (criticality)
Figure 3 illustrates the machine learning-based proposed method for prioritizing the maintenance tasks. The rectangular shapes refer to input/outputs and the skewed parallelogram to methods. The input of the proposed method is the free text (feedback) that is provided by the users of the assets through the itemit application. The proposed method is trained offline with text-based historical data depicting multiple assets’ failures.
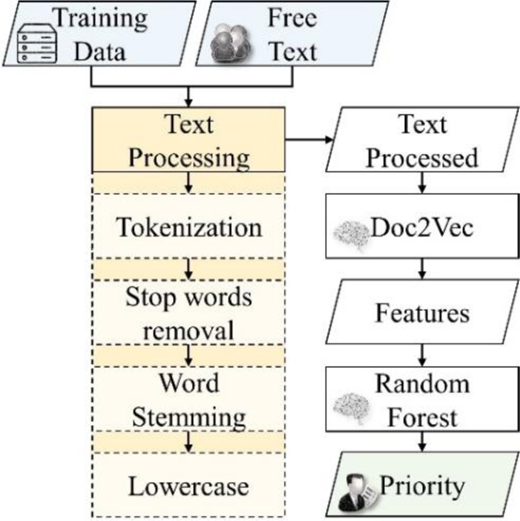
Proposed machine learning-based prioritization of responsive maintenance tasks
Initially, natural language processing techniques are exploited to pre-process the text-based feedback of users. This includes: a) tokenization for splitting the sentences into a sequence of strings i.e. tokens, b) removal of stop words, c) lowercasing, and d) word stemming for converting the words to their root form. Then, the Paragraph Vector (Mikolov & Com, 2014), an unsupervised algorithm, is trained to convert the pre-processed texts (inputs) into feature vectors. This vectorization method uses stochastic gradient descent that is calculated via backpropagation to achieve this. One of its main advantages is that: a) takes into account word semantics, and b) considers the word order. The Paragraph Vector has two versions, the Distributed Bag of Words (PV-DBOW) and the Distributed Memory (PV-DM). The PV-DM is trained to predict the word following a text window, whereas the PV-DBOW is trained to predict the words within a text window. This paper uses the PV-DM as it proven to perform better (Mikolov & Com, 2014). The scope of this papers is to prioritize a large variety of maintenance complaints. Each of these complaints corresponds to a different type of asset and failure. This implies imbalanced classes. For this reason, a random forest is trained to classify each of the inputs into a response time (prioritization label) lastly. Such classification method is selected as it does not overfit and performs well with imbalanced data (Khoshgoftaar et al., 2007)
4. Implementation and Results
4.1 Data analysis
This paper achieves this prioritization by following a two-stage classification approach. The classification labels reflect the practises followed by the Estate Management of the University of Cambridge that provided the historical data. At the first stage (Stage A), the proposed method classifies the maintenance tasks as ‘Urgent’ and ‘non-Urgent’. The former depict assets’ failures with a large impact on its users, whilst the latter failures of lower importance. At the second stage (Stage B), each of these two categories is subdivided based on the exact response time. The ‘Urgent’ input is classified as either ‘Critical’ (response within half an hour) or ‘High’ maintenance tasks (response within 2 hours), whilst the ‘nonUrgent’ as ‘Medium’ (response within 2 days) and ‘Low’ (response within 10 days). Table 1 illustrates some examples of users’ feedback as provided by the Estate Management of the University of Cambridge.
Example of labelled input training data
| Text (input) | Label |
|---|---|
| The fire alarm in the bull pens keeps going into fault. | Urgent |
| South research house lift More than one person stuck in the lift. | Urgent |
| Magnetic door holder - cover has been removed and there are exposed wires. Could BBC engineer attend to fix please. | Urgent |
| Water pump is leaking. Pls could someone attend. | non-Urgent |
| We have some lights/bulbs out room 1.20 x1 corridor outside 1.20 x2 | non-Urgent |
| Can you please arrange for someone to visit site and look at the existing heating system as several radiators are not working and may have air in the system | non-Urgent |
| After a fire alarm test the panel has gone into alarm with a 'power supply fault' message. They can't find the source of the power supply fault. Nothing has tripped out. | Critical |
| Lift entrapment | Critical |
| PIN HOLE IN 42ml COPPER PIPE TO CAGE WASH | Low |
| Glass lift requires leveling up in the basement, (as there is half inch gap). | Low |
| Air con is leaking, pls could b & C attend. Dept said they have put bucket and towels underneath, so it should be ok for tonight, but pls could someone attend tomorrow. | Medium |
| MAIN KITCHEN GAS PUMP FAILED UNABLE TO USE COOKERS ECT. | Medium |
The historical data depict actual maintenance complaints raised over a period of 4 years (2014-2018). They cover a variety of assets and building types (residential, office, teaching). The historical data are prioritized by experts, considering the level of impact that the failures of the assets have on the users of the buildings, such as productivity, health and safety. A percentage of 80% of the training data is randomly selected for training and the remaining 20% is used for testing. Figure 4 displays the frequency the ‘Urgent’ and ‘non-Urgent’ classes of Stage A, whilst Figure 5 presents, the training data of Stage B (‘Critical’, ‘High’, ‘Medium’, and ‘Low’). In these figures, it appears that the training data are strongly imbalanced. This complies with our hypothesis in the previous section. The classes with the largest training data are down-sampled to the size of the smallest class to achieve an accurate performance. The training dataset contains 178 different types of assets in total. Table 2 illustrates some of them categorized as Mechanical, Electrical, Plumbing and Architectural.
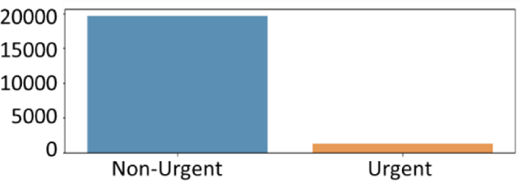
Training data frequency (Stage A)
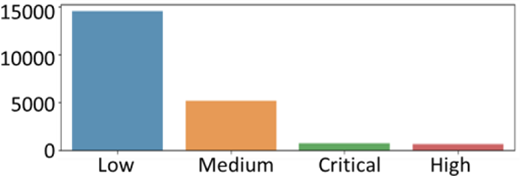
Training data frequency (Stage B)
Type of assets
| Mechanical Assets | Total | Architectural Assets | Total |
|---|---|---|---|
| lift | 1396 | door | 2507 |
| air conditioning | 1144 | window | 722 |
| boiler | 700 | roof | 336 |
| radiator | 614 | wall | 260 |
| chiller | 366 | lock | 162 |
| plant room | 353 | gate | 131 |
| fan | 320 | work top | 89 |
| heater Building | 113 | stair | 75 |
| management system (BMS) | 99 | slab | 71 |
| Air Handling Units (AHU) | 94 | shelf | 69 |
| freezer | 39 | desk | 63 |
| air handling unit | 35 | cabinet | 45 |
| pressurisation unit | 33 | whiteboard | 34 |
| control panel | 31 | noticeboard | 34 |
| cooling unit | 15 | seat | 24 |
| duct | 11 | keypad | 10 |
| dumbwaiter | 8 | pin board | 6 |
| heat exchanger | 5 | shelter | 5 |
| air compressor | 3 | paver | 5 |
| electric heating | 1 | dispenser | 4 |
| Plumbing Assets | Electrical Assets | ||
| toilet | 3049 | lighting | 3728 |
| tap | 544 | fire system | 965 |
| sink | 460 | outlet | 384 |
| drain | 416 | smoke detector | 104 |
| PiPe | 307 | camera | 44 |
| shower | 193 | intruder alarm | 39 |
| humidifier | 81 | sounder | 32 |
| cistern | 70 | card access | 32 |
| water pump | 54 | cooker | 19 |
| water tank | 43 | security detector | 10 |
| basin | 41 | bell | 3 |
| sewage | 28 | dishwasher | 1 |
| inverter | 14 | ||
| hot water system | 11 | ||
| water cooler | 9 | ||
| grease trap | 5 | ||
| gulley | 5 | ||
4.2 Performance
The performance of the method presented in this paper is evaluated with a python implementation developed in PyCharm framework, running in a Windows 8.1 operating system. Four classification metrics are used to display the performance of the proposed method. These metrics are: a) accuracy (see Equation ((1)), b) precision (see Equation (2) c) recall (see Equation (3)), and d) F1_score (see Equation (4)). Accuracy returns the fraction of correct predictions. Precision depicts how well the proposed method avoids from labelling as positive (TP) a sample that is negative (FP), whilst recall represents the efficiency of the classifier to find all the true positive samples (TP). Lastly, the f1_score is the weighted average of precision and recall. Table 3 shows the performance of the proposed method.
Performance of proposed method
| Class | Accuracy | Precision | Recall | f1 |
|---|---|---|---|---|
| Urgent | 0.62 | 0.59 | 0.69 | 0.64 |
| Non-Urgent | 0.64 | 0.54 | 0.58 | |
| Critical | 0.57 | 0.59 | 0.67 | 0.63 |
| High | 0.55 | 0.46 | 0.50 | |
| Medium | 0.58 | 0.58 | 0.69 | 0.63 |
| Low | 0.60 | 0.48 | 0.53 | |
| Average | 0.59 | 0.58 | 0.59 | 0.61 |
Each stage (A, B) is separately evaluated. Table 3 shows that all classification steps perform equally well under all four metrics. The proposed method returns an accuracy of 62% in terms of classifying the text-based feedback of the users as “Urgent” or “non-Urgent”, it features an accuracy of 57% in classifying the feedback as “Critical” or “High”, and lastly it scores an accuracy of 58% in labelling the feedback as “Medium” or “Low”.
The main limitation of the proposed method is that the accuracy of Stage A affects the performance of Stage B, since samples are first classified as ‘Urgent’ vs ‘non-Urgent’ before being classified as either ‘Critical’ vs ‘High’ or ‘Medium’ vs ‘Low’. One of the main reasons that the proposed method does not achieve a better accuracy, is that the experts were not entirely consistent throughout the years in terms of prioritization. Table 4 presents such examples. In this table, it is shown that the same maintenance issue (i.e. same importance and asset type) it is tagged with different response time. For instance, in #1 and #2, a faulty fire door is labelled as “nonUrgent” (response from 2-10 days), whilst the same issue in #3 and #4 is labelled as ‘Urgent’.
Non-consistent labelling of training data
| # | Text (input) | Label | Asset |
|---|---|---|---|
| 1 | GROUND FLOOR CORRIDOR FIRE DOOR DROPPED FRAME ISSUE REPAIR BROKEN DOOR | non-Urgent | Door |
| 2 | GROUND FLOOR TO BASEMENT THE FIRE DOOR IS BROKEN | non-Urgent | Door |
| 3 | Replace worn fire door that is not closing on alarm | Urgent | Door |
| 4 | Replace worn fire door seal to room SW02 | Urgent | Door |
| 5 | Taken from Email Good afternoon, We have a blocked toiler in the men’s fitness changing rooms. Would someone be able to come and unblock it? Thank you | Low | Toilet |
| 6 | Basement toilet is blocked | Medium | Toilet |
| 7 | The air conditioning unit in the SP clean room is not working. Please can someone attend. | Medium | Air conditioning |
| 8 | Air Con is not working in room M113C. Pls could B & C attend. | Low | Air conditioning |
| 9 | The radiator in room 416 is not working. | Low | Radiator |
| 10 | The heating in this office is not working properly. One of the radiators is like warm, the other is not working at all. | Medium | Radiator |
5 Conclusion
Up to present, while the maintenance cost remains high the budget that is allocated for it is limited. The wellbeing of occupants is directly linked with a good quality of maintenance management. Several studies are proposed focusing on prioritizing the maintenance works. However, they remain inefficient as they cause downtime and waste of resources. This paper exploits IoT and machine learning inference in order to prioritize maintenance tasks in a time and cost-efficient way. It hypothesizes that the priority of maintenance tasks can be predicted through historical data capturing the importance of the failure of the assets. The proposed method features a classification accuracy of 59% on average. The main limitation of the proposed method is that it is tested on historical maintenance data that are prioritized inconsistently. Future work will focus on: a) standardizing the labelling process in order to avoid such issues and increase the performance, b) focusing on assets with the most frequent issues in order to avoid strongly imbalanced training data, and b) establishing a semantic-based linkage with the digital twin of the building in order to increase the accuracy of estimating the impact that the failure of assets have on its users.
6 Acknowledgements
This research is an InnovateUK grant: “Social Networked Smart Infrastructure Assets”, project number #4360. Any opinions, findings, and conclusions or recommendations included in this paper are those of the authors and do not necessarily reflect the views of organizations and people mentioned above.