

1 Introduction
The need for sustainable infrastructure has led over the last decade to noteworthy advances in life-cycle Structural Health Monitoring (SHM) techniques. Fibre Optic (FO) sensing has emerged as a promising technology in the field, providing today the ability to measure strain, pressure or temperature with high precision and reliability at both the local and global level of the structure (Barrias et al., 2016). Recent SHM case studies, ranging from underground structural systems, such as soil piles (Pelecanos et al., 2018) and tunnels (de Battista et al., 2015), to high-rise buildings (de Battista et al., 2017) and railway bridges (Acikgoz et al., 2018), have shown that FO sensing may offer a detailed understanding of the structural behavior under external loading, soil deformation and environmental effects.
The idea of combining such advanced sensing technologies with big data analytics can lead to the development of better asset management and operational tools for sustainable infrastructure networks in the near future. For instance, Lau et al. (2018) presented the concept of the “self-sensing” bridge, proposing a streaming statistical analysis procedure for the real-time anomaly detection in the dynamic deformation of modern composite railway bridges with embedded FO strain sensors.
High sensitivity FO strain sensor networks that can cover large areas of infrastructure could be used effectively for the early detection and localization of damage and the development of real-time alert systems by detecting statistically significant changes in the response of the structure (Alexakis et al., 2019a). Which raises the questions: (a) what is a statistically significant change in the response of the structure? (b) at what level does this change correspond to real mechanical damage and material deterioration?
This paper aims to explore these question for the Marsh Lane Bridge; a Victorian railway viaduct in Leeds, UK (Figure 1). The multi-sensing system installed in the bridge, described in detail in Alexakis et al. (2019b), comprises a Fibre Bragg Grating (FBG) network to measure distributed dynamic deformation across three arch spans of the bridge, Acoustic Emission (AE) sensors to detect rates of cracking locally, and high-sensitivity accelerometers to study the dynamic response at critical locations.
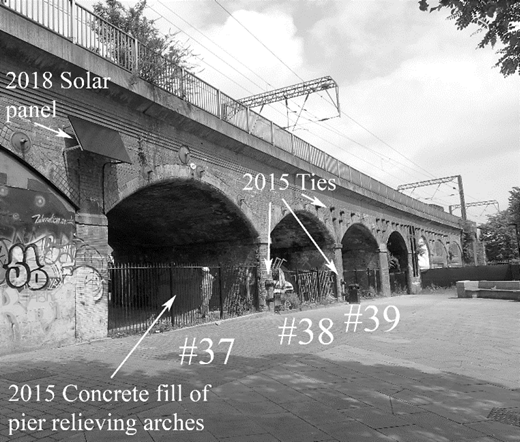
The Marsh Lane Viaduct in Leeds, U.K.
Post-processing of FO data revealed notable changes in the dynamic deformation of the bridge at different locations over the last two years (Alexakis et al., 2019a). The current study investigates whether combining FO dynamic strain and temperature data from the long-term monitoring of the bridge makes it possible to decouple the normal seasonal effect from abnormal structural behaviour, which is of critical importance for the development of reliable structural alert systems. This abnormal structural behaviour is further investigated locally with AE sensors, where cracking rates for the study of masonry deterioration are presented in the last section.
2 Description of the structure and the fibre optic monitoring system
The Marsh Lane Viaduct is located next to the Eastern entrance of Leeds Railway Station, in the centre of the city. The bridge was constructed between 1865 and 1869 (Hoole, 1973). Today it carries two electrified tracks with a traffic load that exceeds 200 trains per day, ranging from typical passenger trains to multi-wagon freight trains. Figure 1 shows the Southern side of the investigated section of the bridge, which comprises Arches 37, 38 and 39. Figure 2 identifies the main cracks observed under the arches with red lines (grey for B&W print). The most severe damages are concentrated over the relieving arches at the centre of the piers due to a spreading mechanism that forces the relieving arch keystone to descend and the pier walls to bow outwards (Acikgoz et al., 2018). For this reason, Network Rail, the owner of the bridge, conducted in 2015 an extensive repair by filling in the relieving arches with concrete and installing steel ties to arrest transverse movements of the piers and the spandrel walls, as shown in Figure 1. In addition, a longitudinal crack below the North track is observed in Arch 37, which is the most damaged arch of the bridge.
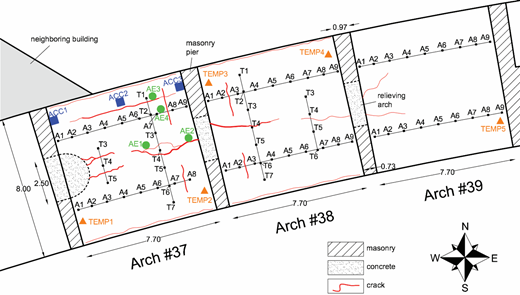
Plan view of the investigated section of the bridge, showing the main damages and location of sensors
Plan view of the investigated section of the bridge, showing the main damages and location of sensors
After the 2015 retrofitting intervention, a network of FBG strain sensors was installed underneath the Arches 37 and 38, allowing for the detailed study of their dynamic deformation (Acikgoz et al., 2018). This successful installation was followed by the permanent FO network installation, shown in Figure 2 with thin black straight lines in the longitudinal and transverse direction of the bridge.
The permanent FO network shown in Figure 2 comprises:
47 FBG strain sensors in the longitudinal direction, at the North and South sides of Arches 37, 38 and 39.
17 FBG strain sensors in the transverse direction, at the East and West sides of Arches 37 and 38.
Four FBG sensors attached to steel wires that connect the springings of Arch 37 and Arch 39, measuring relative horizontal displacement of the top of the piers. The steel wires are located just below the longitudinal sensor arrays.
Five FBG sensors calibrated to measure temperature, shown with orange triangles (light grey for B&W print).
For these 73 sensors, four custom designed cable arrays of FBGs were used. Each one of the four cable arrays has a Germanium doped single mode silica fibre with 20 FBG sensors distributed every one meter. The cables are fixed on the bricks using precision machined aluminium clamps, which appear as small black squares in Figure 2 and are numbered from West to East as A1-A9 and from North to South as T1-T7 for each arch. Figure 3 offers a closer view of the strain and temperature sensors with their clamps. Every FBG strain sensor measures strain between two clamps. In contrast, the FBG temperature sensor is embedded within the clamp, and follows the clamp thermal expansion. The clamp-FBG system was calibrated to measure ambient temperature in the Cambridge Centre for Smart Infrastructure and Construction (CSIC) Laboratory.
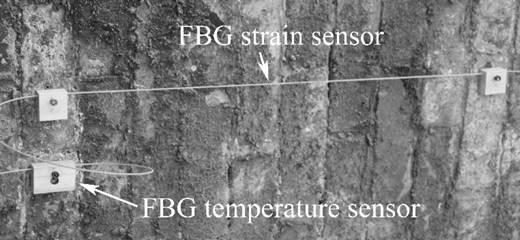
Fibre Optic strain and temperature sensors
This study presents results of the dynamic deformation of the bridge at the instance of train loading in terms of relative strain change, Δɛ, which is given by
In Equation (1), λo is the original transmitted wavelength, which is constant for each FBG sensor, λ is the instantaneous measured wavelength that changes with strain variation, and ρ = 0.23 is the photo-elastic constant.
The 4-channel sm130 Optical Sensing Interrogator of Micron Optics, Inc. that is used in this study offers 1 kHz sampling rate per sensor and 2-3 micro-strain (μɛ) resolution. It is continuously acquiring data, but is triggered to log only strains from train passage. The Data Acquistion system (DAQ) is permanently installed under Arch 37, inside a temperature controlled cabinet, and it is connected to a laptop with a router, which remotely transmits daily data through a 4G internet connection. The system is powered up by the solar panel shown at the top left corner of Figure 1. A more detailed desciption of the DAQ is offered by Alexakis et al. (2019b).
3 Change in mechanical deformation due to deterioration and environmental effects
Alexakis et al. (2019a) developed a signal processing and statistical analysis algorithm that uses FGB data to identify changes in dynamic strain of the bridge over time. The algorithm identifies the type of train loading (train direction, velocity, number of carriages, relative axle distance) and presents variations of the minimum and maximum dynamic strain per sensor under the same type of load.
Figure 4 (bottom-right) presents a typical dynamic response of the sensor “37NA6A7”, meaning the longitudinal sensor between clamps A6 and A7 at the North side of Arch 37 (see Figure 2). The signal corresponds to the most common passenger train type, the British Rail Class-185, with three carriages and a typical bogie weight of 33.4 tons. Positive values correspond to relative tensile strain, and negative to relative compressive strain. In this figure, the typical response of the 37NA6A7 sensor in July 2016 (black line) is compared with the response at the same location, same train, speed and direction in November 2017 (grey line), 15 months later. The dynamic deformation is significantly amplified, which compares well with the observed brick cracking at this location (Alexakis et al., 2019a).
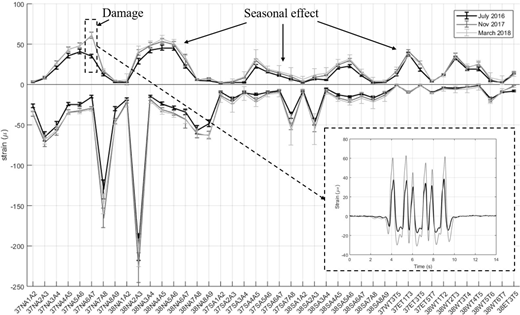
Mean value and standard deviation of the maximum and minimum peaks of FBG signals for 42 sensors underneath Arches 37 and 38, for the Class-185 3-carriage train that is heading East, exiting Leeds Station
Mean value and standard deviation of the maximum and minimum peaks of FBG signals for 42 sensors underneath Arches 37 and 38, for the Class-185 3-carriage train that is heading East, exiting Leeds Station
A similar comparison can be done for multiple sensor locations in terms of variation of the mean value of the maximum and minimum peaks of FBG signals for different time periods. Figure 4 compares the dynamic deformation of the bridge in July 2016 (black line), in November 2017 (grey line) and in March 2018 (thin light grey line) under the Class-185 3-carriage train. All trains have similar speed and same direction to permit direct comparison. For the July 2016 data, the statistical analysis was perform for 31 Class-185 trains heading East. For the November 2017 data, the analysis was perform for 19 trains, whereas for the March 2018 data, 42 train records were used. The individual markers per sensor are connected with lines to show more clearly any change in the trend (shift). In most locations, a uniform amplification of the dynamic deformation of the bridge is observed. However, the change in the dynamic behaviour of the bridge is more evident in the damaged region near sensor 37NA6A7 as discussed before. Similar statistical analysis can be performed for various types of trains with different direction and number of carriages revealing more regions with permanent change, as discussed by Alexakis et al. (2019a), and other locations with a cyclic seasonal response, as shown in Figure 4. The next section examines in detail whether this cyclic behaviour is related to temperature fluctuation and whether it is possible to distinguish between mechanical deformation change due to deterioration and environmental effects.
4 Study of temperature effect
This section presents statistical analysis results of the dynamic deformation of the bridge over one year period, from November 2017 to November 2018, since the installation of the permanent FO monitoring system, shown in Figure 2. The analysis is performed separately for the Class-185 trains heading East, and those heading West. This is because the trains heading East use the North track of the bridge, causing more deformation on the North side, whereas the trains heading West use the South track, more heavily loading the South side of the bridge, and causing a different deformation pattern.
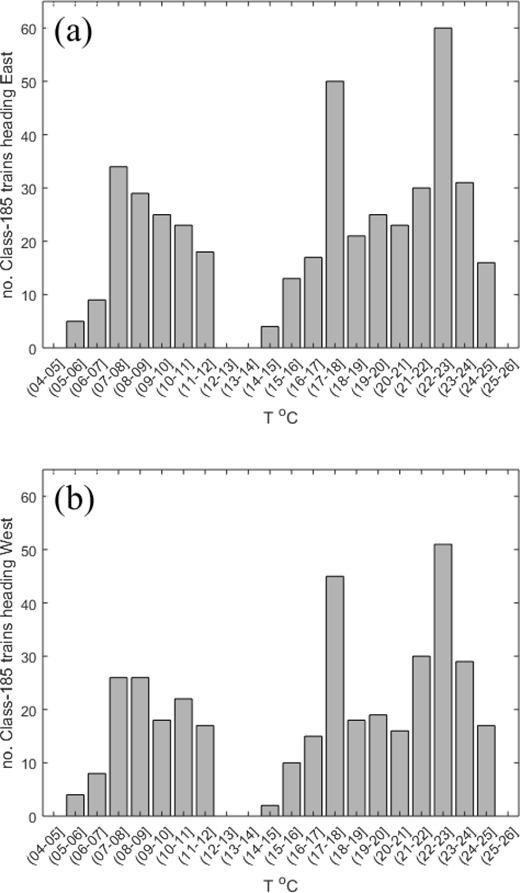
Figure 5 shows the number of train records used in the analysis for the Class-185 train heading East (Figure 5(a)) and West (Figure 5(b)) and their temperature distribution for every Celsius degree increase, from 4 to 26 °C. The temperature is calculated as the mean value of the five FBG temperature sensors at the instance of train loading; the location of the temperature sensors are indicated in Figure 2 with small triangles.
Temperature distribution of load events for the Class-185 train, heading East (a) and West (b)
Temperature distribution of load events for the Class-185 train, heading East (a) and West (b)
The population of the train records is bigger in the 15-25 °C range compared to the 5-15 °C range. This is because the 15-25 °C range corresponds to the sunny days of summer 2019. As a result, the solar panel was providing more power to the DAQ system, allowing more monitoring hours per day, more days per week. The DAQ was designed to be self-sustaining and remotely controlled and initiates automatically whenever power is available.
Based on the temperature distribution shown in Figure 5, the statistical analysis shown in Figure 6 was performed for four groups of train records with temperature range:
Mean value and standard deviation of the maximum and minimum peaks of FBG signals for 68 sensors and for four different temperature ranges that corresponds to the Class-185 3-carriage train heading East (a) and West (b)
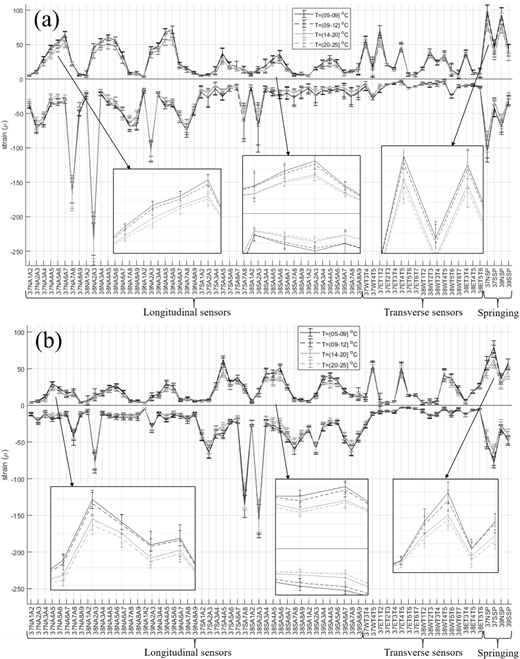
Mean value and standard deviation of the maximum and minimum peaks of FBG signals for 68 sensors and for four different temperature ranges that corresponds to the Class-185 3-carriage train heading East (a) and West (b)
Figure 6 shows the mean value and standard deviation of the maximum and minimum peaks of FBG signals for 68 sensors and for the four temperature range groups, for Class-185 3-carriage trains heading East (Figure 6(a)), exiting Leeds Train Station, and West (Figure 6(b)), entering Leeds Train Station. The horizontal axis indicates which sensors measure strain variations in the longitudinal direction of the bridge, which in the transverse direction and which corresponds to the four steel wires at the arch springings.
Both Figure 6(a) and Figure 6(b) show a very consistent variation of the dynamic deformation of the bridge depending on the ambient temperature. In particular, during the cold days, both the relative tensile and compressive mechanical strain due to train loading increases uniformly, whereas, during the hot days, the dynamic deformation of the bridge decreases. Occasionally, selective areas of the graph have been enlarged to better show this pattern. The black continuous line that corresponds to the coldest days is always the exterior line, whereas the grey dashed line that corresponds to the hottest days is always the interior line.
Interestingly, although the effect of the temperature variation on the dynamic deformation of the bridge in the longitudinal direction is uniform, it is less intense in the transverse direction. This can be explained by the fact that the bridge is constrained in the longitudinal direction, but not in the transverse. As a result, an increase in temperature may result in thermal induced compressive stresses in the longitudinal direction that further “lock” the structural parts of the bridge, reducing its dynamic deformation every time a train is passing. In contrary, the bridge can freely expand in the transverse direction when temperature increases.
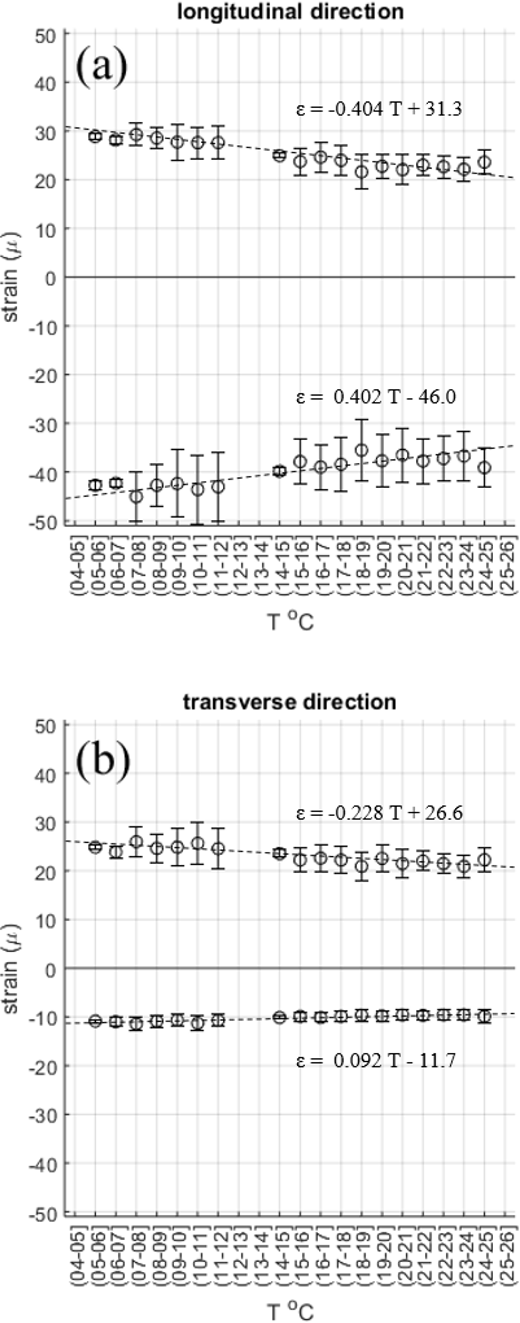
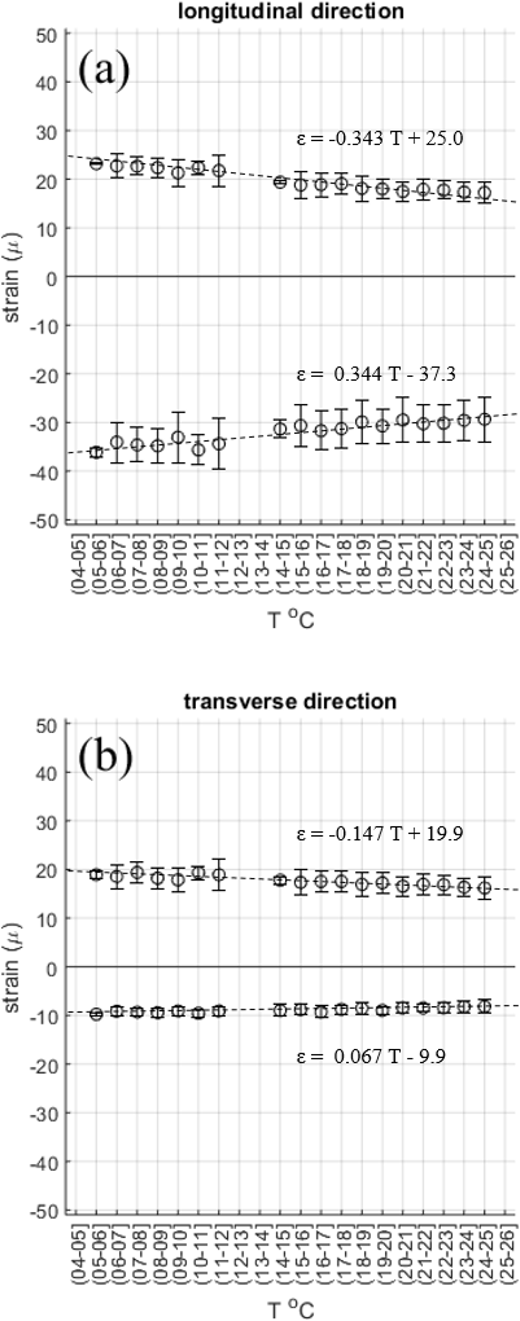
In order to further investigate this behaviour, a statistical analysis was conducted to evaluate the variation of the mean value of the maximum and minimum dynamic strain of all sensors for every Celsius degree increase. Figure 7(a) shows the mean value of the dynamic deformation in the longitudinal direction, whereas Figure 7(b) in the transverse direction, for Class-185 trains heading East. Figure 8 offers the same plots for trains heading West.
Temperature effect on the mean value of the dynamic deformation of bridge in the longitudinal (a) and transverse (b) direction for the Class-185 trains heading East
Temperature effect on the mean value of the dynamic deformation of bridge in the longitudinal (a) and transverse (b) direction for the Class-185 trains heading East
Temperature effect on the mean value of the dynamic deformation of bridge in the longitudinal (a) and transverse (b) direction for the Class-185 trains heading West
Temperature effect on the mean value of the dynamic deformation of bridge in the longitudinal (a) and transverse (b) direction for the Class-185 trains heading West
Figure 7 and 8 show a linear relation between temperature and dynamic strain and verify the observations in Figure 6 that the dynamic deformation decreases with temperature increase. As expected, the temperature variation affects less the transverse direction. Figure 7 and 8 also show with dashed line the best fit line and its corresponding equation. The dynamic strain is expressed in micro-strain (μɛ), and the temperature, T, in °C.
Figure 7(a) shows that for every Celsius degree increase, the mean value of the peak-to-peak amplitude of the signals from the sensors measuring strain variation in the longitudinal direction decreases by 0.404+0.402 ≈ 0.8 μɛ. This is the result from the statistical analysis that takes into account only trains heading East. For the trains heading West the corresponding result is similar, and in particular, for every 1 °C increase, the strain variation in the longitudinal direction drops by 0.343+0.344 ≈ 0.7 μɛ, as shown in Figure 8(a).
Similar observations can be made for the transverse direction. In particular, Figure 7(b) shows that for every 1°C increase the mean value of the strain variation drops by 0.228+0.092 ≈ 0.3 μɛ, which corresponds to Class-185 trains heading East. For trains heading West, Figure 8(b) shows that for every 1°C increase the mean value of the strain variation drops by 0.147+0.067 ≈ 0.2 μɛ.
These values should be taken into account for the development of high-sensitive and effective structural alert systems. A more refined multivariate statistical analysis in the future, based on a bigger variety of train loads, could further individualize rates of temperature effect for each sensor separately. Given that the FO sensors are very sensitive and able to capture tiny changes in the dynamic deformation of the bridge, the capability to decouple the normal seasonal effect from abnormal mechanical behavior through long term monitoring and statistical analysis is encouraging for the development of early damage detection systems.
Locations that show a permanent change in the dynamic deformation long term may be the result of simple stress redistribution or extended material deterioration. The response of these locations can be further examined locally with the use of acoustic emission sensors, as discussed in the following section.
5 Study of local deterioration with acoustic emission sensors
Acoustic emission (AE) is a phenomenon where transient elastic waves are generated by the rapid release of energy, typically due to sudden irreversible changes in the internal structure of the material such as cracking (Miller and McIntire, 1987). AE sensors are piezoelectric sensors used to detect elastic waves, which have extremely small amplitude (in the order of nm) and very high frequency (in the order of 10 kHz to over 1 MHz), requiring data acquisition systems with high sampling rates.
In this study, AE sensors have been installed to detect rates of cracking at four critical locations in Arch 37, as shown in Figure 2 with green circles (grey for B&W print) and numbered as AE1-AE4. MISTRAS R6α general purpose sensors were selected, with 60 kHz resonant frequency and 35-100 kHz operating frequency range. Sensors AE1-2 have been placed next to the crack over the relieving arch at the Eastern side of Arch 37, which continues to propagate. AE2 measures cracking rates at the origin of the crack, where the current crack width is > 2 cm, and AE1 measures near the tip of the crack near the keystone, where the crack width is < 2 mm. Sensor AE3 was placed next to the longitudinal crack of Arch 37. Sensor AE4 was placed near FBG sensors 37NA6A7 and 37NA7A8, at the North side of Arch 37. This is the location with the biggest change in dynamic strain since July 2016, where crashing of bricks has been observed.
According to Alexakis et al. (2019a), the sensors with the biggest permanent amplification of the dynamic strain since July 2016 are the longitudinal sensors in the vicinity of the pier between the most damaged Arches 37 and 38, and in particular the sensors: 37NA6A7, 37NA7A8, 37SA7A8, 38NA2A3 and 38SA2A3. Near these sensors there are symmetric transverse cracks, related to the out-of-plane rocking of the pier (Acikgoz et al., 2018). To better study this behavior in the near future, three high-sensitivity accelerometers have been installed at the springings and keystone of the North side of Arch 37, as shown in Figure 2 with blue squares (dark grey for B&W print).
A National Instruments (NI) cRIO controller collects data from the AE sensors and the accelerometers, offering up to 1 MHz and 500 Hz sampling rate respectively.
AE data logging and analysis approaches can be divided in two categories (Shiotani et al., 1999, 2003): (i) the parameter-based approach and (ii) the signal-based approach. In the first case, only values of AE parameters of the signal are stored, such as the amplitude of the signal or the total number of times the signal exceeds a threshold level, usually taken just above the signal noise, which is called the number of counts. This approach reduces considerably the amount of data to transfer and it can be suitable for long-term monitoring of large scale structures. In the second case, the whole signal is stored, permitting a detailed post-processing analysis. However, this approach requires sufficient storage space and computational power, due to the high (MHz) sampling rate. Obviously, storing the whole signal permits both parameter-based and signal-based analysis.
For this installation, a LabVIEW software was developed that gives the user the option to perform both types of analysis, either storing AE parameters of every cracking event, or storing the whole signal. Given the long-term character of the installation, the remote monitoring system is set to process real time the signal directly in the FPGA (Field Programmable Gate Arrays) chip of the controller and store only the peaks and the number of counts of every cracking event. The idea of this setup is to observe long term any change in the rate of the number of counts or the amplitude of the AE signals, in order to identify any progress in material deterioration.
This study combines the information from the FO sensor network that identifies the type of train (direction, number of carriages, speed) with the AE cracking rates, which offers the possibility to observe changes in cracking rate under repeated train loading over time.
For instance, Figure 9 presents (a) the cumulative number of counts per train loading, meaning the number of times the AE signal exceeded the preset threshold above the noise level, which was 40 dB for this study, and (b) the maximum signal amplitude per train loading. The results shown in Figure 9 are always for the 3-carriage Class 185-trains heading East, for one month monitoring period, between 26th of October to 27th of November 2018. The keystone crack next to AE1 was considerably more active compared to the other crack locations and the sensor was triggered 96% of the times the Class-185 train passed over the bridge. The triggering rate was 12% for AE2, 39% for AE3, and 21% for AE4.
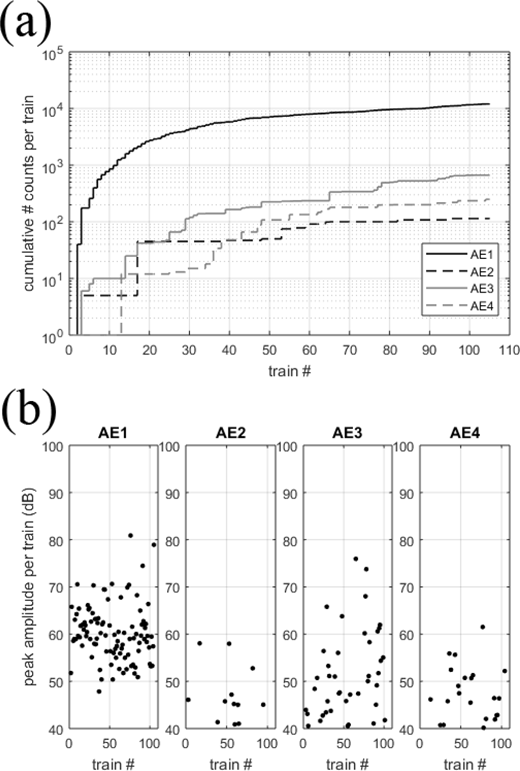
Cumulative number of counts (a) and maximum AE amplitude (b) per Class-185 train passage heading East
Cumulative number of counts (a) and maximum AE amplitude (b) per Class-185 train passage heading East
Figure 10 presents similar results to Figure 9, with the difference that the Class-185 train is heading West, loading more the South side of the bridge. As a result, the train loading barely affects the regions near AE3-4 at the North side of Arch 37. The triggering rate was 69% for AE1, 4% for AE2, 1% for AE3 and 0% for AE4.
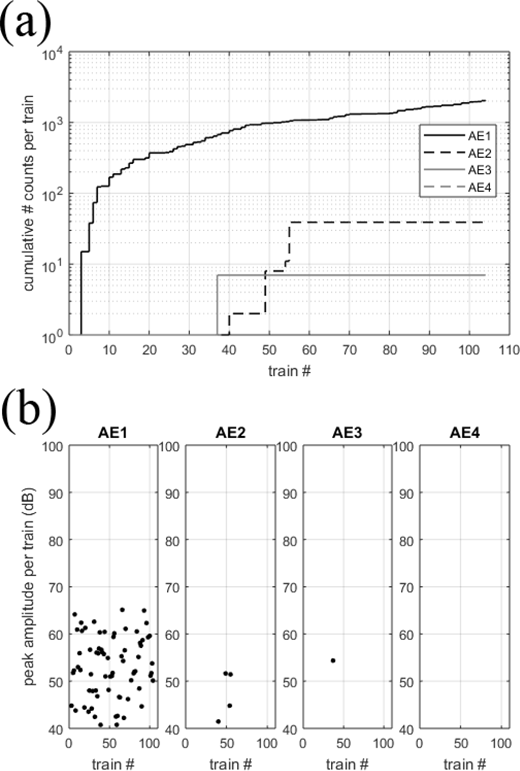
Cumulative number of counts (a) and maximum AE amplitude (b) per Class-185 train passage heading West
Cumulative number of counts (a) and maximum AE amplitude (b) per Class-185 train passage heading West
Long term monitoring can observe the variation of the number of counts, signal amplitude and triggering rate per sensor location for each type of train load separately and combine it with real-time statistical analysis to identify unexpected behaviour.
6 Conclusion
High sensitivity sensors for the monitoring of local or global structural behaviour, such as fibre optic strain sensor networks or acoustic emission sensors can be used for the development of early damage detection systems for infrastructure networks. The high-sensitivity nature of these sensors creates the need to decouple changes in structural behaviour due to real mechanical deterioration from normal seasonal effects.
This study presents a statistical analysis process of fibre Bragg grating signals from a long-term multi-sensing monitoring system installed in a masonry rail bridge in Leeds, UK, which aims to identify the effect of ambient temperature in the dynamic deformation of the bridge, in order to better distinguish changes in structural behaviour due to masonry deterioration.
The study shows a clear linear relation between temperature and dynamic deformation, which is different in the longitudinal and transverse direction of the bridge. In particular, as temperature increases, the dynamic deformation decreases in the longitudinal direction in a nearly uniform manner in all sensor locations, whereas in the transverse direction the decrease is smaller. This is to be expected since the thermal expansion is constrained only in the longitudinal direction. A more detailed study of the temperature effect per sensor location could result in individual correction factors for the development of early warning structural alert systems.
The paper further studies local material deterioration at four critical locations of the bridge with acoustic emission sensors. Combining the two sensing technologies it is possible to track long term changes in cracking rates for a specific type of train loading, which increases the reliability of the results.
7 Acknowledgements
This work is being funded by the Lloyd’s Register Foundation, EPSRC and Innovate UK through the Data-Centric Engineering programme of the Alan Turing Institute and through the Cambridge Centre for Smart Infrastructure and Construction. Funding for the monitoring installation was provided by EPSRC under the Ref. EP/N021614/1 grant and by Innovate UK under the Ref. 920035 grant. The authors are grateful to Network Rail for providing power, technical support and site access for this research.
