

Notation
1 Introduction
Masonry arch bridges form an important part of the UK road and railway networks. Many are now approaching an operational life of 150 years while working loads have risen considerably. There is a growing interest in understanding more precisely their structural response under these new vehicle loads. This is especially the case because, currently, the service response may not be directly considered in an assessment despite it being this which will drive deterioration.
The behaviour of masonry arch bridges can be harder to interpret when the bridge is also skewed. Most arch bridges will “span square”, meaning that the span direction is perpendicular to the bridge abutments or piers, such that in plan view the bridge is rectangular. However, when it is not possible to construct the bridge in this way then skewed construction may be used instead. Now the span direction is offset from what would be the square span direction by a skew angle and in plan view the bridge is a parallelogram.
While, in square arch bridges, the flow of force is assumed to follow the shortest possible load path through the arch barrel, i.e. along the square span direction, it is less clear that this should always be the case for bridges which are skewed. Although this is the advice which is commonly given to asset engineers (McKibbins et al., 2006), and results from some computational studies have appeared to support this view (Milani and Lourenço, 2012), others have pointed out the lack of experimental information to corroborate this view and have suggested that the full picture may be more complicated (Harvey, 2013). There is, therefore, a strong motivation to investigate skewed masonry arch bridges through monitoring.
The structural response can also be impacted by damage. Common types of damage for masonry arch bridges include separation cracks between the arch barrel and spandrel walls, ring separation in multi-ring brick arch barrels, and longitudinal or transverse cracking of the arch barrel. All of these have the potential to alter the load path through a masonry arch bridge and may also reduce its load carrying capacity. It can be highly important to understand historic damage of these kinds, particularly when an existing structure is to be repaired or strengthened. Oftentimes, interventions will use new materials such as steel, with very different properties to the original masonry. The resulting modification of local stiffness can also change the overall load path and sometimes, perhaps counterintuitively, such repairs may lead to further damage.
1.1 Bridge CFM-5
The bridge considered in this study is Barkston Road Bridge, designated CFM-5 by Network Rail, the asset owner. This is a skewed, single-span railway bridge located near Barkston Ash, UK. It carries both local and cross-country passenger rail services, as well as occasional freight. The bridge was completed in 1868 and carries rail traffic over a local road at a skew angle of 26°. The arch barrel is constructed in brickwork, with the bricks laid helicoidally to follow the skewed span direction, while all other components of the bridge consist of stone blockwork.
The bridge has suffered historic damage during its operational life. Both sides of the arch barrel exhibit separation cracks with the spandrel walls, and there is an additional longitudinal crack in the south-eastern corner of the arch barrel. Furthermore, the spandrels and the north-eastern and south-western wing walls show signs of bulging.
These sources of damage were addressed through intervention work in 2016. Ten tie rods were fitted through the bridge, to restrain transverse movement of the spandrel walls, and the three notable cracks were comprehensively stitched and grouted. Soil anchors were installed on the wing walls which had been observed to have bulged. Although this work was recently carried out, the length of time over which the intervention will remain effective is uncertain. This provides additional motivation for the monitoring project.
Figure 1 shows bridge CFM-5, while Figure 2 highlights the major cracks. Figure 3 shows signs of the recent intervention at the southern spandrel wall, in particular the grout marking where the separation crack has been stitched through each stone on the spandrel wall.
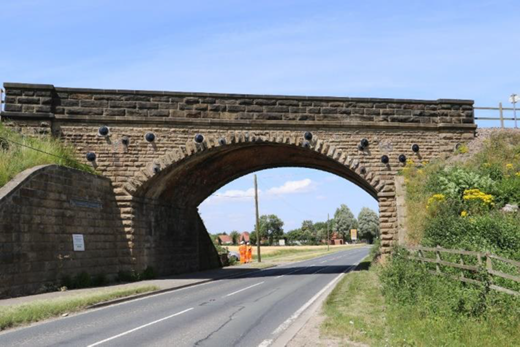
Bridge CFM-5, as viewed from the south
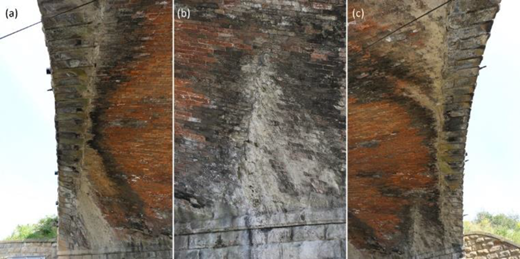
Key cracks at bridge CFM-5: (a) the northern spandrel separation crack, (b) the south-eastern longitudinal crack to the arch soffit, and (c) the southern spandrel separation crack
Key cracks at bridge CFM-5: (a) the northern spandrel separation crack, (b) the south-eastern longitudinal crack to the arch soffit, and (c) the southern spandrel separation crack
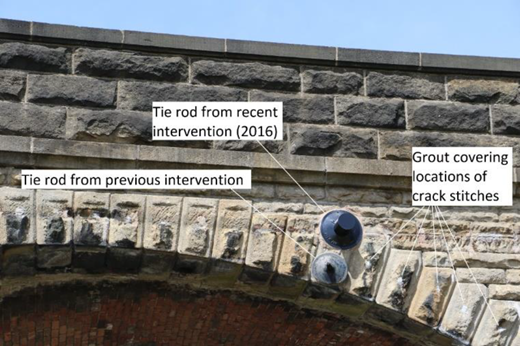
Evidence of crack stitching at the southern spandrel wall crack
1.2 Review of FBG sensing
Fibre Bragg Gratings (FBGs) are point sensors which are embedded into fibre optic cables during their manufacture. Over a small region of the fibre, the refractive index is periodically varied. This periodicity means that a corresponding wavelength of light, known as the Bragg wavelength, is strongly reflected by this sensor.
As the fibre is axially strained, the FBG’s periodicity is slightly altered, and this is registered as a shift in the Bragg wavelength. This shift can be measured by an FBG interrogator and converted into a combination of thermal and mechanical strain. For medium or long-term (i.e. static) monitoring, the thermal effects must be accounted for. However, for short-term dynamic events such as the passage of a train, thermal effects will only influence the steady-state strain while it is the dynamic variation that is of interest. This variation is purely mechanical.
Current limits on manufacturing mean that a maximum of 20 FBGs can be built into a single fibre optic cable, while present Micron Optics FBG interrogators can monitor 4 cables simultaneously at a sampling rate of 1 kHz. Therefore, up to 80 FBG sensors are available in a standard installation using this system.
1.3 Review of LiDAR analysis
Current surveying technologies make it simple to capture detailed point clouds describing the visible geometry – specifically, external surface profiles – of civil engineering structures. This is particularly useful to the engineer when “as-built” drawings are not available, as was the case for CFM-5.
Having obtained this data, novel post-processing techniques allow for further analysis. For example, the point cloud can be compared against assumed reference geometries, such as planes and cylinders, which may be taken to represent the intended as-built geometry of the structure. The discrepancy between the current and the reference geometries can then be analysed to estimate long-term static deformations.
Furthermore, this discrepancy generated from the actual point cloud can be compared against theoretical discrepancies generated from the most common theoretical deformation mechanisms, such as those resulting from span opening or closing, or from differential settlements. Inspection of the discrepancy features reveals which mechanisms are permissible; the associated long-term movements can then be inferred (Ye et al., 2018).
1.4 Research questions
Bridge CFM-5 has been monitored using laser scanning and FBG sensing, amongst other methods which are outside the scope of this paper. Using this monitoring data, it is possible to address the following research questions.
What is the current deformed profile of the bridge? What is the most likely mechanism, or mechanisms, that could have resulted in this profile, and what magnitude(s) of settlement(s) would be required to achieve this profile?
What is the current flow of force through the arch barrel? What mode of response does this suggest?
Is there any potential relationship between the historic deformation mechanisms and the current response?
Is there any potential relationship between the current response and the recent intervention work?
2 Methodology
Monitoring of bridge CFM-5 began in summer 2018. It was not possible to take measurements of the bridge response prior to the intervention work in 2016. Evidence from inspection reports of the bridge suggests that this work caused a substantial reduction in the magnitude of response, although this cannot be quantified.
The monitoring technologies described below form part of a larger monitoring project at CFM-5, which is a collaboration between the Cambridge Centre for Smart Infrastructure and Construction (CSIC), Network Rail, and AECOM, an engineering consultancy.
2.1 FBG installation
Previous work by CSIC has shown that FBG installations can provide detailed dynamic data on the response of masonry structures (Acikgoz et al., 2018). In this study, however, a novel implementation of the FBGs was employed. The fibre optic installation at CFM-5 is shown in Figure 4(a). FBGs were used to measure across the south-eastern longitudinal crack and southern spandrel separation crack (bottom half of Figure 4(a)). The distributions of these crack strains will be analysed in future work. However, of principal interest in this paper are the FBGs that were arranged in triangular rosette formation across the northern half of the bridge (top half of Figure 4(a)). In Figures 4(a) and 4(b), the skewed span is horizontal.
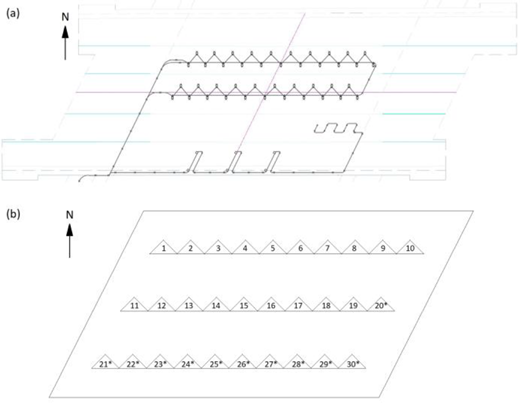
Plan views of CFM-5 showing (a) the installed FBG sensors and (b) the full arrangement of FBG rosettes, which consists of both installed rosettes and “imaginary” rosettes (marked “*”) for which results are inferred from the installed rosettes using symmetry
Plan views of CFM-5 showing (a) the installed FBG sensors and (b) the full arrangement of FBG rosettes, which consists of both installed rosettes and “imaginary” rosettes (marked “*”) for which results are inferred from the installed rosettes using symmetry
Two lines of these rosettes were positioned on the arch soffit, under the centreline of the northern track (rosettes 1 to 10 in Figure 4(b)) and the centreline of the overall bridge (rosettes 11 to 20* in Figure 4(b)). Because the bridge is relatively undamaged in these regions, it was hoped that the measured response could be taken to be reasonably indicative of the response of skewed masonry arch bridges in general.
At CFM-5, trains on the north and south track (the DOWN and UP lines) always travel in opposite directions. Traffic in both directions is comprised of the same train classes, so that loading on the two lines is similar. Therefore, there is rotational symmetry in the dynamic loading that is applied to the bridge on the north and south tracks. This can be extended to an assumption of rotational symmetry in the bridge response, which can be tested by examining strains at the bridge centreline (rosettes 12 to 19, specifically) for trains on the two lines. Results so far support this assumption.
By assuming this symmetry in the bridge response, the FBG rosettes under the northern track can also be used to predict strains for a further line, underneath the centreline of the southern track. Figure 4(b) shows the overall arrangement of rosettes at bridge CFM-5. Here, rosettes 1 to 19 were actually installed and monitored while the “imaginary” rosettes, for which results are inferred, are denoted with an asterisk (*).
Rosettes 21* to 30*, under the southern track, would be the equivalent of rosettes 1 to 10, under the northern track. Rosettes could not be installed under the south track, however, due to the need to monitor cracks in this region (see the bottom half of Figure 4(a)). Furthermore, loss of one FBG, due to fibre breakage during installation, meant that rosette 20 was incomplete; results at this location are inferred from measurements at rosette 11, again using symmetry. Consequently, results are directly measured for rosettes 1 to 19 and inferred for “imaginary” rosettes 20* to 30*.
In this installation, clamps were drilled into the masonry arch soffit and used to connect the fibre optic cables. This meant that good strain transfer was assured and the FBGs measured average strains over gauge lengths set by the clamp separation, which was 1 m in this installation. A single Micron Optics FBG interrogator was used to record data at a sampling rate of 1 kHz.
2.2 Principal strain analysis
For each rosette, an FBG is located on each side of the triangle. These three measured strains are sufficient to describe the general strain state, averaged over the 0.25 m2 area of each triangle. The rosette strains are denoted εa, εb and εc. Taking a global X axis to be aligned with east, along the skewed span direction, the rosette strains can be transformed to give the strain state within a local coordinate system x-y, oriented at some angle ϕ from the global X axis. Equation (1) relates the rosette strains to these local coordinate strains εx, εy, and εxy. Here, θ is the rotation angle between the local x axis and the axial direction of the rosette strain in question. Since there are three unknowns in this coordinate system, the three rosette measurements are sufficient to solve the local strain state.
Principal strains will be aligned with the critical value of ϕ for which εxy = 0. It was found that no one value of ϕ achieved this throughout the entire passage of a train, so instead critical values of ϕ were evaluated at times of interest during this event.
2.3 LiDAR post-processing strategy
Detailed point cloud data for bridge CFM-5 was captured using a FARO Focus 3D laser scanner. This LiDAR technology allowed for accurate assessment of the “as-is” geometry of the bridge. After segmentation of the point cloud to leave only the arch barrel, as shown in plan view in Figure 5, the point cloud could be compared against a “best-fit” cylinder to produce an error map of deformations from this assumed “as-built” geometry, by plotting the discrepancies between the real arch and the “best-fit” cylinder. It can be shown that the arch barrel is a cylindrical shell, where the axis of the cylinder is parallel with the bridge abutments.
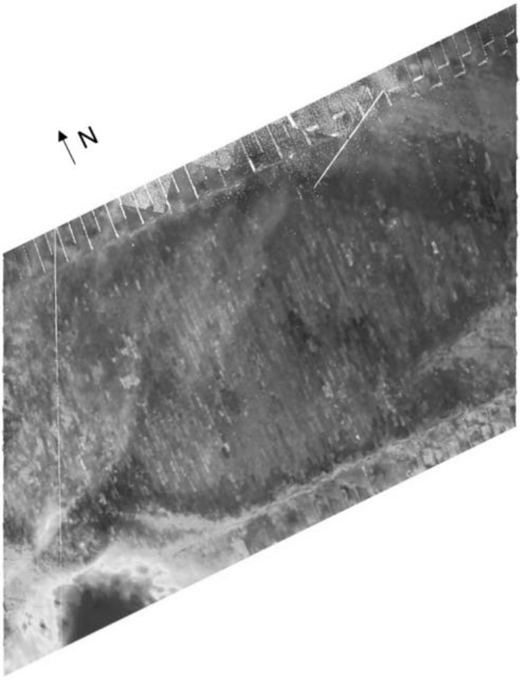
Plan view of the arch barrel point cloud
Individual “2D” slices of the point cloud, as shown in Figure 6, were also analysed, against theoretical circular (or elliptical) segments which describe the assumed reference geometry. Because the axis of the “best-fit” cylinder is parallel with the bridge abutments, slices in the skewed span direction will be elliptical whereas slices in the square span direction will be circular. Originally, slices were taken in both the square and skewed span directions for further investigation. However, it was found that slices in the skewed span direction were mostly dominated by noise and could not be resolved into a sensible deformation mechanism. Therefore, only the slices in the square span direction will be presented here.
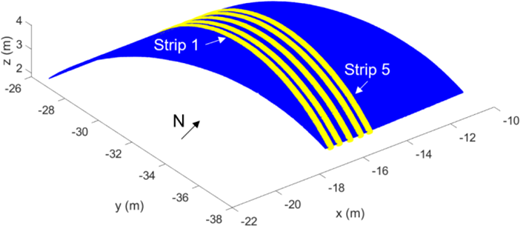
Slices analysed in the square span direction
2.4 Comparison with standard mechanisms
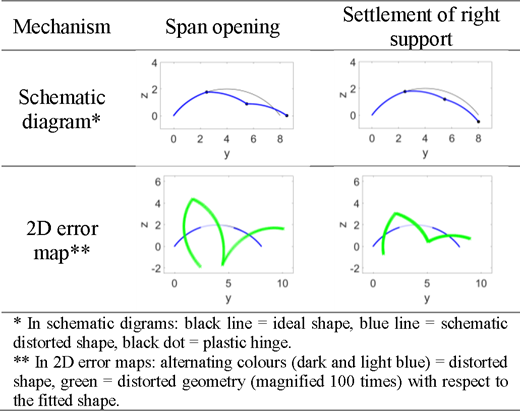
Once a slice has been compared with its “best-fit” circular geometry, the resulting error map, with discrepancies being magnified to aid visualisation, can be compared against error maps of standard arch mechanisms that would result from common long-term deformations, such as span opening or closing or differential support settlement. Inspection of the error maps reveals which mechanisms are compatible with the deformed geometry. These permissible mechanisms can then be fitted against the actual error map to infer the likely amount of support movements. Previous work has established that this method can produce informative results for masonry arch bridges and viaducts (Ye et al., 2018). However, this is the first time that the method has been extended to skewed arch bridges.
Although the database contains several standard mechanisms for arch deformation, only two were found to be feasible for the data slices analysed at bridge CFM-5. These are two partial asymmetric mechanisms for span opening and for relative settlement of one abutment respectively. These mechanisms are presented in Table 1.
Permissible historic deformation mechanisms
 |
3 Results
3.1 Typical FBG results
As trains pass over the bridge, the orientation of the coordinate system containing the principal strains varies. The time history of a typical train event is shown in Figure 7; this corresponds to the passage of a two-carriage local passenger train of class 144.
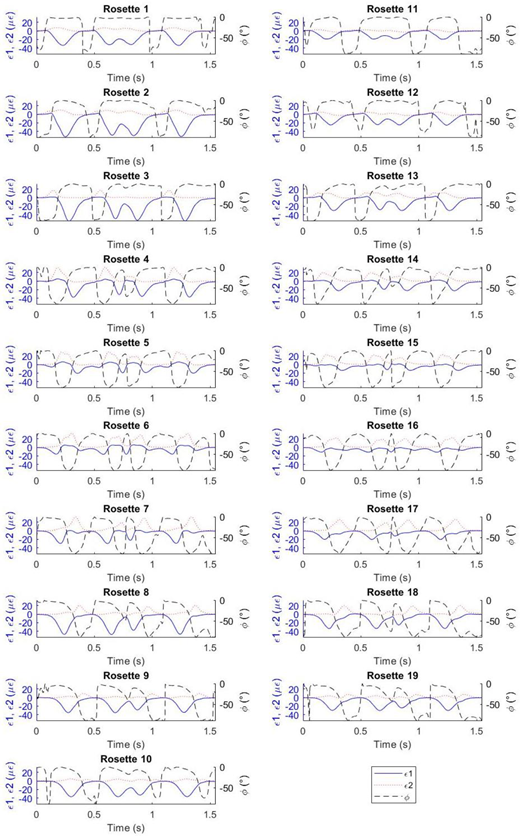
Time histories of principal strains for a typical train event
Results are shown for rosettes where direct measurements were taken (i.e. rosettes 1 to 19 of Figure 4(b)). Here, ε1 and ε2 are the two principal strains; the convention is that tensile strains are positive. Meanwhile, ϕ is the orientation of ε1. The convention here is that ϕ = 0 corresponds to the skewed span direction, facing east, and that positive rotation is measured clockwise when the bridge is viewed in plan.
Although there is no critical value of ϕ which is constant throughout the passage of a train, the values of ϕ at times of key peaks in train events are remarkably constant between all recorded data sets. This is the case even between data sets corresponding to different classes of trains, and between trains with different numbers of carriages. Therefore, it is informative to consider times of key peaks in the strain data. For instance, when train axles are positioned directly above a given rosette, the local tensile principal strain tends to reach a peak in this rosette. The principal strain maps in Figure 8 correspond to times at which train axles are located above rosettes 3 to 8. The data presented in this figure is for a class 144 train, the most common type of loading for this bridge.
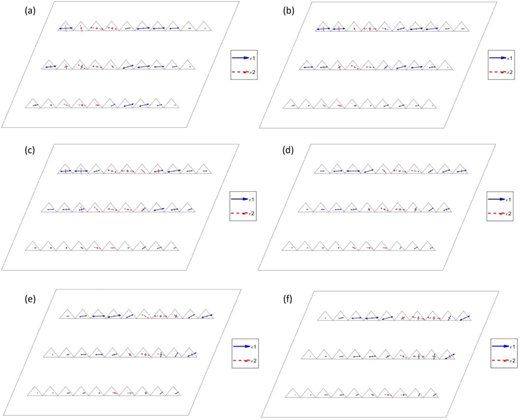
Principal strains mapped across the arch barrel of bridge CFM-5 for a typical 2-carriage train travelling on the northern (top) track, for cases where the axle loads are applied directly above (a) rosette 3, (b) rosette 4, (c) rosette 5, (d) rosette 6, (e) rosette 7, and (f) rosette 8; ε1 is compressive and ε2 is tensile
Principal strains mapped across the arch barrel of bridge CFM-5 for a typical 2-carriage train travelling on the northern (top) track, for cases where the axle loads are applied directly above (a) rosette 3, (b) rosette 4, (c) rosette 5, (d) rosette 6, (e) rosette 7, and (f) rosette 8; ε1 is compressive and ε2 is tensile
3.2 Interpretation of current response
It can be seen from Figures 7 and 8 that ε1 is always compressive, lying in the range -7 to -56 με, while ε2, which is tensile, lies in the range 2 to 40 με. Whether compressive or tensile, the dominant principal strain at each rosette tends to be approximately aligned with the skewed span direction. Secondary principal strains at each rosette tend to be very small, suggesting that the primary response mode is for forces to flow through the arch following the skewed span. The presence of an axle load overhead causes tensile strains to dominate locally, while strains elsewhere are compressive.
This is in keeping with the thrust line that would be expected for a patch load applied to an arch: local to this loaded region the thrust line approaches the extrados and strains at the intrados are tensile, while on either side of this region the thrust line drops to approach the intrados and, in doing so, causes strains at the intrados to become compressive. Note that when the axle load is on either end of the bridge (Figures 8(a) and 8(f)) the compressive strains at the opposite springing become small, indicating that the thrust line into the pier is relatively high (and potentially through the fill above the pier).
Tensile strains rise from a minimum at the arch haunches to a maximum over the central third of the arch. The distribution of compressive strains is more complicated, with maximums occurring at the outer two quarter points of the arch span, while minimum compressive strains occur near the arch crown.
This is also in keeping with the anticipated thrust lines. When load is applied above, say, the quarter span point of the arch, the thrust line approaches the extrados at this location and will come closest to the intrados, causing maximum compressive strains, at the opposite quarter span point. Additionally, since load will be laterally distributed as it passes through the fill material above the arch, it makes sense for tensile strains to be highest at the arch crown, where there is the least potential for load distribution and therefore the most concentrated loading is applied to the arch.
While the rosettes are typically characterised by a single dominant principal strain, approximately aligned with the skewed span direction, there are some exceptions to this. In Figures 8(d) to 8(f), points on the eastern side of the bridge, such as rosettes 9, 10, 19 and 20, exhibit compressive principal strains that appear to be inclined from the skewed span direction, oriented instead towards the north-eastern corner. One potential explanation for this could be that, since the brickwork barrel is laid helicoidally starting from north-eastern and south-western corners, this construction method has imbued these corners with additional stiffness and that these corners therefore present a preferable load path.
Another exception is seen in Figures 8(a) to 8(c), in which rosettes 1, 2, 11, 12, and 13, in the north-western corner of the bridge, show noteworthy secondary principal strains. These strains are tensile and perpendicular to the skewed span direction. The presence of tensile strains in the transverse direction of the bridge provides an indication that the bridge is responding to applied loads through transverse bending of the arch barrel. If this is the case, then the arch is transferring loads into the stiffer spandrel walls rather than carrying them directly to the abutments.
Lastly, the distribution of compressive strains across the bridge span is interesting, since the locations of maximum and minimum strains correspond to points where hinges might be expected in a more damaged arch. Furthermore, if these locations are compared between the two lines of monitored rosettes, it is seen that these are aligned with the transverse of the square span, rather than that of the skewed span. Although this is not sufficient evidence to be conclusive, it could indicate that the early stages of hinging had begun at CFM-5 and were consistent with a mechanism in the square span direction.
3.3 LiDAR results
The original “as-built” geometry of the arch barrel is assumed to be approximately cylindrical, with the axis of this cylinder aligned with the square transverse direction. Additionally, it can be assumed that the axis of this cylinder was intended to lie in a horizontal plane, although a combination of construction processes and differential settlements may ultimately result in this not being the case.
For this reason, it is informative to consider two cases when fitting a “best-fit” cylinder to the point cloud data. The first case assumes that the “best-fit” cylinder will have its axis lying in a horizontal plane, while the second assumes that either the span was not built level or the barrel has rotated as part of its deformation history. These cases correspond respectively to the error maps in Figures 9(a) and 9(b), which plot the difference between the point cloud data and the “best-fit” cylinder for either case.
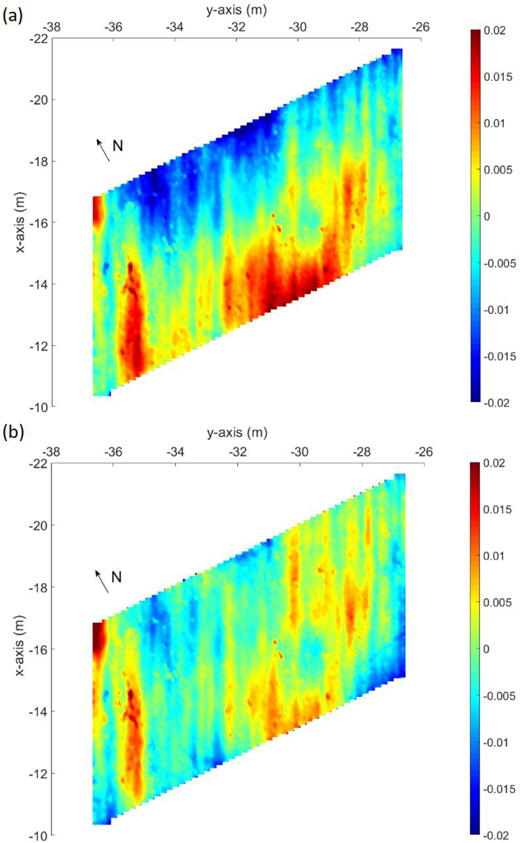
“Best-fit” cylinders for the CFM-5 arch barrel, for (a) a cylinder that is constrained to have its axis in a horizontal plane, and (b) a cylinder with no constraints applied (colour bar values in m: positive values (red) signify upwards movement, negative values (blue) signify downwards movement)
“Best-fit” cylinders for the CFM-5 arch barrel, for (a) a cylinder that is constrained to have its axis in a horizontal plane, and (b) a cylinder with no constraints applied (colour bar values in m: positive values (red) signify upwards movement, negative values (blue) signify downwards movement)
It can be seen in Figure 9(a) that the error map is dominated by rotation of the barrel. In Figure 9(b), after the rotation has been accounted for, deformation bands can be more easily identified and are consistently oriented with the square transverse direction. The axis of the “best-fit” cylinder for Figure 9(b) is inclined by 0.02° from the horizontal, corresponding to a variation in elevation of approximately 23 mm across the width of the bridge.
Next, the analysis of individual slices from the point cloud is considered. As previously mentioned, only slices aligned with the square span direction were found to give sensible results, which were sufficiently consistent between strips. This is in keeping with the error map of Figure 9(b) in which deformation bands are aligned with the transverse of this direction. Five slices were analysed, the locations of which were shown in Figure 6.
3.4 Potential historic deformation mechanisms
The error maps in Figure 10 correspond to viewing the arch from the south and perpendicular with the square span direction. These suggest a partial asymmetric mechanism with movements occurring at the western abutment. Two possibilities exist which could produce error maps of this type. As indicated previously in Table 1, these correspond to either span opening resulting from outwards horizontal movement of the western skewback, or to vertical settlement of this skewback. In practice, the true deformations could also be the result of a combination of both mechanisms.
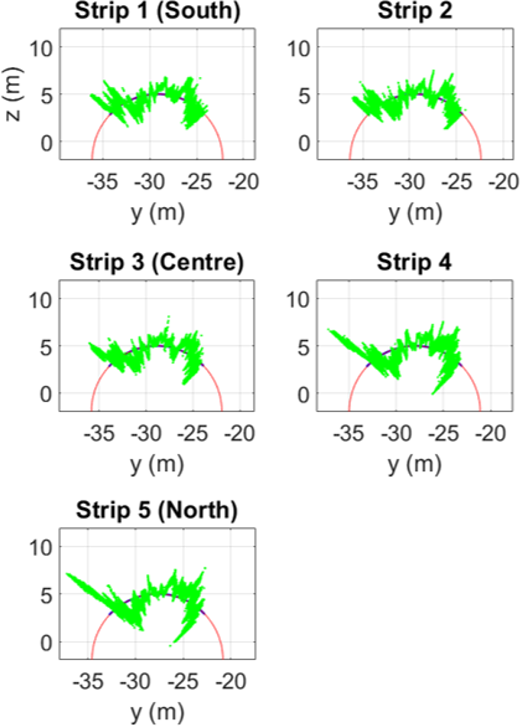
2D error maps of the point cloud slices
It can also be seen from Figure 10 that the error maps show a larger response towards the north of the bridge, indicating larger arch deformations and associated support movements towards the north end. Fitting the two potential mechanisms to Strips 3 and 5 produces Figure 11, in which the first column corresponds to results for arch spreading and the second column to results for differential settlement.
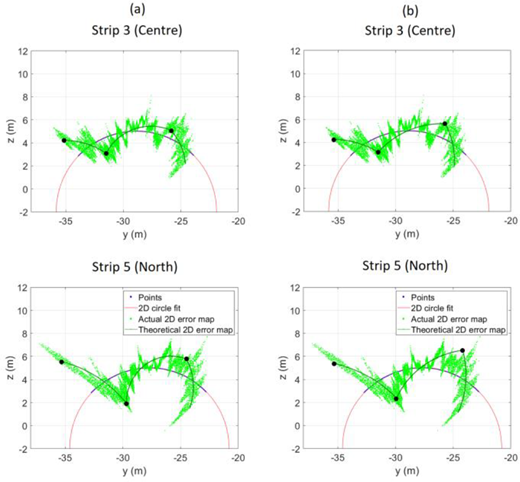
Fitted theoretical mechanisms for (a) arch spreading and (b) relative vertical settlement of the western skewback
Fitted theoretical mechanisms for (a) arch spreading and (b) relative vertical settlement of the western skewback
The likely support movements that give the theoretical error maps in Figure 11 are presented in Table 2. The data indicates that the current geometry of the bridge could be caused by differential movement of the western skewback (between Strips 3 and 5) of either 1 cm, if only horizontal abutment movement occurred, or 3 cm, if only vertical abutment settlements occurred. These predictions assume that each mechanism acts alone and so provide upper limits on the potential differential movements in each direction.
Predicted support movements at the western skewback
| Mechanism | Horizontal movement (arch spreading) | Relative vertical settlement |
|---|---|---|
| Predicted movement at Strip 3 (Centre) | 1 cm | 4 cm |
| Predicted movement at Strip 5 (North) | 2 cm | 7 cm |
While we cannot definitively conclude whether the abutment movement was vertical or horizontal, the potential of horizontal movement to explain the results seems more feasible. The typical assumption that the arch spans square would lead to a larger thrust at the north-west corner of the arch than along the rest of the length of the western skewback. This increased thrust could reasonably have caused a local horizontal movement of the north-western corner, enabling load redistribution of the thrust. This could provide an explanation of the small tensile strains seen currently in the north-western corner of the bridge; such transverse bending would provide an alternative load path if the structure had previously begun to yield in this region.
Lastly, the likely support movements estimated for the mechanism of differential vertical settlement are significantly higher than those predicted for span opening. While the latter could feasibly be realised through the deformation history of the bridge, the former could most likely only be achieved if the as-built geometry already deviated from the assumed reference geometry.
3.5 Comments on the recent intervention work
Analysis of the FBG data suggests that the current mode of response involves the transfer of forces through arching action in the skewed span direction, at odds with the expectation that forces should follow the square span direction of the arch.
One exception to this is the possibility of transverse bending in the north-western corner, which would give rise to the transverse tensile strains seen in this region in Figure 8. This mode of response relies on sufficient connectivity between the arch and spandrels, which is likely to have been significantly improved following the recent intervention work.
Prior to this intervention, both spandrel separation cracks were significant, of the order of several centimetres in width, and were observed to be steadily growing. Damage of this severity would have had a detrimental effect on the capacity for load transfer across the arch-spandrel interfaces. It seems likely, therefore, that the intervention has increased the potential for transverse bending of the arch. Of course, without a baseline measurement prior to the intervention, this cannot be known for certain.
From Figure 8, it can be observed that the principal strains sometimes deviate from the skewed span direction. It is important to remember that the strains measured at bridge CFM-5 are small, of the order of tens of microstrain. The reliability of the principal strain calculation, given that it is an average of the strain state over the 0.25 m2 area of the rosette, is reduced when the measured strains are very small. Therefore, when the magnitudes of principal strains are small, less significance should be attached to the calculated principal strain direction.
Another potential explanation could be that the steel bars which have been used to stitch the spandrel separation cracks, and which were installed through each stone along the spandrel wall as seen in Figure 3, have not all attained the same level of bond with the surrounding masonry, or potentially the bond of some bars may have deteriorated since installation, since cracking continues to occur at the arch-spandrel interface. This could give rise to apparent irregularities in the force flow, particularly close to the northern and southern edges of the arch barrel.
4 Conclusions
In this study, results from bridge CFM-5 have been presented both for FBG monitoring of the current response to train loads and from analysis of LiDAR data to investigate historic deformations. FBG monitoring can measure strains resulting from sub-millimetre movements while LiDAR analysis can predict likely settlements to within approximately 0.5 centimetres. This is because the measured point cloud data, on which these predictions are based, is accurate to within several millimetres.
Post-processing of the FBG data has yielded, for the first time, the directions and magnitudes of principal strains in the arch barrel of a skewed masonry arch bridge. Many of these principal strains were aligned with the skewed span direction, at odds with the expectation that forces should flow in the square span direction. While there may be some influence on behaviour from the construction technique (the brickwork courses are laid helicoidally, following the skewed span direction), this does not change the fact that the square span offers a shorter load path. One possible explanation is that historic settlements at the north-western corner resulted in this region no longer being able to sustain the high thrusts associated with forces flowing in the square span direction.
Meanwhile, analysis of the LiDAR data revealed that differential support movements of the western skewback, which reach a peak at the north-western corner, may have occurred. This is supported by findings from the analysis of arch slices, which indicate a historic deformation mechanism that is aligned with the square span direction. Two potential mechanisms were considered – vertical and horizontal movement of the western skewback – and the likely amount of support movement required for both mechanisms was presented.
Overall, the proposed methodologies provide a new framework for understanding current bridge behaviour and the impact that historic deformation and intervention work can have on the response of masonry structures.
5 Acknowledgements
The work described here is part of a monitoring collaboration with AECOM, with financial support from the asset owners Network Rail. The authors are grateful for the help and support of both organisations. In particular, they express their thanks to David Kite and Daniel Thompson (AECOM), and to Sam De’Ath (Network Rail). This work also forms part of a PhD, which is funded by an EPSRC Doctoral Training Partnership (Grant Number EP/M506485/1). The monitoring has been performed with assistance from the Cambridge Centre for Smart Infrastructure and Construction, and the authors are grateful to Haris Alexakis, Dan Brackenbury, and Jason Shardelow for their assistance with the installation and data acquisition.
