
Chapter 4: In the Scenario of Sustainable Mobility and Pandemic Emergency: Experiences of Bike- and E-Scooter-Sharing Schemes in Budapest, Lisbon, Rome and Vilnius

-
Published:2021
We thank Ph.D. Candidate Jonas Damidavicius, Eimantas Balta, Karolina Tomkeviciute for the helpful material, and suggestions.
4.1 Introduction
Within the collaborative economy, bike sharing and e-scooter sharing are relevant services that have been associated with increases in wellbeing, health (Woodcock et al., 2014) and quality of life, as well as with the creation of (often temporary) employment (De Groen et al., 2017),1 It is therefore important to understand the ways in which these sharing practices transform economic, social and cultural values related to mobility, and how they foster, rather than disrupt, social relationships. The impact of these services on the quality of urban life and on a mobility shift towards sustainability, is the specific focus in this chapter.
The connections between sharing practices and urban systems are multidimensional and inter-influential. Sharing practices have grown considerably in Europe in the 2010’s, particularly in urban areas (cf. also Salvia et al., 2019), and many local authorities have increasingly defined plans to become “sharing cities”:
Sharing cities make use of (often smart) technologies to connect a larger number of users to idling assets, hence to be ‘shared’ by a wider population, rather than being individually owned. Within this trend, assets that are typically shared include vehicles and rides, bedrooms and accommodation, as well as tools and competences (Salvia et al., 2019, p. 1).
This shift from ownership to access concurs to the implementation of mobility as a service, which is the aim of the European Green Deal (European Commission, 2019), voted for by the European Parliament on 15 January 2020. Light sustainable mobility, such as walking, cycling and e-scooter riding, can contribute quite significantly to The Green Deal target of reducing 90% of transport-related greenhouse gas emissions by 2050. Bike and e-scooter sharing can play a major role in this by improving multimodality, particularly in urban areas. Additionally, the digitalization of these services shows great “potential for collection of mobility data”, which can be integrated to municipal or even national level, depending on political will and administrative capacity.2 This connection between bike and e-scooter sharing, on the one hand, and urban planning, on the other, requires that when analysing the evolution of such sharing initiatives, the socioeconomic, cultural and urban contexts in which they are located are taken into consideration, along with the policies and legislative frameworks that regulate, support or limit these forms of transportation.
In this chapter we focus on four countries and their capital cities: Rome (Italy), Lisbon (Portugal), Budapest (Hungary) and Vilnius (Lithuania) to illustrate how shared light sustainable mobility spread in different political, social and economic contexts. The current status of sustainable mobility practices, policies and discourses in these countries is characterized by a series of common trends but also by elements of absolute divergence. The existence of light mobility sharing schemes in these capitals is an indicator of a potential to expand the rates of active mobility. Furthermore, it is also a relevant factor of digitalization and commodification of mobility as a service, in line with the European Green Deal, hence it concurs to simplify transportation systems and urban logistics, to free public space, while reducing environmental, social and economic costs. With an increased rate of 45% per year, bike sharing has been the fastest growing mode of urban transportation since 2007 (Lopes, 2015). It is therefore interesting to discover the specificities that characterize the landscape and the policy framework of the analysed countries and capital cities, what limits are found in the use of bicycles and/or electric scooters (e-scooters) sharing schemes, and where to leverage to favour the transition towards more sustainable modes of transport.
The primary goal of the comparative research we propose, is to identify similarities and differences between these countries and cities, in order to understand how shared light sustainable mobility is developed in European capital cities of different characteristics and opportunities. For this purpose the analysis compares and contrasts cultural, societal, institutional and political traits related to light mobility, with a specific focus on the bike sharing and e-scooter initiatives, in order to understand and identify various evolution patterns as well as key institutional actors and measures. The following section defines sharing mobility and describes the reality of bike and e-scooter sharing in the four cities; Section 4.3 sheds light on the broader mobility cultural contexts and institutional actors; in Section 4.4 we analyse national policy frameworks; in Section 4.5 we discuss the impact of the pandemic, before presenting some final remarks.
4.2 Bike and E-Scooter Sharing: A Four-City Comparison
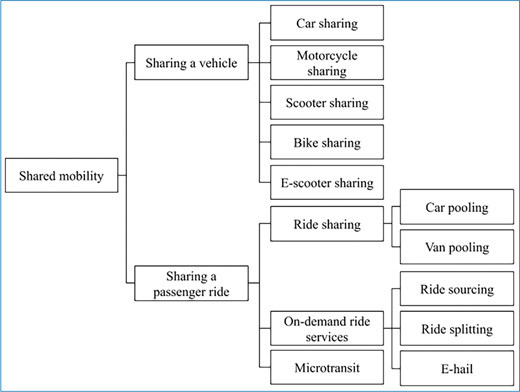
Shared mobility represents a subset of the larger sharing and collaborative economy. Building on the elaborations of other authors (Jin et al., 20183; Shaheen and Chan, 20164), bike and e-scooter-sharing systems are a particular form of shared mobility in which what is facilitated is “the sharing of a vehicle”. Figure 4.1 offers a classification of shared mobility options existing at the time of publishing. Although this chapter is focusing only on bike- and e-scooter-sharing services, the figure illustrates the wide range of possible shared mobility modes that, to some extent, might be rivals to attract their target population and might overlap among the various sharing modes.
The first bike-sharing projects were initiated by various local communities and organizations in the Netherlands, and the earliest well-known community bicycle programme was started in 1965 in Amsterdam. Since then, the growth of bike sharing has been exceptional worldwide, and together with the recent explosion of e-scooter-sharing is changing how urban travellers access transportation, and how cities are planned and built (Cohen and Shaheen, 20165). In fact, the wide range of sharing schemes, represents innovative transportation means that enable users to gain short-term access to transportation modes on an as-needed basis for either passenger trips or goods delivery.
Categories of shared mobility.
Parallel to their success, controversies about light mobility sharing schemes potential impacts and externalities have arisen. There have been a number of studies discussing the social, economic, and environmental impact of the broader “sharing economy” (e.g.; Frenken and Schor, 2017; Martin, 2016; Schor, 2016). Nevertheless the specific area of light mobility still represents a niche of this growing body of research, particularly for e-scooter sharing schemes. It is worth mentioning that given the novelty of this phenomenon, there is far less knowledge built about it in comparison with bike-sharing. As for the latter, potential economic effects (Otero et al., 2018; Qiu and He, 2018; Ricci, 2015), principal externalities on the environment (Qiu and He, 2018; Shaheen et al., 2010; Zhang and Mi, 2018), people’s health (Otero et al., 2018; Qiu and He, 2018), urban efficiency (Ricci, 2015) and traffic congestion reduction (Fan and Zheng, 2020; Fiedler et al., 2017; Fishman et al., 2015) – also during the COVID-19 pandemic (Teixeira and Lopes, 2020) – have been documented. However, their social impacts (e.g. equity and inclusivity), have been largely overlooked and the debate is still open (Qiu and He, 2018; Ricci, 2015; Teixeira et al., 2020).
If on the one hand, as resulted from a wide study on major bike sharing schemes in Europe, these “provide health and economic benefits” and their promotion “can significantly increase the health benefits”, and “can be used as a tool for health promotion and prevention” (Otero et al., 2018, p. 7), on the other hand, bike sharing benefits “are unequally distributed, since users are typically male, younger and in more advantaged socio-economic positions than average” (Ricci, 2015; p. 1). Moreover, even when in the process of planning bike-sharing systems the “spatial equity” was considered as a key factor for fostering social inclusiveness, “maximising accessibility or coverage alone, without considering equality”, still produced discrimination between different groups (Caggiani et al., 2020, p. 1; see also6).
4.2.1 Bike Sharing Services
Bike-sharing systems (BSS) represent not only a sustainable mobility tool but also a means of urban intermodal transport (Caggiani et al., 2020). According to their evolution over time, these systems can be grouped into five categories, or generations:
Staffed stations (zero-generation system): bicycles can be rented or borrowed from a location and returned to that location.
White bikes (first-generation system): bikes are made available for free and are simply released into a city or given area for use by anyone.
Coin deposit stations (second-generation system): the bicycle can be borrowed free of charge and for an unlimited time. A coin deposit is needed but the coin can be retrieved by returning the bicycle to a station.
Automated stations (third-generation system): bicycles can be borrowed or rented from an automated station or “docking stations”. These are bike racks that lock the bike, and only release it by computer control. The bike can be returned at any station belonging to the same system.
Dockless bikes (fourth-generation system): free floating bikes are available on demand using mobile phone apps and GPS technologies.
Population size, density and city areas in 2020.
Number of bike sharing providers and bicycles in the four cities.
| Bikesharing Provider Type/Platforms | Budapest | No. of Bikes | Lisbon | No. of Bikes | Rome | No. of Bikes | Vilnius | No. of Bikes |
|---|---|---|---|---|---|---|---|---|
| Local service | 1 | 2,071 | 1 | 1,000 | NA | NA | NA | NA |
| Global private company | 1 | 200−300 | 2 | 1150 | 1 | 3,300 | 19 | 300 |
According to recent data, bike-sharing services are offered in several areas, mostly in the biggest cities or specific areas of the four capitals, given their cultural traits or functional uses (recreation, tourism). Table 4.1 displays the area, population size and density of each city, to serve as reference for the comparison of bike and e-scooter sharing distribution. At the time of writing, while in Budapest, Lisbon and Vilnius, BSS providers are using automated stations (third-generation system), in Rome only free floating bikes (fourth-generation BSS) are available. In Vilnius and Budapest only mechanical bicycles are available, while in Lisbon both mechanical and electric bicycles are offered, and in Rome, only electric.
As shown in Table 4.2, Budapest and Lisbon count on both local public and private multinational bike sharing providers, while Vilnius has only schemes managed by global private initiative, and at the time of writing, Rome entirely relies on a private multinational operator. This difference is probably related with Budapest and Lisbon municipalities’ strong pro-bike policies, given that public bike sharing services (BSS) provide governmental administrations with direct influence on how BSSs are promoted and managed. In particular, the Portuguese BSS run by the municipal company has received the capital investment of $16 million by the City of Lisbon (Christensen, 2019) and some of these city shared bicycles are assigned to the Municipal Police of Lisbon. The main Budapest bike sharing company is also run by the municipality of Budapest, incorporated into the Budapest public transportation company (BKK), supported by the largest Hungarian company, which is the leading integrated Central & East European oil and gas corporation and which is partly owned by the Hungarian State.
The number of bicycles available seems insufficient in all cities, more importantly in Budapest and Rome, given the larger size of their populations; however, the higher population density of Lisbon makes it crucial to increase the forms of shared light mobility, in order to free public space from traffic and parked vehicles. In Italy, between 2015 and 2019 the available fleet is more than tripled and (as reported by the Italian Observatory of Sharing Mobility according to a sample study of about 31 cities in Italy) 5,413 electric bikes were available for sharing in 2019. Nevertheless, Rome is the largest of the four cities, with the second lowest population density, and not all areas of the city are served by the sharing services.10
With reference to the infrastructure needed at the city level to promote the BSS,Budapest is showing growing networks of dedicated paths and fleets of shared bicycles.
Despite their blooming, these systems are still lacking in terms of accessibility and equity; issues that could probably be addressed by a reinforced public-private dialogue and reinforcing people’s participation in the co-design process behind these services. In terms of accessibility, a common feature of the four analysed cities (which also resemble the situation which characterizes most major urban areas in Europe and in the US), is the uneven geographical distribution of the services between “centre” and “periphery”. These services are in fact offered predominantly in the most touristic areas and/or wealthier neighbourhoods and are completely absent in peripheral and/or less-connected areas. In terms of social inclusion and equity, docks, stations and free floating bikes are rarely placed in low-income areas, and when this happens, they do not fit within the overall urban transport system. Payment systems do not consider free memberships or special discounts for low-income or disadvantaged categories, etc. Moreover, by relying on smartphones and digital platforms (from registration, to access and service payment), digital divide, access to the Internet, smart-phones and credit cards determine an unequal distribution of accessibility among the population and represent some key factors that limit the use of BSS to the elderly, low-income and minority populations.
Table 4.3 presents a comparison of bike-sharing services regarding pricing, ticket modalities, discounts and penalties, published in the fall-winter period of 2020. It is highlighted that only one company, in Vilnius, gave a discount to a specific population group: young people between the ages of 14 and 26. This provider has over 6,000 long-term subscribers – mostly aged from 25 to 34 who use services as a connection in the city area (JCDecaux, 2020). With the exception of Rome, all cities have long term ticket options for bike-sharing, although in Lisbon only the local public service is providing that option, as a brief experience of a monthly pass by a private operator was recently interrupted, despite its high demand.11 The specific modalities of long term ticket vary, along with the way it is marketed. For instance, in Vilnius, the two providers12 define long term purchase as membership. Favouring this type of costumer-provider relationship, for each trip, the first 30 minutes are free for users with memberships. Similar privileges are also given by the public service in Lisbon and the private one in Budapest, to holders of long-term tickets. Finally, three of the providers offer a daily ticket, in Rome, Lisbon and Budapest.
Price scheme comparison of bike-sharing services in the four European cities.
| Rome | Lisbon | Budapest | Vilnius | |||||
|---|---|---|---|---|---|---|---|---|
| Service ownership | Private | Public | Private | Private | Public | Private | Private | Private |
| Bicycle type | Electric | Both | Electric | Electric | Mechanical | Mechanical | Mechanical | Mechanical |
| Long-term tickets | none | 25 €/ year for rides up to 45 min.; 15 €7 month for rides up to 45 min. | 0.3 €/ month for rides up to 30 mins | 14 €/ month OR 8,4 €/ month | 19,90 €7 season | 2.90 €73 days; 3.90 €/30 days; 19,90 €7 season | ||
| Daily tickets | 13,99 € | 2€ | 11,6€ | N/A | N/A | |||
| Price per minute/extra time | 0,20 € min + 1 € to unlock the bike | from 45-90 min.:1 € more than 90 min.: 2 €/additional 45 min. | 0,20 €/min | 0,20 €/min | after 30 mins: 1.4 Euro/30 mins up to 3 hours, from 3 hours 3,6 €/30 mins | 1,4 € up to 15 mins, 2 € for 15−30 mins, 2,9 € for 30−60 mins; 5,7 € for 1 h or more | trips from 30 to 1 h: 0.39 €; trips longer than 1 h: 0.50 €/ additional 30 min; Long-term users extra km: 0.39 €/ 30 min. | 30 min/0.50 € |
| Penalties | If parked in restricted area: 20 € | If the bicycle disappears or is irreparably damaged: 159 € | ||||||
| Discounts | First 45 min. free with yearly and monthly ticket; all trips up to 45 min. free with daily ticket | The current price is discounted, since March 2020 due to the pandemic | 14 € per month – 12 hour free with every rental OR 8,4 € per month – 1 hour free with every rental | First 30 min free with membership; Special discount for seasonal ticket: 13.90 e for young people; 3 day ticket available | ||||
The information regarding price per minute or extra time shows that four of the eight providers, distributed in these four cities, apply charges to longer trips, possibly promoting the use of bike-sharing as last mile option. However, combined with the evidence that these services are mostly available in the city centres, such practice underlines the limited socio-geographical inclusion of bike-sharing. Once the legal contracts implied in these purchases were not analysed, we assume there must be more situations where penalties can be charged than what the data collected can indicate. However, two of the providers display more concern for making users clearly understand they are responsible for damages to the bicycles, or to their adequate parking.
4.2.2 E-Scooter Sharing Services
Recently, micro mobility and in particular e-scooters, have become very popular across all Europe,13 as bike lanes, common use zones and wider pavements14 can also be used for this means of transportation. It was only in 2018 that the first European e-scooter sharing scheme appeared, in Lisbon,15 where this type of modality has been increasingly promoted ever since by several companies.16 In Vilnius, e-scooter services were opened in the Spring of 2019,17 as well as in Hungary, in the centre of the capital city. In Budapest the infrastructure is also adequate, with an extensive network of bike lanes and paths, while the target group is not only the 1,7 million inhabitants but thousands of tourists, too, but the number of scooters is low, around 300. Between July 2019 and January 2020, e-scooter users of one of the schemes available in Budapest have travelled a total of 1.3 million kilometres.18
Number of e-scooter sharing providers and e-scooters in Budapest, Lisbon, Rome and Vilnius in Winter 2020–2021.
| E-scooter Sharing | Budapest | Lisbon | Rome | Vilnius | ||||
|---|---|---|---|---|---|---|---|---|
| Local Service | Global Private Company | Local Service | Global Private Company | Local Service | Global Private Company | Local Service | Global Private Company | |
| No. of services/companies | NA | 2 | NA | 4 | NA | 6 | 0 | 2 |
| No. of e-scooters | NA | 330 | NA | 12.000 | NA | 8,000 | 0 | 1,100 |
Rome is following this trend only since Spring 2020, during the pandemic. As recently stated by the mayor, e-scooters represent a small revolution for the city in terms of sustainable mobility.19
The widest offer of e-scooter sharing service providers located in Rome and Lisbon; a smaller number of e-scooter sharing operators is active in Budapest and Vilnius (see Table 4.4). These numbers refer to the reality between December 2020 and January 2021. As companies and users try to adapt to the evolution of the pandemic restrictions, the demand and offer of e-scooters-sharing has changed very rapidly. For instance, before March 2020, both Rome and Lisbon had local startups providing e-scooter-sharing; at the outset of the pandemic, these services were interrupted. Therefore, data reported in Table 4.4 and following description just provide an overview at a particular moment in time.
Comparing this distribution with geographical and demographical aspects (Table 4.1), Budapest has the most inadequate number of e-scooters available considering the size of its population, while Lisbon is the city with the widest offer. However the poor regulation and control regarding the parking of these vehicles, combined with the lack of responsibility demonstrated by some users, led to tensions in the public space, with no clear evidence so far if these services contributed to free public space, particularly from cars.
In Table 4.5, we can see that the prices for using shared e-scooters on a “pay as you go” regime are very similar between these four capitals, with an expected while Vilnius and Budapest have the lowest prices of the analyzed capital cities. However, these differences are not that significant, considering that the minimum wage in Portugal and Lithuania are similar, while in Rome this is about 200 euros higher, and in Hungary 200 euros lower than in Portugal. Rome and Budapest are the only cities where long term tickets are available. Most companies do not apply penalties, nor discounts for specific population groups, with only one service in Lisbon promoting inter-modality more actively by attributing a discount to holders of the city intermodal public transportation card “Viva”. The penalties active in Lisbon and Vilnius are similar to those applied in the bike-sharing services.
Overall, following the same trend reported above for BSS, e-scooter sharing schemes are mostly used in the historical centres of the European cities, and this uneven distribution of the services – together with the unequal distribution of accessibility among the population due, for example, to the costs and technologies required to use these services – is producing discrimination between different geographical areas and social groups (Caggiani et al., 2020).
Official statistical information about these light shared mobility services is scarce, given the lack of regulation and even recognition of these forms of transportation by the national legislations. Their expansion must be perceived in the broader cultural mobility context of these countries and cities, which is exposed in Section 4.3. The continuity of these initiatives depends extensively on the implementation of sustainable mobility frameworks, with particular focus on active and micro mobility, which we discuss in Section 4.4.
4.3 How Far Must We Come From?
Overall, the four European capital cities show a general positive attitude towards light and sustainable urban mobility. However, this growing interest in sustainable micro-mobility shown by national and local governments, mostly in bicycles and e-scooters,20 including sharing schemes, must overcome the cultural car dominance, solidified since the mid-XX century. Italy, Portugal, Hungary and Lithuania face a number of challenges to various extents, due to a combination of a less developed cycling culture that is hindered by the scarcity of a proper infrastructure, exacerbated by the influence of decades of car-oriented policies.
Price scheme comparison of e-scooter-sharing services in Rome, Lisbon, Budapest and Vilnius.
| Rome | Lisbon | Budapest | Vilnius | ||||||||||
|---|---|---|---|---|---|---|---|---|---|---|---|---|---|
| Long term tickets | 13,99 € for 24 hours | 29,99 € per month (up to 20 trips per day, each trip up to 30 minutes) | 10% discount for packages of trips bought in advance | 6,99 € Daily pass, unlimited unlocks | Monthly pass: 5.5€ for unlocking; Daily pass: 13.9€^* | ||||||||
| Pay as you go | 0.25 €/min. + 1 € to unlock | 0.20€/min. + 1 € to unlock | 0.25€/min. + 1 € to unlock | 0.19€/min. + 1 € to unlock | 0.25 €/min. + 1 € to unlock | 0.19€/min. + 1 € to unlock | 0.15€/min. + 1 € to unlock | 0.15€/min. + 1 € to unlock | 0.15€/min. + 0.5 € to unlock | 0.20/min + 1 € | 0.14€/min. +0.7 € to unlock | 0.10€/min. +0.50 € to unlock | 0.15€/min. +0.60 € to unlock |
| Penalties/Discounts | 20 min free for users of Lisbon intermodal card | 30 € for leaving scooter outside the dedicated area | 100 € for leaving scooter outside the dedicated area | ||||||||||
Comparison of motorization and road safety indicators.
| Indicators/year | Italy | Portugal | Hungary | Lithuania |
|---|---|---|---|---|
| Passenger car ownership/1,000 inhabitants (2018) | 646 | 514 | 373 | 512 |
| Hours spent in traffic/year (2017) | 37,7 | 29 | 26,4 | 21,5 |
| Road fatalities/million inhabitants (2017) | 56 | 58 | 64 | 67 |
| Number of cyclist fatalities/million inhabitants (2016) | 275 | 73 | 33 | 22 |
Table 4.6 displays evidence of what limits the spread of sustainable light mobility: the high dependency on the use of the car; the time spent in road congestion; road fatalities and cyclist fatalities. Despite the developments in urban cycling and the recent (and still unquantifiable) boom in e-scooter usage, in general, passenger cars remain the dominant mode of transport by far. Peculiarly, in our limited sample, Italy and Hungary are positioned respectively at the two extremes of the European statistics of car ownership (Table 4.6). Among the EU-27 Member States, in fact, Luxembourg (with 676 passenger cars/1,000 inhabitants in 2018) is the country with the highest motorization rates, followed by Italy (646), while Romania (332) and Hungary (with 373, just over one car per five inhabitants) show the lowest rates. Regarding the time spent in road congestion, Italy has the third highest in EU-27, while the lowest was registered in Sweden.
It is probably road safety figures that most indicate the need for urgent change. In this scope, although road fatalities have decreased21 in the four countries, in 2017 their numbers were still above the EU-27 average (49 per million inhabitants). The number of cyclist fatalities by country however, shows different trends in the countries under investigation (while information about e-scooter fatalities is still not available). Considering the period 2007–2016, Italy (352 people were killed per million inhabitants in 2007 versus 275 in 2016) and Hungary (158 to 73) demonstrate a substantial decrease in fatalities, Portugal remain almost stable (34 to 33), while Lithuania (for which data are not available for all years) shows a relative increase passing from 18 fatalities in 2013 to 22 in 2015.22
All these factors contributed to urban safety and sustainability becoming a primary objective, and more action is being taken at different government levels to implement measures that facilitate greater awareness and changes in mobility practices. This may be indicated either by the development of urban bike and e-scooter sharing systems, or by the development of the infrastructure.
4.3.1 Cycling as Part of a Sustainable Mobility Culture
The use of the e-scooter is a new phenomenon and there are (still) no associations or social movements that primarily promote this new means of transportation, the voice of stakeholders in the field of cycling is more consolidated. Regarding the particular role of urban cycling, the three major European cycling associations (European Cyclists’ Federation – ECF, Cycling Industries Europe – CIE, and Confederation of the European Bicycle Industry – CONEBI) who participated in the public consultation on the roadmap for the European Strategy for Sustainable and Smart Mobility, jointly agreed that investments in policy framework for the promotion of cycling and infrastructure are crucial to success, and must play a pivotal role in achieving the ambitious objectives set by the EU Green Deal. On May 6th 2020, these organizations together with other three cycling industry, logistics and users associations sent a letter to the European Commission, advising on measures to promote cycling, simultaneously as a response to the urgency of the multidimensional crisis that the COVID-19 pandemic has triggered and a means to accelerate the path to accomplishing the goals of the European Green Deal (CIE, ECF, CONEBI, ECLF, EBMA, IMBA-Europe, 2020). At the time of writing, mid-pandemic, this is a more timely issue than ever before, so it is important to understand how and if the share of urban cycling and e-scooter usage is improving.
Bike-sharing practices, with a strong influence in promoting urban cycling (Teixeira et al., 2020) are getting to be the cornerstone of sustainable urban mobility across Europe: “recent cycling innovations are transforming the cityscape and contributing to the broader acceptance of cycling in society. Bicycle sharing schemes offer a valid alternative cycling mobility in urban areas and can be combined with public transport for longer distances” (EPRS, 2014, p. 4). While bike and e-scooters’ sharing schemes are gaining ground in many cities around Europe due to the private initiative of sharing economy organizations, political decisions on issues around sustainable transport and mobility are still lagging behind in some EU states.
Cycling is by far the least utilized means of transport in the four capital cities considered, which presented low modal shares: Rome and Lisbon show only 1% cycling23 in 2020, Vilnius 1.5% in 2018,24 while Budapest showed 2% in 2010 and 4% in 2020 (Bucsky, 2020). Cities where the cycling modal share is below 10% and with limited expertise on developing strategies to include cyclists as road users in their urban planning and to consider bicycles as transportations in their intermodal network are considered beginner cities (BYPAD, 2008). According to available data, the four capitals analysed can be considered as beginners. However, particularly in the case of Budapest, the modal share seems to have increased considerably, as a recent study25 revealed that 16% was the national modal share, while 71% of adults “are used to cycling – especially in Budapest” and the pandemic has increased this tendency. The other three capitals are possibly on the first step to an evolution towards including cycling within their regular mobility choices.
The improvement of policies on cycling promotion are a necessary stepping stone to further boost this evolution, and the provision of BSS is a very relevant point, proved in previous research to be a motivator for people who were not used to cycling to consider changing their modal choice (Felix, 2019; Pucher and Buehler, 2008, 2012). According to Felix (2019, p. 15), between 2000 and 2018, Lisbon’s path to active cycling mobility has been uphill. The Lisbon Municipality has been leading a political shift regarding sustainable mobility, not only with investment in cycling infrastructure but also with the promotion of sharing mobility, including bike and e-scooter sharing services, and with several campaigns to promote active mobility, within school communities by creating school mobility plans. The current cycling patterns are embedded into different contexts in the four countries.
4.3.2 The Voice of Stakeholders and Social Movements
As well as their counterparts at the European level, social movements and their particular actors in the four analysed countries had and continue to have a major role in this cultural shift to sustainable mobility.
In Italy, cycling activists are increasingly demanding for an improvement to the country’s road infrastructure in order to prevent a rise in casualty figures. In the major cities, environmental campaigns to boost bicycle usage take place every year, and the first Critical Mass26 in Rome took place in 2002. From then on, associations such as the “Salvaiciclisti” (Save the Cyclists) organize regular cycling protests27 in
order to warn the government about the high number of cyclist fatalities, while demanding shared space on the roads and a “highway code” that caters for all road users, and not just car drivers. The city counts on a number of important cyclist non-profit organizations, including the Federazione Italiana Ambiente e Bicicletta – FIAB (Italian Federation for the Environment and Bicycle) or grassroots initiatives like Ciclofficine Popolari (which stands for Community Bike Workshops) and Associazione Ciclonauti, which make an important contribution by mobilizing people participation and organizing advocacy activities and political pressure.
As well as in other Portuguese cities, Critical Mass events28 began to be held in Lisbon around 2003. Since this movement started “there was a growing trend in the Lisbon cycling community”, which has diminished since 2012. In the same period, “the formal bicycle (…) organizations also increased their memberships, and played an important role in advocating for cycling infrastructure, cyclists’ rights in the road code legislation, educational programs, and other bicycle promotion initiatives” (Felix, 2019, p. 5429). The Federação Portuguesa de Cicloturismo e Utilizadores de Bicicleta (FPCUB),30 Associação pela Mobilidade Urbana em Bicicleta (MUBi)31 and Federação Portuguesa de Ciclismo (FPC)32 are the three strongest national organizations (Felix, 2019). The founding cores of these initiatives are located in Lisbon, which concurs to this city’s highlight, within the country, in cycling promotion movements and general civic activities related with mobility. Probably as a consequence of the municipality’s efforts and the presence of the cycling movement, the cycling modal share has increased from “0.2% in 2011 (INE, 2011)”, “far below the EU average of 8% (European Commission, 2014)”, to an estimated rate “of 0.6% of daily trips made by bicycle” in 2017, according to the INE (National Statistics Institute) (Felix, 2019, p. 52).
In Hungary, civilian actors actively contributed to the development of urban cycling during the past decade with consulting or elaborating a National Cycling Concept for 2014–2020, or organizing various programmes to promote urban cycling. The largest bike promotion civilian actor is the Hungarian Cyclists’ Club (Magyar Kerékpáros Klub – HCC) which influences cycling policies and the implementation of new, mainly infrastructural developments in strategic and professional partnerships with cities and companies all over Hungary, but mainly in Budapest. Besides its ongoing promotional campaigns (Bike to work, Bike to school etc.), it also organized the Critical Mass in Hungary from 2004, but the initiative ended in 2013 as, according to the HCC, the critical mass of urban bikers has realized and thus the movement has achieved its goals.
In Lithuania, social movements related to fighting for the protection of rights of pedestrians and cyclists are growing in membership numbers and activists are using social media to voice their concerns and anger at city planning that ignores their needs at the expense of motor vehicle road users (EU Country Profile, 2016, p. 5).
If, on the one hand, the structure of the Lithuanian government incorporates neighbourhood governance through local ‘elderships’ (Seniunijos), enabling local community-based organizations to raise their issues and act directly for the promotion of a wide range of social, economic, political and environmental improvements and rights, on the other hand their participation to the development and implementation of the 2015 Sustainable Urban Mobility Plan (SUMP) is still weak.
While cultural patterns, major stakeholders and the field’s dynamics are fundamental muscle, the sustainable mobility policy frameworks are a backbone to the shape of bike- and e-scooter-sharing services.
4.4 Policy Framework and Legislation on Sustainable Mobility
Sustainable mobility is a pressing issue, framed under European Union policies, such as the imminent Strategy for Sustainable and Smart Mobility announced in the European Green Deal (European Commission, 2020), therefore it is not surprising that it is present in the legislation of the member states under analysis. Cycling is a significant axis of sustainable mobility, included in “the European agenda for sustainable urban and regional mobility” in line with the desired shift to “sustainable consumer choices and zero and low emission practices” (European Commission, 2020; p. 3). Bike and scooter sharing, in particular, concur to the European Green Deal’s goal of creating smart solutions of “mobility as a service” (European Commission, 2019, p. 1). Therefore in order to understand these sharing economy practices, we need to consider the mobility policies and legislation in which they are framed. Despite their common framework, in the four countries, the use of scooters and e-scooters is almost invisible in the policy reports, less regulated than cycling, and existing regulations are less known and enforced.33 Specifically the organization and control of the parking of these vehicles has been poor, causing several conflicts.
Sustainable mobility was already considered in the late 90’s in Italy, while in Hungary, Lithuania and Portugal it only began to be taken more seriously in the 2000’s. The national frameworks vary given this historical discrepancy that implies a deeper level of institutionalization of the matter in the Italian political and administrative system. The Ministerial Decree of 27 March 199834 represents the main regulatory instrument in favour of sustainable mobility in Italy, while in Portugal the National Active Cycling Mobility (ENMAC 2020–203035), was approved by decree only on August 2nd 2019. In Hungary, the central piece of legislation on sustainable mobility is embedded into tourism strategies: the Active Hungary programme (2019) and The National Tourism Development Strategy 203036 (2017), both focusing on a wide variety of tourism development measures, and the improvement of bicycle use (either as mobility or a leisure activity), mainly by the development of rural bike lanes.
In Italy these interventions concerned, among others, the introduction – at the national level – of eco-incentives, with the aim of supporting the use of low environmental impact vehicles and to discourage the use of the most polluting means of transportation, as well as at local level, financing sustainable mobility projects. In the latter case, measures to limit car use in certain areas (“blue lines” parking lots, Limited Traffic Zones (ZTL), eco-pass, pedestrian areas), on the one hand, and, on the other, sustainable mobility tools have been promoted through the creation of cycle paths, safe home-school “foot-bus” routes, preferential lanes, as well as through the enhancement of public transport and the implementation of mobility management, ride-sharing, bike-sharing and more recently scooter-sharing.
In this regard the situation in Portugal is different. Although the Active Mobility Strategy was published in 2019, during 2020 it was not scheduled nor initiated, which has mobilized cycling promotion associations and the Parliament in a recommendation. Only between April and May 2021, regional online sessions were organized for municipalities and other stakeholders to discuss cycling promotion initiatives.37 Nevertheless, at municipal and intermunicipal levels, a cycling infrastructure has been included in Municipal Master Plans, some deactivated railways have been restored as cycling roads, and paths within natural landscapes have been renewed, complementing the recent efforts of several cities that promote sustainable mobility by introducing car-free days in certain areas, areas of 30 km speed limit and the opening of bike- and scooter-sharing services.
Lithuania’s political support on issues around sustainable mobility is considered as leading among European countries, as structural funds are used in a way that helps to support a consistent national approach to EU Sustainable Mobility Plans (SUMP) (Eltis, 2019). The capital Vilnius, and a number of minor locations introduced restrictions to entering the city with large vehicles and bans on coaches without proper emissions certification, and endorsed innovative public transport vehicles to meet EU emission targets in urban centres, by promoting and subsidising the adoption of low emission modes of transportation such as electric vehicles (EVs) and bike-sharing systems. Indeed, Vilnius has set the goal to increase the cycling modal share up to 7.5% (Judu, 2020).
In Hungary the landscape of sustainable mobility is ambiguous. During the past decade urban cycling, including bike sharing schemes and more recently e-scooters, gained popularity predominantly in Budapest. Even though urban micro mobility became the topic of heated political debates in the past years, a number of strategies, policies and practices have been introduced by various political actors, both at national and city level. At national level, the commissioner for cycling and active recreation is developing mainly rural bike paths, while subsidising e-bikes to enhance sustainable mobility. In Budapest, a new green pro-biking mayor and administration have been elected in 2019, that have further boosted the infrastructural developments by opening more bike lanes and adopting pro-cycling policies. These core policies have been further enhanced by the prolonged pandemic. The growing demand for sustainable mobility generated public and political debates, as it was seen as “a threat” for the traditionally car-dominated urban mobility regime. Nevertheless, cycling is a traditional means of transportation in rural Hungary, particularly in smaller settlements and in appropriate (mostly flat) topographical conditions, but urban cycling, especially in the past decades in Budapest, is on the rise.
The considered countries have all made major, albeit often initial steps forward in the promotion of sustainable mobility, both at national and city level in the past decade, and thus arrived at the pandemic in 2020 with already existing strategic frameworks, which could be further improved to address the challenges of interpersonal distancing and mobility safety in pandemic times. The promotion of bicycle and scooter use as part of micro-mobility is a relevant part of all the strategy plans, and often combines infrastructural (the improvement of cycling networks) and fiscal (subsidies for e-bicycles) measures. It is relevant to notice that such fiscal benefits are given to promote ownership and not the sharing of light sustainable vehicles, which displays the legislators disregard for sharing mobility as a service. At national level, fiscal incentives were highlighted more in Italy since years, while they were missing from the policy instruments in Hungary up until September 2020, when the subsidy for e-bicycle purchase was triggered by the pandemic in order to enhance cycling. On the contrary, Italy initially placed less emphasis on developing bicycle infrastructure, while Hungary focused mostly on the improvement of bike lanes, mainly in rural areas. Portugal seems to have applied the most comprehensive approach by covering both fiscal and infrastructural aspects with various measures, although the latter aspect has been less expanded at national level.
There are also some peculiarities in the governmental scale of the conception, public consultation and execution of such regulations, given these countries’ diverse administrative structure. In Italy, the main sustainable mobility interventions are implemented at the local level, with the possibility at state and regional level to draw a picture of reference, in which to design the legislation of local authorities. In Portugal, although the implementation of measures and the specific regulations, such as plans for bicycle networks, is an attribute of the local authorities, the general legislation is defined by the central government, not often with representative participation of all municipalities in its discussion and definition of coordination mechanisms. As an added complication, the larger cities of Lisbon and Porto as well as Italian cities are framed within metropolitan areas that have their own jurisdiction, although they have no power over the decisions of elected municipal assemblies. Hungary also applies a mixed approach, but in a different way: cities are usually limited to improving local cycling networks and introducing bike-sharing schemes, but have less influence on the surrounding developments (except for the capital city), while state level agencies are in charge of improving bike lanes among settlements, and thus municipalities are conditioned by state bodies in the development of the sustainable mobility modes outside the municipality. These differences also have impact on the decision-making regarding the activation of European policies, such as the SUMP, which in Portugal were assumed on national scale but, so far, the decision to implement and regulate them was left to the municipalities, while in Lithuania these were mandated at national scale.38
Despite the general positive attitude, in these four countries, we found more production of general plans or wide strategies that define high goals and significant interventions, at the national scale, than effective legislation that implements, regulates and schedules such changes. This tendency is stronger in Hungary, Lithuania and Portugal, where the more concrete measures that the legislation has defined were fiscal benefits to purchasing bicycles and other sustainable vehicles and the promotion of the construction of cycling networks. The latter are, as mentioned above, under the arm of local authorities within the borders of the municipality and there is limited information on what kind of support is given by the central government. In contrast, in Italy, the central government established, in the Law of 19 October 1998, n. 366 “Rules for the financing of cycling mobility”, a structural funding for interventions by local authorities and associations of municipalities, both of infrastructural type and aimed at spreading the culture of cycling as an alternative to motorized means of transportation. This way, local authorities have contributed to the construction of the regional cycle network, as part of the Territorial Provincial Coordination Plans (P.T.C.P.) and General Urban Plans (P.U.G.).39
More recently, various laws on sustainable mobility were adopted and special funding has been dedicated to the 2016, 2017 and 2018 budget laws. Specific attention was paid to cycling, through the allocation of resources to the national system of tourist cycling routes, and with the approval of law no. 2/2018 which promoted the use of the bicycle as a means of transportation. The Italian government is showing readiness for progress.
4.5 Impacts of the Pandemic: Favouring or Discouraging Bike/E-Scooter Sharing?
Just as it has affected all societal dimensions, the pandemic has had a wide impact in transportation systems and mobility patterns, highlighting the need for connectivity, intermodality and public-private partnerships,40 for which bike and escooter sharing can be pivotal. In Europe, six cycling organizations have prompted the EU Commission to acknowledge that the new COVID-lanes” combined with support for e-bikes can relieve pressures on public transport and stimulate green growth in line with the EU Green Deal”.41 Scientists of several fields also called on governments to promote conditions for safe walking and cycling in order to promote public health.42 As the ECF (2020) points out, the experience of “new” traffic-free “soundscapes” during the lockdown periods has presented us “a great opportunity to make people aware of the real impact of noise on our lives”,43 in
addition to all the other factors, mentioned above, that have proved the need for a change. Indeed, one of the positive outcomes of the pandemic is the resurgence of cycling (ECF, 2020).44 In fact, the lockdown motivated cycling as it facilitates social distancing and contributes to maintaining health. This increased interest in cycling and forms of locomotion that allow interpersonal distancing can concur with a higher demand for bike and e-scooter sharing services.
So, let us examine the cycling patterns and the policy interventions in the four cases, considering both the historical background and the COVID-19 pandemic, in which we are still immersed. For that purpose, despite their different degrees of restriction, it is relevant to declare which were the confinement periods in the four countries. On the occasion of the first wave of the pandemic, Italy established a confinement period between 9th March and 19th May, while in Portugal it was from 22nd March and ended on 2nd May.45 In Hungary it lasted from 16th March to 4th of May (in Budapest until 25th May) and in Lithuania, from 16th March 2020, until 31st May 2020.46
In Italy, bicycle use has been traditionally popular in the flat northern cities (e.g. Parma, Bologna) but is now also becoming more frequent in cities further south. Rome has an unexpressed potential to tap into walking and cycling. Unfortunately, in many cases, cycle paths fail to protect cyclists, because they have been sometimes poorly planned, tapering off into the oncoming traffic or dead-ends; cars and motorcycles often fail to respect bike lanes. With the current mayor, in charge since 2016, the cycling policy is changing. The length and quality of the infrastructure has increasing, but cultural barriers remain. Despite good weather, tracks are not used as they could be, given the need to overcome cultural attitude and generalized beliefs, and the fact that safety conditions still represent a big issue for riders.
However, the COVID-19 pandemic crisis determined a series of behaviour changes, a significant growth of cycling and a massive surge in bicycle sales.
Some 540,000 bikes have been sold nationwide since shops across the country reopened in early May 2020, according to sector lobby Ancma, a 60% increase in the first month compared to the same period in 2019. To keep people off public transportation and avoid road congestion, the government has offered to contribute up to 500 euros for city-dwellers who buy traditional or ‘pedal-assisted’ electric bicycles. The subsidy, which kicked in on May 4 and runs to the end of the year, has accelerated a trend in place even in small centres where it is not available.47
During the pandemic, e-scooter services popped up in Rome. However, since their blooming, one has already been interrupted, and one the BSS was also closed. In this period, there have been no public measures regarding the promotion of bike and e-scooter sharing. Nevertheless, it is too early to understand whether this is just a temporary effect or a more radical shift.
In Portugal, in addition to the bicycle promotion movements, the increase in urban cycling only became expressive after the beginning of the twenty-first century, when at both local and national scale governments also started to consider this practice, although in most municipalities bike lanes were firstly built in leisure areas, either by the shore or near natural landscapes of interest. However, in May 2020, the Ministry of Environment opened a call for municipalities to propose measures, within this strategy, to promote the use of bicycles as a response to the pandemic situation, maintaining distance and physical activity. The current mayor of Lisbon, in charge since 2015, is an advocate of cycling and walking in the city, and has been documented as a bicycle commuter, particularly in COVID times. The pandemic also increased the sales of bicycles, mechanical and electric exponentially,48 as well as the applications for fiscal benefits on their purchase, under central and more recently, local measures.49 In Lisbon, the public BSS was also a means for the municipality to promote cycling as a strategy to fight the pandemic, firstly by attributing bikes to the delivery services, secondly by providing them for free to health workers and other first line responders, and finally, since July 2020, being free to use by all residents, workers and students.50
Hungary is a peculiar case where cycling is ambiguous. On the one hand, cycling is traditionally part of life in rural Hungary, further boosted by recent policies and a governmental commissionaire that are enhancing developments in cycling, both as mobility and a leisure activity at national level. On the other hand, cycling turns to a battlefield when it comes to Budapest, even though all political actors are in favour – to various extents – of urban cycling in the capital city, but car-dominated urban mobility is still considered as the default context by conservative politicians and actors. Although the previous right-wing conservative municipality developed the cycling infrastructure, introduced the first bike-sharing scheme in Budapest and also elaborated strategic plans to enhance urban cycling and inter-modality, it also prioritized cars over bikes constantly in urban development programmes during an almost decade-long leadership. On the contrary, the newly elected oppositional municipality (green-left-liberal) holds a coherent vision on sustainable mobility with a strong focus on micro-mobility, including urban cycling and with less dominance of cars. Especially during the COVID-19 pandemic, the new municipality reacted by opening new bike lanes on major car routes and made the use of the municipal bike-sharing system free of charge for all people. At a national level, a subsidy for e-bicycle purchase was launched in September 2020. According to a recent survey, seven out of ten Hungarians are cycling with varying frequency, and their share has increased especially in Budapest after the first wave of the pandemic by mid-2020.51 The government has also introduced the first ever bicycle subsidy for e-bikes from late 2020, thus further enhancing cycling.
The coronavirus pandemic has also triggered some improvements regarding investment in cycling in Lithuania. Over the past four years, Vilnius has renovated over 50 km2 cycle lanes. Thus, it is expected that by 2023, the reconstruction of the main cycle lanes will be complete (Judu, 2020). Indeed, the city seeks to increase the cycling share up to 7,5%.52 In July 2020, the Vilnius municipality, taking advantage of the opportunities offered by confinement, closed four streets and its sections for pedestrians at the heart of the capital. Moreover, the decision entailed a diverse type of traffic organization that organized the traffic in loops in order to make temporary walking and cycling lanes. Notably, based on data collected by the city, 40% of the traffic was diverted during the peak hours from the centre of Vilnius, and thus, all streets and their sections were free-up for residents and Vilnius’s guests. The mayor of Vilnius highlights that the main ideas came from the experiences of many Western European cities, but the confinement due to COVID19 brought the process further and has allowed the city to implement the project a year earlier (Vilnius, 2020). Neither bike- nor e-scooter sharing were expanded or made available for discounted prices, nor any other measure to promote its use was taken.
Common measures introduced during or after the lockdown periods related initially to the infrastructure, by extending the bike lane network partly by converting roads previously used only by cars to mixed modes, where cyclists can ride on separate safe lanes. This was feasible due to the drastically decreased car traffic during the lockdown. Therefore, the challenge is how to keep or maintain these new improvements after the confinement, when car traffic returns to the same level. This issue has generated a heated political and public ‘cars vs bicycles’ debate in the case of Budapest, where, finally, most newly created bike lanes remained after the lock-down. In Lisbon, reports of situations of conflict between drivers and cyclists have increased considerably, in the last few months, along with some outbreaks against new cycle paths created during the lockdown (MUBi Forum, 2020).53
In every index that compares cities’ conditions for cycling, infrastructure is a major factor taken into consideration,54 as it is proven that the existence of a structured network of bicycle lanes is behind the increase in cycling as a regular means of transportation (Marques et al., 2015). The length and functionality of cycling infrastructure is a criterion to define a city’s cycling maturity, to label them as starter or champion cities, and to evaluate their cycling potential (e.g., the possibilities of a starter city to increase its cycling modal share) (Felix, 2019; Silva et al., 2018, 2019). The infrastructure can cover four major components: network links, intersections and crossings, parking, and public transport (Dufour, et al., 2010). Here, we focus on the first one. Many European cities have announced some infrastructure changes in the city centre to promote walking and cycling during the COVID-19 period. According to the latest data provided by the ECF (2020), the largest number of new cycling kilometres was announced and implemented in Rome (150), followed by Lisbon (90.7) and Budapest (16.83) (see Table 4.7).
Comparison of cycling networks and their improvements during the COVID-19 pandemic.55
| European Cities | City Population | Population Density/km2 | City Area/km2 | Cycling Paths (km) | New Cycling Paths (km) |
|---|---|---|---|---|---|
| Budapest | 1 696 128 | 3.366 | 525.2 | 325 | 20 |
| Vilnius | 617 000 | 1.446 | 401 | 93 | N/A |
| Rome | 2 782 858 | 2 166 | 1.285 | 225 | 150 |
| Lisbon | 508 368 | 5.081 | 100.05 | 105 | 90.7 |
As shown in Table 4.7, Budapest (325 km) and Rome (225 km) have the largest network of cycle paths in comparison with Lisbon (105 km) and Vilnius (93 km). However, all the considered municipalities have decided to extend their cycle paths, taking advantage of the pandemic situation to implement this earlier. Lisbon is expected to expand up to 90,7 kilometres of cycle paths,56 and the main cycle lanes should be completed in Vilnius by 2023 (Judu, 2020). Regardless of city areas, which would justify a wider cycling network in Rome, and based on population density, which is higher in Budapest and Lisbon, it would be expected for these municipalities in particular to densify their cycling networks, in order to reduce motor traffic. According to the ECF (2020), additional cycling funding in euros per person has risen in many European countries during COVID-19 period (Vandy, 2020). For instance, Finland spends the most significant amount of money – 7.76 EUR in comparison with other European countries: Italy – 5.04 EUR, Lithuania – 2.61 EUR. The smallest amount of money was spent in Portugal (0.29 EUR). It is worth noting that cycling infrastructure is useful also for e-scooters and other light sustainable transportation modes.
The changes in mobility habits during the pandemic are not limited to cycling – the use of e-scooter-sharing, which is still more common than using private escooters, is expanding. According to recent data from a private provider, users switch to using e-scooter services from leisure trips to work trips, especially during working days and hours in Vilnius. Thus, the number of users of e-scooter-sharing services since the COVID-19 pandemic has increased.57 Consistent with this trend, in March 2020, a new international player in this sector arrived in Vilnius, offering 100 e-scooters.58 In a similar vein, another private company active in Budapest, expanded its services to rural cities.59 In summary, the increasing number of e-scooter-sharing service companies indicate a trend to shift mobility habits, especially prompted by COVID-19. However, during this period some services in Rome and Lisbon have also been disrupted, some of them were then restarted, other two did not. Therefore, the impacts of the pandemic both in e-scooter and bike-sharing practices can not be interpreted unidimensionally, and any indicator of a trend in these sharing practices must be considered within a highly uncertain and ever rapidly changing scenario.
4.6 Conclusion
In the four European capitals considered in this chapter – Rome, Lisbon, Budapest and Vilnius – bike- and e-scooter-sharing services have recently become a reality, a possibility for mobility as a service, favouring access over property, and active travel over motorized sedentary mobility. The cultural context of mobility is similar among the four cities, with private car use still being the norm. At the policy level, it is clear that mobility as a service is still not a priority in the analysed countries, as bike and e-scooter sharing services are merely local measures, that have not been subsidised or included in any national sustainable mobility plan or promotion initiative; in contrast, fiscal benefits have been given for purchase of bicycles. Therefore, the rise in bike- and e-scooter-sharing has caused intense debate – further fuelled by the poor regulation and fiscalization of these services – about the impacts on public space and traffic. Their potential for breaking cultural ground and changing mobility patterns needs to be further explored. Even though there is evidence of the expansion of their use, in the analysed countries, except for Italy, there are no official statistical data about bike- or e-scooter-sharing.
Within bike-sharing, two of the providers are public – Lisbon and Budapest – and they have been the only cities to use bike-sharing as a measure to promote active mobility for interpersonal distancing and health during the pandemic. Scooter-sharing systems are all run by private enterprises, but despite the lack of information on any discount or promotion measure of these services, during the pandemic there is some evidence of its expansion. The lack of public regulation and support for expanding the inclusivity of light sharing services, even in a pandemic context, calls for action on enlarging the accessibility of the public BSS and improving public-private partnerships within mobility systems.60 At the same time, it
leads us to question how much caring is in these sharing services, if their private promoters do not take on their social responsibility. The potential for social inclusion of light mobility sharing is strong, as these are transportation means that most people can use and which can be adapted to people with disabilities. However, business models, pricing policies, geographical distribution, the level of technology included and its user-friendly traits must all be taken under consideration.61 Further research is needed in order to understand, not only the ethos and the concerns for social inclusivity of these sharing mobility services, but also the relations between municipalities, private providers and stakeholders of social movements within the cycling and active mobility scenarios of each city and country.
References
Notes
As mentioned in Chapter 13 of the current publication.
Vilnius data were only available for 2018.
Lisbon data were only available for 2019 (PORDATA).
Cyclocity (2020). Mūs¸u narysči¸u pasiūlymai [Offers for members]. Cyclocity. https://www.cyclocity.lt/en/offers/groups
Even though most e-scooter service delivers advice against it, once pavements are for pedestrians. However, the poor regulation of e-scooters in most countries has generated a grey area in this regard.
It should be noted that neither of these means of transportation is new: the bicycle was invented in the XIX century and the e-scooter in the beginning of the XX century.
European Commission (2018, September). Reduction in Road Deaths 2010–2017. European Commission. Retrieved from https://ec.europa.eu/transport/road_safety/sites/roadsafety/files/mapcare_chng2010_2017.pdf
A traffic jam on bikes’, protest by cyclists reclaiming the streets originated in 1992 in San Francisco.
Called ‘Bicifestazione’.
Massa Crítica, also known as Bicicletada.
Felix, R. (2019). Barriers and motivators to bicycle in low cycling maturity cities: Lisbon case study. Phd Thesis, INSTITUTO SUPERIOR TÉCNICO, UNIVERSIDADE DE LISBOA, Lisboa.
Member of European Cyclist Federation (ECF).
Member of European Cyclist Federation (ECF).
Member Union Cycliste Internationale (UCI).
Diário da República, 1ā Série, n° 147, Resolução do Conselho de Ministros n.° 131/2019 de 2 de Agosto de 2019. Available at:https://dre.pt/web/guest/pesquisa/-/search/123666113/details/normal?q=mobilidade+ativa
Active Hungary Program: https://aktivmagyarorszag.hu/; National Tourism Development Strategy 2030 https://mtu.gov.hu/documents/prod/mtu_strategia_2030-english.pdf
Instituto da Mobilidade e dos Transportes, IP (2021). Estratégia Nacional para a Mobilidade Ativa Ciclável. Encontros Regionais. Available at:http://www.imt-ip.pt/sites/IMTT/Portugues/Noticias/Paginas/EncontrosRegionaisENMAC-22042021.aspx
On a similar note, car-free days are celebrated in Lithuanian cities during the European Mobility Week, while in Italy similar events were defined by a national decree published in 2000 by the Environment Minister, opening the first of four successive Ecological Sundays, to take place on the first Sunday of the month. In Portugal car-free zones were defined during parts of the weekend, but only by local authorities’ decisions and programs. On the contrary, Hungary applies these measures only occasionally, albeit European Mobility Week is also celebrated.
Additional funding for cycling has been provided for by the Law 27 December 2006, n. 296 (so-called 2007 Finance Law) which reserved less than 5 percent of the Fund for sustainable mobility for the interventions referred to in the Law 19 October 1998, n. 366.
https://ecf.com/dashboard [03 October 2020].
In two subsequent declarations of Emergency State.
Central Government Fiscal benefits, firstly introduced in 2019, and improved in 2020:https://www.fundoambiental.pt/avisos-2020/mitigacao-das-alteracoes-climaticas/incentivo-pela-introducao-no-consumo-de-veiculos-de-baixas-emissoes-2020.aspx; Lisbon Municipality launched fiscal benefits in 2020: https://www.lisboa.pt/programa-de-apoio-aquisicao-de-bicicletas;
https://www.publico.pt/2020/07/09/local/noticia/pcp-propoe-estrategia-alternativa-apoio-bicicleta-lisboa-1923773; However there is no further information about this experience, other than the news about the decision.
Source: The same number of pro-government and opposition cyclists, many cycling because of the pandemic – national research 2020 (Ugyanannyi kormánypárti és ellenzéki kerékpározik, sokan bicikliznek a járvány miatt – országos kutatás 2020), Hungarian Cyclists’ Club, 2020, in Hungarian. https://kerekparosklub.hu/kerekparoskutatas_2020
It’s Official: Vilnius Introduced Its Plan for Combating After-Effects of the Pandemi. Vilnius. Retrieved from https://vilnius.lt/en/2020/05/05/its-off icial-vilnius-introduced-its-plan-for-combating-af ter-effects-of -the-pandemic/
Fórum da MUBi – Associaçāo pela Mobilidade Urbana em Bicicleta. Available at (subjected to membership): https://forum.mubi.pt/
Data source:https://ecf.com/dashboard [03 October 2020].
blog.Bolt.eu (2020a April 06). Micro-mobility as a safer method of essential urban travel. In Bolt. Retrieved from https://blog.bolt.eu/en/micro-mobility-as-a-safer-method-of-essential-urban-travel/ [2020 09 21]
https://www.delfi.lt/verslas/transportas/vilniuje-ankstinama-elektriniu-paspirtuku-sezono-pradzia.d?id=83792393https://www.lrt.lt/naujienos/verslas/4/1201360/kelione-i-darba-paspirtuku-pigiau-nuomotisar-tureti-savo; https://www.vz.lt/transportas-logistika/2020/03/17/vilniuje-veikla-pradeda-trecioji-paspirtuku-nuomos-kompanija-scoot911;