Sweep deposits are a relatively recent and important innovation that allows the seamless transfer of client cash from brokerage firms to bank accounts andvice versa. We find that funds swept from brokerage firms to banks vary inversely with stock market performance. When the stock market declines, retail investors reduce risk and sell stocks, with the proceeds swept out of brokerage firms and into banks. The relation is asymmetric as sweep deposits do not appear to decline in response to positive movements in the stock market. Sweep deposits are the primary driver backing the same asymmetric relation between domestic bank deposits and the stock market. Moreover, sweep deposits provide additional financing stability to banks as households reduce risk by converting stocks to deposits during stress periods, helping to fund drawdowns in lines of credit by firms.
Numerous stock market downturns of large magnitude have occurred over the past several decades. A recent example is when the S&P 500 plummeted 34 percent in early 2020 during the onset of the COVID-19 pandemic. Retail investors often exit the stock market when these downturns occur as households reduce risk. Interestingly, the flight to quality does not necessarily result in increased cash balances held on behalf of the investor by its brokerage firm. Instead, the brokerage firm sweeps the client cash from stock sales to banks, an unexplored role of brokerage firms in the banking deposit channel.
Consider the following. In March 2020, during the early days of the widespread market turmoil due to COVID-19, Charles Schwab Corporation unexpectedly issued $1.1 billion of senior unsecured notes for “general corporate purposes which may include additional capital to its bank subsidiaries to support balance sheet growth. . .[due to] the increase in sweep deposits resulting from the de-risking of client portfolios following the sharp increase in market volatility resulting from the COVID-19 pandemic” (Fitch, 2020).1Thus, households sold stocks due to the plummeting stock market, which in effect led to “runs to banks,” forcing Charles Schwab to raise more capital to support the sudden balance-sheet growth at its banking subsidiary.
In the 1960s, brokerage firms began placing cash from their customers into federally insured deposits at banks which took the form of certificates of deposit (CDs). In the late 1970s, brokerage firms started automatically shifting some customers’ cash into bank deposits, and the transferred funds became known as sweep deposits (Barth et al., 2020). When Merrill Lynch began offering this service in early 2000, deposit sweeps took off (Clark, 2016). Soon after, several online brokerage firms, including Charles Schwab, launched sweep deposit programs for customers (Hamilton, 2005) via the creation of affiliated banks. A few years later, other brokerage firms began to sweep client cash to non-affiliated banks and often to multiple banks, and even for the same client.
There has been no systematic analysis of the role of brokerage firms in serving as intermediaries in channeling funds from investors to banks, particularly at times when financial markets are under stress. The primary reason for this gap in the banking literature is a lack of readily available data.2Bank regulatory authorities do not provide information on sweep deposits at individual banks or even banks in the aggregate. According to Tepe (2016), the Securities and Exchange Commission (SEC) does not require broker-dealers to report detailed information on their sweep programs. To fill this data void and study their intermediation role, we have gained access to sweep deposits for TD Ameritrade Holding Corporation, a large brokerage firm. We also acquired estimates of sweep deposits data for banks from IDC Financial Publishing (IDC), a private firm that rates the safety and soundness of banks.
Regulators have historically viewed sweep deposits from brokerage firms to banks as a type of brokered deposits. A brokered deposit is a bank deposit placed by a third party on behalf of the depositing entity. In the case of a brokerage firm, TD Ameritrade is the deposit broker intermediating the movement of cash from a client’s brokerage account to a bank, either affiliated or not. A brokered deposit is a major component of wholesale funding, whereby banks obtain financing outside traditional or core deposits. Until recently, banking regulators and many commentators generally had a negative view of brokered deposits stemming from the 1980s when many severely distressed savings and loans resorted to paying high-interest rates to acquire non-traditional funding via deposit brokers.3
According to the FDIC (2019, p. 2369), “[t]he history noted that, although the use of brokered deposits and other wholesale funding sources within a sound liquidity management program is not in itself a risky practice, significant reliance on wholesale funds may reflect a decision that an institution has made to grow its business more aggressively . . . [and] . . . if the institution comes under stress, wholesale counterparties may be more apt to withdraw funding or demand additional collateral.” As regards sweep deposits, which constitute a major component of brokered deposits, such deposits may instead decrease the risk for banks by encouraging cash inflows into banks during times of high systemic stress. We directly address this issue by examining what happens to sweep and brokered deposits during market downturns.
Our paper contributes to recent studies that, like our own, examine various factors that lead to changes in deposits. Drechsler et al. (2017) show that monetary policy strongly affects bank deposits; they find that an increase in the Federal Funds rate triggers deposit outflows as banks widen the spread they pay on deposits. For example, they find that deposit rates increase only 54 basis points for every 100 basis points increase in the Federal Funds rate, thus leading to the exit of some deposits given their higher opportunity cost. Li et al.(2020b) model how bank deposits respond to changes in the supply of U.S. Treasury securities and monetary policy. Their analysis indicates that an increase in both U.S. Treasury securities and the Federal Funds rate leads to declines in deposits. Lin (2020) examines whether market fluctuations transmit to the banking sector through a rebalancing in household portfolios. Lin’s results indicate that stock market booms are associated with slower deposit growth due to households’ reduced demand for deposits. None of these studies considers another avenue in the deposit channel, namely whether market downturns affect sweep or brokered deposits.
Related literature focuses on why banks engage in deposit-taking and providing lines of credit. Influential research by Kashyap et al. (2002) notes that deposittaking and lines of credit provide the same function: supplying liquidity on demand. In their model, if the demand for liquidity from depositors is not highly correlated with the liquidity demand from borrowers, banks realize synergies due to needing lower cash balances to serve both sets of customers. Gatev et al. (2009) provide empirical support for the theory that deposits allow banks to manage their liquidity risk, especially during market pullbacks.4 Their empirical results suggest investors move funds into deposits during market turmoil. Ivashina and Scharfstein (2010) show that in the aftermath of the 2008 failure of Lehman Brothers, there was a run on banks by corporations that drew down their credit lines. They note that the banks with better access to deposit funding were less likely to cut lending elsewhere.
Our empirical results indicate a robust and negative relation between stock market returns and sweep deposits to banks by brokerage clients at TD Ameritrade. More specifically, based on piecewise linear regression results, we find that sweep deposits growth at banks affiliated with TD Ameritrade is significantly related to stock returns when they are negative, but not when the stock returns are positive. This finding indicates an asymmetric relationship between sweep deposits growth and stock returns. We view this result as consistent with the “run to the bank” thesis; as stock markets drop, brokerage customers reduce exposure to risky assets and thereby raise cash, which is swept to banks.
The TD Ameritrade empirical results extend to both aggregate level and individual bank level, where we document a significant inverse relationship between stock market returns and cash sweeps from brokerage firms to banks. Indeed, the stock-return coefficients for the sweep deposits results are several times that for total domestic deposits. Intuitively, to the extent investors reduce exposure to the stock market during stress periods, the reduction will be magnified regarding sweep deposits due to their origin, namely, brokerage accounts. We also document the same asymmetrical response of sweep deposits to the stock market: the relation is far stronger when the market is in decline. While Lin (2020) also finds that bank deposit growth is negatively related to stock returns, he estimates a symmetric relationship between these two and hence does not observe that the relationship is significantly stronger for market downturns. Overall, our results suggest that sweep deposits from brokerage firms are the primary driver behind a similar asymmetric relation between domestic deposits and stock market activity, a pattern not previously documented.
Moreover, we document that, like savings and checking deposits, sweep deposits growth reacts significantly negatively to an increase in the Federal Funds rate. In contrast, non-sweep brokered deposits act more like time deposits, with a significantly positive relationship to an increase in the Federal Funds rate. Furthermore, we find that an increase in the ratio of sweep deposits-to-total assets is positively associated with an increase in the ratio of cash-to-total assets and negatively associated with the ratio of unused loan commitments-to-total assets. In the context of the research discussed above, sweep deposits provide funding to banks that are subject to bank runs by corporations drawing down their credit lines during stress periods such as in the aftermath of the 2008 failure of Lehman Brothers and most recently during March 2020 when the COVID-19 outbreak hit the United States.
We also extend our analysis to consider the historical concerns of regulators such as the FDIC and the former Federal Home Loan Bank Board about the lack of stability of brokered deposits as a funding source. Our results indicate that brokered deposits, generally, and sweep deposits, specifically, do not increase overall deposit volatility. Indeed, despite their high volatility, sweep deposits and brokered deposits provide some stability to banks as investors reduce risk by converting stock first to cash and then to federally insured deposits during periods of high stress. Moreover, these non-traditional deposits enhance banks’ hedging of liquidity risk by helping facilitate providing loan commitments and lines of credit to corporations. And when traditional deposits decline, for example, due to monetary policy changes, banks can readily access brokered and sweep deposits to maintain a steady level of overall deposits. This finding is also documented by Choi and Choi (2021), who find that banks attempt to substitute wholesale funding for retail deposit outflows to smooth their lending when monetary policy tightens.
The remainder of the paper proceeds as follows. The following section discusses the origin and growth of brokered deposits, focusing on sweep deposits. This relatively recent innovation now accounts for a large proportion of brokered deposits. Section 2 describes the data used in the empirical work, including sources, variables, and summary statistics. The model and empirical results are presented and discussed in Section 3. Section 4 analyzes the impact of brokered deposits, generally, and sweep deposits, specifically, on the volatility of overall bank deposits. The last section contains our conclusions and suggestions for future research regarding sweep deposits.
1 Brokered Deposits and Sweep Deposits
1.1 Brokered Deposits
According to the FDIC, a brokered deposit is “any deposit that is obtained directly or indirectly, from or through the mediation or assistance from a deposit broker.” In essence, the definition of a brokered deposit is broad because the deposit broker making the deposit can be any third party (person or entity) that is not the owner of the deposit. Brokered deposits first appeared in the early 1960s when institutional investors such as money market funds, corporations, bank trust departments, and insurance departments began to purchase large CDs through deposit brokers. The technological innovation underlying the birth of brokered deposits was the development of electronic funds transfers (EFTs) which allowed banks to access deposits far away from their local branches. By the early 1980s, retail customers began participating in bank CDs, often via deposit brokers. Starting in the late 1990s, broker dealers began offering their brokerage customers an automatic sweep program by which customers’ idle funds were swept to affiliated insured depository institutions.
After these developments, the Gramm-Leach-Bliley Act, also known as the Financial Modernization Act, became law in 1999 and allowed banks, securities firms, and insurance companies to affiliate under a financial holding company. The creation of such companies led to more brokerage firms sweeping customers’ balances from money market funds into deposits at affiliated banks. Merrill Lynch was the first brokerage firm to change the default sweep of its Cash Management Account (CMA) from Merrill’s CMA Money Fund into Money Market Deposit Accounts (MMDAs) at Merrill Lynch Bank USA (Pennacchi, 2006). More generally, with the innovation of CDs, and the relationships with brokerage firms, as well as investment and wealth management firms, custodians, and a variety of other types of financial institutions, banks could raise funds from savers and investors well beyond their local markets via brokered deposits. In short, technological and financial innovations have given banks access to a broader range of alternative funding sources to supplement traditional deposits obtained through a branch network.
There are four basic types of brokered deposits: brokered CDs, sweep deposits, reciprocal deposits, and general-purpose pre-paid cards. We discussed brokered CDs above and will discuss sweep deposits in more detail below. A reciprocal deposit is when a bank receives deposits via a deposit placement network where it places equivalent deposits at other banks via the same network. Reciprocal deposits have been around for roughly twenty years and permit smaller banks to offer their local customers access to higher deposit insurance than otherwise. General-purpose pre-paid cards are sold at retail stores or other venues. Once the funds are collected from the card purchaser, they are typically deposited by the card company into a custodial account at a bank. The FDIC views the prepaid card companies or other third parties who sell these cards as deposit brokers; thus, their deposits are regarded as brokered deposits.
Due to technological developments and a rapidly changing marketplace, the FDIC has recently relaxed some of its rules regarding brokered deposits. In 2021, FDIC began to allow brokerage account sweep deposits to average up to 25 percent of securities account balances (rather than 10 percent as previously required) without counting as “brokered deposits” as well as a process for fast determination of the status of deposit arrangements under the “primary purpose” test for deposits intermediated through third party agents (Cleary Gottlieb, 2021). Also, entities whose primary purpose is not to place funds with banks are now exempt from the definition of a deposit broker. For example, a wealth management firm that invested the cash holdings of its clients with a bank would no longer be considered a deposit broker. Thus, the respective funds would be regarded as traditional deposits rather than brokered deposits. These new rules substantially narrow the definition of “deposit broker” and significantly expand exceptions relative to previously issued FDIC advisory opinions. These regulatory changes should lead to an expansion in brokered deposits and sweep deposits.
1.2 Sweep Deposits
1.2.1 Sweep Deposit Mechanics
When a brokerage client sells a stock, the trade settlement occurs two business days later, when the client receives credit for the cash proceeds.5The historical default option for brokerage firms is to retain the cash. While the cash is credited to the client’s account, the cash is not put in escrow or set aside for the client’s exclusive use. Instead, the brokerage firm can utilize the cash for specific purposes governed by SEC Rule 15c3–3.6,7 A primary purpose is to ensure that brokerages do not use client assets to finance operations unrelated to servicing brokerage clients. SEC Rule 15c3–3 stipulates that a brokerage firm must segregate client cash from its other operations and only invest that cash in financing margin loans for other brokerage clients, U.S. Treasuries, and similar quality securities.
The popular alternative to segregating client funds and investing in U.S. Treasuries is for brokerage firms to sweep client cash into a bank account, providing FDIC protection.8In addition to FDIC protection, the brokerage client benefits from the convenience of check writing and ATM withdrawals. The cost of this convenience is low yields relative to the client actively choosing to invest the cash in a money market fund. As already noted, Merrill Lynch popularized bank sweeps in 2000 when it introduced a Bank Deposit Program in its Cash Management Account, where Merrill linked a savings account to a brokerage account. While some brokerage firms engaged in bank sweeps before 2000, the Merrill Lynch model of sweeping to an affiliated bank was soon replicated. Other brokerage firms like Charles Schwab began to create and sweep deposits to affiliated banks. Historically, from a regulatory perspective, sweep deposits are a subset of brokered deposits because they do not originate via a branch banking model.
In 2006, Ameritrade Holding Corporation, an online brokerage firm, purchased the retail brokerage subsidiary from TD Bank Group for 39.9 percent of stock in the renamed TD Ameritrade Holding Corporation. As part of the transaction, Ameritrade would sweep client cash balances to TD Bank, the U.S.-based subsidiary of TD Bank Group. Historically, Ameritrade had segregated client cash at its broker-dealer subsidiary, the default option described above, with SIPC protection for the clients. With the new cash sweep arrangement, brokerage clients receive FDIC protection for cash swept into TD Bank. To give a relative sense of the size of this sweep arrangement, the roughly $150 billion of client cash TD Ameritrade swept in 2020 to TD Bank places it as the 14th largest U.S. bank based on deposits.9
Lastly, in addition to sweeping to an affiliate bank like Charles Schwab or via a contractual relation as with TD Ameritrade, brokerage firms can sweep client cash to a network of banks. For example, Interactive Brokers sweeps to up to ten different program banks, providing its brokerage clients coverage of $2.75 million, including $2.5 million of FDIC insurance via the program banks and $250,000 of SIPC cash protection. By sweeping funds to a diversified portfolio of program banks rather than a single bank, the brokerage firm mitigates a client’s risk of loss of deposits exceeding the insurance limit in the unlikely event the single bank fails. Today, the sweep deposits market has evolved where the sweep relationship is not merely manufactured in one-off contractual situations, such as TD Ameritrade, but rather via intermediaries, which create the network and utility for the respective parties to transact.
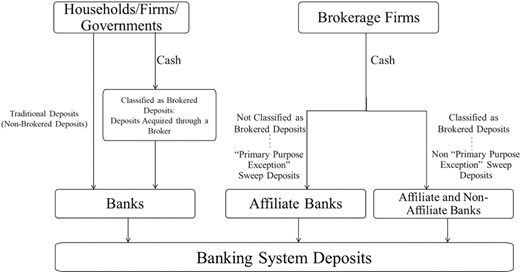
Figure 1 shows the relationship between traditional deposits10(non-brokered deposits), brokered deposits, and sweep deposits. Households, firms, and governments can directly deposit funds into their bank accounts, which we refer to as traditional deposits in Figure 1. Alternatively, if a bank utilizes brokers to acquire deposits, the deposits are classified as brokered deposits. Likewise, cash swept into bank deposits by brokerage firms or several other types of financial firms becomes included within the category of brokered deposits. An exception is if the cash is swept into deposits at affiliate banks of the brokerage firm because the deposits are not classified as brokered deposits as long as they satisfy the “primary purpose” exemption.11Thus, in general, banking system deposits consist of traditional deposits, deposits classified as brokered deposits (i.e., deposits acquired through a deposit broker and “non-primary purpose” exception sweep deposits), and “primary purpose” exception sweep deposits.
1.2.2 Aggregate Sweep Deposits in Perspective
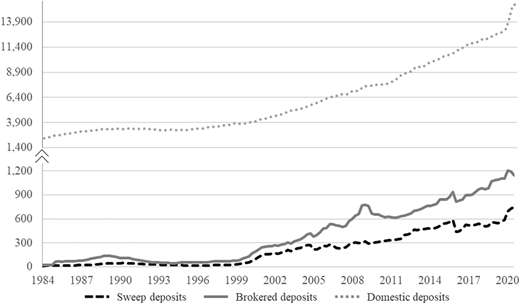
Figure 2 displays aggregate quarterly sweep deposits by brokerage firms over 1984-2020 and total domestic and brokered deposits. As illustrated, there were relatively modest increases in all three deposit types from 1984 to 1999. In 2000, the deposit measures tended to increase at higher growth rates, with brokered deposits growing more rapidly. This trend may continue to the extent that banks increasingly rely less on brick-and-mortar branches and more on other funding sources.12 Per the earlier discussion, Merrill Lynch’s introduction of its Bank Deposit Program linked an MMDA account to a brokerage account, followed by other major brokerage firms, which contributed to an increase in bank sweep deposits, as displayed in Figure 2. As Pennacchi (2006, p. 15) points out, “[d]uring the 5 years from the end of 1999 to the end of 2004, balances in MMDAs grew at a 16.4% annual rate while assets of retail money funds declined at a 3.0% annual rate, a phenomenon that Crane and Krasner (2004) refer to as ‘re-intermediation’.”
Also, during the 2008 financial crisis, brokered deposits sharply increased.13 By 2020, brokered deposits and sweep deposits, excluding those reclassified by the FDIC as traditional or core deposits, had already accounted for 12.1 percent and 7.3 percent, respectively, of total domestic deposits.
Table 1 shows domestic, brokered, and sweep deposits among banks in different asset size groups in the third quarter of 2020. Banks with assets over $50 billion, which we denote as large banks, dominate the various measures of deposits. For example, while the 50 large banks account for less than one percent of all banks, these large banks account for roughly 72 percent of all domestic deposits. And the large bank concentration is even higher for brokered and sweep deposits, accounting for nearly 85 percent of sweep deposits.
The convenience and safety benefits of sweep deposits for brokerage clients are clear. The banking counterparties benefit from another diversified source of funding and one that doesn’t require brick-and-mortar investments. As discussed, the brokerage firm, TD Ameritrade, sweeps client cash to TD Bank, one of the largest banks in the United States. TD Bank has over 1,200 branches on the east coast, many in highly concentrated areas with high property values. The sweep deposits from TD Ameritrade provide a diversified funding source and are often a cheaper option to deposit growth than building new branches. Likewise, large online-only banks without physical branches, such as Ally Bank or Marcus by Goldman Sachs, are active participants in the sweep deposit market. Even the largest banks, such as JPMorgan and Wells Fargo, participate in sweep deposits as a funding channel. These banks view sweep deposits as relatively sticky and thus pay interest rates higher than brokerage firms can obtain on their own via investing in short-term Treasuries.14
IDC’s estimates of sweep deposits for banks do not include some “affiliated” bank sweeps. In 2005, the FDIC issued an advisory opinion that a bank, which accepted sweeps from an affiliated brokerage firm, could, under certain circumstances, receive an exception from reporting the sweep deposits as brokered deposits.15 According to the FDIC, 28 depository institutions received $724 billion in funds, as of September 30, 2018, swept from an affiliate broker-dealer that would be “primary purpose” exceptions and thus exempt from being reported as brokered deposits (FDIC, 2019). The inclusion of these $724 billion affiliate sweeps would substantially impact the proportion of brokered deposits relative to domestic deposits for 2018Q3, increasing from 8.0 percent to 13.9 percent. And the percentage of sweep deposits would increase from 4.2 percent to 10.1 percent.16Thus, brokerage sweep deposits are a far more significant component of bank deposits than typically represented and understated by the data reported in Figure 2 and Table 1.
2 Data
This section describes the data sources and variables used to estimate the empirical model. The TD Ameritrade sweeps data is monthly from November 2009 to September 2020 (henceforth 2009-2020).17 Access to the TD Ameritrade data ended in September 2020 with its merger with Charles Schwab Corporation. The bank deposits data is quarterly, from the first quarter of 198418 to the third quarter of 2020 (hereafter 1984-2020).19
2.1 Data Sources
We rely on several data sources for the empirical work. Except for sweep deposits, the bank variables come from the Consolidated Reports of Condition and Income, or Call Reports, filed by all banks. The information is available from the Federal Financial Institutions Examination Council (FFIEC) for 2001 to 2020 and the Federal Reserve Bank of Chicago for 1984 to 2000. The sweep deposits data for banks are from IDC and TD Ameritrade. Stock return data come from the Center for Research in Security Prices (CRSP). GDP and the Federal Funds rate data come from the Federal Reserve Bank of St. Louis. The source for the investor sentiment data is Jeffrey Wurgler’s homepage at NYU, supplemented by investor sentiment data from the American Association of Individual Investors (AAII).
2.2 Variable Measurement
The primary dependent variable of interest is the growth rate of sweep deposits. The primary independent variable of interest is the return data from the monthly stock files of the value-weighted index (VW) of U.S. stocks from the Center for Research in Security Prices (CRSP). We compound the monthly returns each quarter to convert them to quarterly returns. We also include three control variables: GDP growth, the first difference in the average monthly effective Federal Funds rate in the last month of a quarter, and the first difference in Wurgler’s investor sentiment index. Section 3 provides the rationale for choosing these control variables.
Because sweep deposit data are unavailable in the Call Reports, we rely on data obtained from IDC. Sweep deposits are generally based on a calculation that equals brokered deposits minus the sum of brokered CDs and reciprocal deposits. IDC employs a proprietary algorithm involving several rules and steps to obtain their estimate of sweep deposits. To check the accuracy of the estimates, we compare the growth rate for the actual sweep deposits of TD Ameritrade and the estimated sweep deposits at TD Bank from IDC: the correlation coefficient is 0.70 and highly significant. In the Appendix, we provide evidence that the sweep data estimated by IDC for TD Bank yields similar estimates to the actual sweep data from TD Ameritrade.
2.3 Summary Statistics
Table 2 provides summary statistics for the variables used in the empirical analysis. For the aggregate data from 1984–2020, there are 146 quarterly observations, with the summary statistics displayed in Panel A. Over this period, sweep deposits grew at an average quarterly rate of 3.4 percent compared to 3.4 percent for brokered deposits and 1.3 percent for domestic deposits. The quarterly standard deviations of sweep deposits (10.6 percent) and brokered deposits (14.0 percent) are far higher than the quarterly standard deviation of domestic deposits at 1.7 percent.
Due to a few extreme outliers for brokered deposits and sweep deposits during the first few years of the sample period, we winsorize the growth rates for both series at the 2.5 percentile and the 97.5 percentile in the subsequent empirical tests.20 Our concern is that some extreme outliers may occur due to the estimation error of sweep deposits by IDC. We do not winsorize the growth rates for domestic deposits as the time series of domestic deposits does not exhibit extreme outliers. Likewise, we do not winsorize the data series for the independent variables, though some of them indicate substantial differences from normality. For example, the first difference in the Federal Funds rate is highly non-normal, but we choose not to winsorize as its distribution is consistent with economic reality.
Panel B displays the summary statistics associated with the monthly data for TD Ameritrade over the 2009–2020 period with 131 observations. While the period corresponding to the TD Ameritrade data is mainly for the more recent part of the aggregate data, the implied quarterly growth rate in sweeps deposits at 3.9 percent is in line with the aggregate quarterly rate of 3.4 percent. Though not reported in Table 2, the quarterly growth rate for aggregate sweep deposits over the TD Ameritrade data period is roughly similar to the growth rate in the sweep deposits from TD Ameritrade.
Panel C presents summary statistics at the individual bank level. Deposit growth is the percentage change from the previous quarter, while the change () is the first difference from the previous quarter. Similar to the results using the aggregated data (Panel A), the sweep deposits, on average, grew at a quarterly rate of 6.4 percent, which is about three times higher than the growth rate of domestic deposits (2.0 percent). The quarterly standard deviation of sweep deposits (85.7 percent) is far higher than the quarterly standard deviation of domestic deposits (5.7 percent). The high volatility is undoubtedly endogenous as many banks tactically utilize sweep deposits when needed, for example, to supplement other deposits, contributing to frequent jumps from a very low base.
3 Model Specification and Empirical Results
3.1 Empirical Models
The empirical models are
and
where deposit growth is the growth of different deposit types, including domestic deposits, checking and savings deposits, time deposits, sweep deposits, and nonsweep brokered deposits (i.e., brokered deposits minus sweep deposits).21 The important difference between the two models is that the first model is linear, while the second is piecewise linear to allow for an asymmetric relationship between sweep deposits growth and positive versus negative stock returns. Both models are estimated with monthly data for sweep deposits from TD Ameritrade over the period 2009–2020, with quarterly aggregate data for sweep deposits over the period 1984–2020, and with panel data of individual banks for the different types of deposits using quarterly data over the period 1984-2020. Return is the CRSP VW stock return, and X reflects the control variables, including GDP growth, change in the effective Federal Funds rate, and change in investor sentiment. All independent variables are measured in the quarter or month t and t − 1, respectively. We first discuss the empirical results for TD Ameritrade and then turn to those for all banks.
3.2 Sweep Deposits from TD Ameritrade
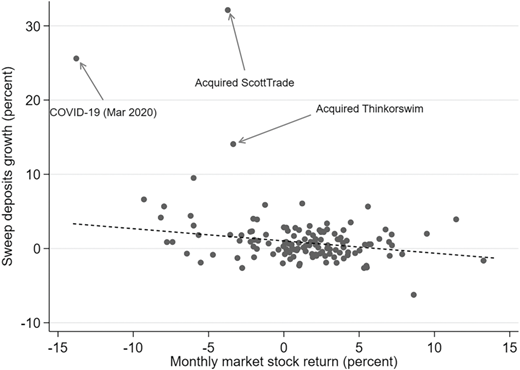
TD Ameritrade, a large brokerage firm, sweeps most of its client cash to TD Bank based on a long-term contractual relationship. Figure 3 displays a scatterplot of the monthly sweep deposits growth rate of TD Ameritrade’s clients and the monthly CRSP VW stock return. The scatterplot illustrates the negative relation between the sweep deposits growth rate and stock market returns. We highlight March 2020, when COVID-19 shook markets, as one of three outliers in the scatterplot. Looking forward, we note that this observation does not drive the significance level of the reported results.
Figure 3 also references two TD Ameritrade acquisitions. TD Ameritrade continued to make large acquisitions following the TD Bank transaction as part of its consolidation strategy, with Thinkorswim in 2009 and ScottTrade in 2017. Clients of Thinkorswim and ScottTrade were converted to the TD Ameritrade platform in January 2010 and February 2018, respectively. Contemporaneous with the conversions, TD Ameritrade began to sweep cash balances held by the former target clients to TD Bank. For both acquisition months, the sweep deposits growth rate for TD Ameritrade was more than ten times the monthly average. As shown, both acquisition conversions occurred during months when the stock market declined. To avoid this artificial bias which strengthens the negative relation between sweep deposits and stock market returns, we remove both observations from all reported analyses.22
Table 3 provides regression estimates where the dependent variable is the monthly sweep deposits growth rate for TD Ameritrade. Columns 1 and 3 include data from November 2009 to September 2020, the entire period for sweep data from TD Ameritrade. We exclude the COVID-19 period in Columns 2 and 4, thus ending the monthly data in February 2020.23We begin by describing the regression results for Column 1. The contemporaneous stock market return coefficient estimate is −0.305 and is highly statistically significant (p-value < 0.001). Thus, a 10.0 percent reduction in the stock market results in a 3.05 percentage point concurrent increase in sweep deposits. When the stock market declines, brokerage clients of TD Ameritrade reduce risk and sell stocks, thereby raising cash, which is swept to TD Bank.
The coefficient estimate is −0.07 and insignificant for the lagged stock market return. We include the lagged stock market return for three reasons. First, we do not have strong priors that investor behavior should fully adjust the risk of their portfolios in the concurrent month, especially if a large market movement occurs near the end of the month. Second, for most stock trades, the settlement occurs two business days after the trade executes, and the cash is swept from the brokerage firm to the bank on the settlement date. Thus, the date on which the sweep deposit occurs could be in the subsequent month after the trade. Third, the TD Ameritrade sweep contract permits TD Bank to stagger the acceptance of large sweep deposits.
We include the three control variables in concurrent and one-month lags. Including the GDP growth rate captures the retail investor response to the overall economy, orthogonal to the stock market effect. The coefficient estimates for the GDP growth rate variable are positive and not significantly different from zero.
We use the first difference in the effective Federal Funds rate as the monetary policy measure.24The coefficient on the change in the Federal Funds rate is highly significant (p-value < 0.001) and negative for the contemporaneous variable, and roughly zero for the lagged variable. A 25 basis-point increase in the change in the Federal Funds rate results in a 3.61 percentage point, or nearly three times, slower growth rate in sweep deposits arranged by TD Ameritrade.25
While our focus is on the stock market relationship with sweep deposits, the economic magnitude of the Federal Funds rate is interesting. Clients at firms such as TD Ameritrade tend to receive low rates on their sweep deposits and are willing to do so for convenience. However, when the Federal Funds rate increases, leading to increases in money market rates, some brokerage clients actively opt to transfer their excess cash into money market funds as implied by the Federal Funds rate variable coefficients. The results are consistent with recent research by Drechsler et al. (2017), who provide support for the deposit channel in the transmission of monetary policy. They find that when the Federal Funds rate increases, banks widen the net interest margin, and consumers respond by moving deposits out of the banking system. We report a much higher response by brokerage customers than detailed in their bank deposits dataset.
We employ the Baker and Wurgler (2006) index to measure investor sen-timent.26Baker and Wurgler find that their measure of investor sentiment is correlated with aggregate market movements: investor sentiment is high during bubble periods and low during crash periods. Given their investor sentiment measure employs several market proxies such as closed-end-fund discounts to reflect primarily retail investor sentiment, it should plausibly influence our sweep deposit rates which directly capture retail investor flows into and out of the stock market. As retail investors become optimistic about the stock market, we expect their cash holdings in brokerage accounts to decline. We observe in Column 1 that the coefficients are negative as predicted for both the current and lagged investor sentiment variable, though not significantly different from zero.27
The Column 2 regression results in Table 3 exclude the COVID-19 months from the analysis, thus ending the data in February 2020. The concurrent stock market return variable increases from −0.305 to −0.187 yet remains highly statistically significant (p-value < 0.001). Given the anecdotal evidence referenced in the Introduction of Charles Schwab raising capital in March 2020 due to its brokerage clients de-risking and converting stock holdings to cash, we expected a smaller coefficient in absolute value. However, the relationship remains strong in both economic and statistical significance.28As regards the contemporaneous and lagged investor sentiment variable, the contemporaneous coefficient is significant with a value of −0.007 (p-value = 0.052).
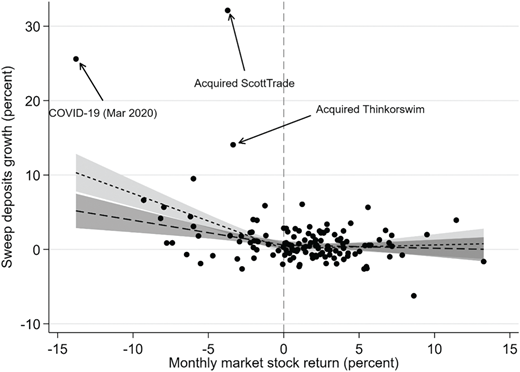
The negative relation between the growth of sweep deposits and the stock market return appears to be predominantly driven by those months in which the market declines. Figure 4 reproduces the scatterplot of Figure 3, excluding the two acquisition-conversion months. Whereas Figure 3 displays the slope from a linear regression model, Figure 4 shows the results from a piecewise linear regression with a stock market return of zero as the breakpoint, highlighting the non-linear response of sweep deposits to the stock market.29
Regarding the Federal Funds rate, its contemporaneous coefficient is sensitive to whether the COVID months at the end of our sample period are included. In particular, in Column 1, the coefficient is significant with a value of −14.454 including the COVID months but becomes insignificant with a value of 1.494 without the COVID months in Column 2. However, the sum of the coefficients when including both the contemporaneous and lagged Federal Funds rates are significant with values of −14.653 and −12.361, respectively. This seems to indicate that absent the Covid months, there is a lag which is not that surprising, especially when using monthly data as investors don’t necessarily respond immediately to Federal Funds rate changes.
Columns 3–4 of Table 3 display the piecewise regression results with a stock market return of zero as the breakpoint, in the same format as Columns 1–2. Our discussion focuses on Column 3, corresponding to the full data sample. The slope coefficient is −0.543 (p-value < 0.001) when the contemporaneous market return is negative, thus close to double the coefficient for the linear model in Column 1. And for those months in which the stock market increases, the slope coefficient is only −0.063 and not significantly different from zero. Overall, these results suggest that, for TD Ameritrade, brokerage clients run to the bank in the form of cash sweeps during market downturns but do not run from the bank to buy stocks when markets increase.30
The results for the Federal Funds rate in Columns 3 and 4 are consistent with those reported in Columns 1 and 2. Also, the same is the case for the investor sentiment variable, being insignificant in Column 3 (Column 1) and significant in Column 4 (Column 2).
3.3 Aggregate Sweep Deposits and Stock Market Returns
The TD Ameritrade data illustrates the strong relationship between sweep deposits and stock market activity. Our rationale for using the data from a single large brokerage firm is not simply due to the monthly level of reporting but more so because we have complete confidence in the data validity. This section assesses whether the findings from the TD Ameritrade analysis generalize to a much larger dataset of sweep deposits estimated on the banking side, albeit with estimation error.
As discussed in the Data section, we obtained the sweep deposits data from IDC Financing Publishing (IDC). IDC employs a proprietary algorithm to estimate sweeps deposits within brokered deposits, which banks report to the Federal Financial Institutions Examination Council (FFIEC) via Call Reports, which are mandated quarterly reports containing detailed accounting, financial, and deposit data for banks. The Call Report data are available quarterly starting in 1984. Our variable of interest is the rate of change in sweep deposits; thus, the first observation for the empirical analysis is the second quarter of 1984 and extends through the third quarter of 2020.
Table 4 displays the regression results for the aggregate sweep deposits of all banks in a similar format to the TD Ameritrade regressions in Table 3. Whereas the full sample period extends to the third quarter of 2020, we exclude the three quarters of 2020 in Columns 2 and 4 to omit the impact of COVID-19. All variables are measured quarterly and in growth rates, except for the Federal Funds rate and the investor sentiment index, which are measured in first differences. We winsorize the sweep deposits growth rates at the 2.5 percent and 97.5 percent confidence levels due to a few extreme outliers, which we think are data estimation errors.
The coefficient estimate for the stock market return in Column 1 is −0.171 percent and significant at the ten percent level. The sum of the contemporaneous and lagged stock market return coefficients is −0.337 and significant (p-value = 0.016). None of the coefficients for the three control variables, including lagged variables, in Column 1 are reliably different from zero. Overall, there appears to be a reliable inverse relationship between stock market returns and aggregate cash sweeps over the 1984-2020 sample period. When we exclude the three COVID-19 quarters from the data, there is no substantial diminishment of the impact of the stock market on aggregate sweeps. Indeed, the coefficients become more economically and statistically significant.
As with the TD Ameritrade analysis, Columns 3−4 of Table 4 display the piecewise regression estimates. Our discussion focuses on Column 3 with the full sample results. Both negative return coefficients are significantly different from zero, with a sum of −0.759 (p-value = 0.0065). In contrast, the sum of the positive return coefficients is only −0.038 and insignificant. We view these results consistent with the “run to the bank” thesis; that is, as stock markets drop, brokerage customers reduce exposure to risky assets and thereby raise cash, which is swept to banks. Notably, like the TD Ameritrade results, the sweep deposits growth rate does not appear to be sensitive to positive stock market returns. And the Column 4 regression estimates are similar to the Column 3 results when coupled with the p-value of the Chi-test (0.3449), indicating that the recent COVID-19 period does not drive the results.31
While it is the case that the TD Ameritrade deposit sweep relationship with the stock market generalizes to the aggregate sweep deposits market with similar size coefficients and significance levels of the primary variables, we note the explanatory power (Table 3, Column 3, R2 = 0.49) of the TD Ameritrade regressions is much higher than for the aggregate sweep deposit regressions (Table 4, Column 3, R2 = 0.08). Our priors were that with a more extended sample and the portfolio effect of averaging over several banks, the empirical results would be stronger for the aggregate sweep dataset than for TD Ameritrade.
A plausible explanation for the lower explanatory power of the aggregate sweep deposits versus the TD Ameritrade data is that the IDC estimates of sweep deposits are subject to measurement error. As described in the Data section, IDC employs a proprietary algorithm to estimate sweep deposits based on various components of brokered and other deposits. We can provide insight into possible IDC measurement error of sweep deposits by comparing the TD Ameritrade quarterly values of sweep deposits to the IDC estimates for TD Bank. Noted earlier, TD Ameritrade sweeps virtually all its client cash deposits to TD Bank. A recent exception is that TD Ameritrade began in 2018 to sweep some of its uninsured deposits to banks other than TD Bank. TD Ameritrade provided us with the sweep allocation data; thus, we can adjust for the relatively small amount of sweep deposits to other banks.32Importantly, TD Bank only accepts sweep deposits from TD Ameritrade. Thus, the TD Bank sweep deposits calculated by IDC should equal the sweep deposits to TD Bank provided by TD Ameritrade.
In terms of levels, the TD Ameritrade quarterly sweep deposits are highly correlated with the TD Bank estimates: the correlation coefficient is 0.98. However, our measure of interest, the growth rate of sweep deposits, exhibits a lower correlation coefficient at 0.70, as noted earlier, suggesting substantial misestimation of sweep deposits by IDC. Similarly, we re-estimate Table 3 for TD Ameritrade but use quarterly data and directly compare the results to the identical regressions using the TD Bank sweep data estimates. For the full model, we note that the explanatory power of the TD Ameritrade regression is 0.72 versus 0.64 for the TD Bank regression, thus giving an indication of the measurement error.33We have no reason to believe that the IDC estimates are biased in any direction, rather just nosy estimates of the actual underlying sweep deposits. However, as discussed below in Section 3.4, the lack of reporting sweep deposits by affiliated banks has a material impact on how sweep deposits affect the response of domestic deposits to stock market movements.
3.4 Deposit Types and the Stock Market
While this paper focuses on sweep deposits, it is important to note whether the findings yield insight into related work on banking deposits in general. The paper most related to our research is by Lin (2020), who documents that slower bank deposit growth is related to stock market booms. Lin’s paper delves beyond the basic relationship between aggregate stock market returns and deposit growth as he focuses on household market participation and deposit growth rate at the county or zip code level. Our extension to total domestic deposits addresses whether the asymmetrical relationship with the stock market return observed for sweep deposits extends to other types of deposits, including checking and savings deposits, time deposits, and non-sweep brokered deposits. This analysis uses a panel dataset so that we can estimate the relationships among different bank deposits and the stock market return, and the comparative role played by sweep deposits, at the bank level.
Table 5 provides regression estimates of the impact of the stock market on the various types of deposits using individual bank-level data. The results are presented in a similar format to Columns 1 and 3 of Table 4 and cover the second quarter of 1984 through the third quarter of 2020. As noted in Table 4 and the accompanying discussion, the COVID-19 period does not materially alter the fullperiod results for aggregate sweep deposits. For the various subsets of deposits analyzed in Table 5 for the panel datasets, we also find that the COVID-19 period does not substantially change the overall findings. Panel A displays the estimates from a linear regression model, while Panel B shows the estimates from a piecewise regression model where the breakpoint is a quarterly zero stock market return. The empirical models include bank fixed effects34 to control for bank-specific characteristics (e.g., connections with brokerage firms). All standard errors are double clustered at the bank and time level.
Column 1 of Panel A displays the estimates for the linear regression model based on the domestic deposit growth rate. As shown, a 10 percent decrease in the stock market return is associated with a 0.10 percentage point increase in the domestic deposits growth rate for the contemporaneous quarter and a 0.27 percentage point increase in the domestic deposits growth rate in the subsequent quarter. As a comparison, the quarterly deposit growth rate is 1.99 percent (Table 2). The sum of the two market return coefficients is −0.037 and statistically significant (p-value = 0.033). Column 2 displays the regression estimates for
checking and savings deposits. The sum of the two market return coefficients is −0.040, but insignificant. The sum of the stock market return coefficients for time deposits (Column 3) is also insignificantly negative, −0.042 (p-value = 0.112). In Column 4, we report the results for sweep deposits. Consistent with our previous results, the stock market return coefficients are significantly negative. A 10 percent decrease in the stock market return is associated with a 2.28 percentage point increase in the sweep deposits growth rate for the contemporaneous quarter and a 0.94 percentage point increase in the sweep deposits growth rate in the subsequent quarter. The sum of the contemporaneous and lagged stock market return coefficients is −0.322, similar to the result in Table 4 using aggregated banklevel data. The last column presents the results for non-sweep brokered deposits(brokered deposits minus sweep deposits), mainly brokered CDs. Like sweep deposits, non-sweep brokered deposits also show a strong negative relationship to the stock market return. The sum of the stock market coefficients is −0.372 and is statistically different from zero (p-value = 0.006). Lin (2020) reports a negative relationship between domestic deposits and the stock market return. Our results suggest that sweep deposits are important contributors to this finding.
As we noted with the TD Ameritrade analysis and the aggregate sweep analysis, the relation between sweep deposits and the stock market is asymmetric, largely only relevant for negative stock markets, and not materially responsive to positive movements in the stock market. Accordingly, Panel B displays the piecewise regression estimates when we investigate whether the asymmetric pattern exhibited with sweep deposits extends to other types of deposits.
Column 1 of Panel B presents the piecewise regression results for total domestic deposits. The sum of the negative market return coefficients is −0.090 (p-value = 0.033). In contrast, the sum of the positive stock market return coefficients is close to zero and positive rather than negative. Thus, the asymmetrical response documented for sweep deposits is also robust when considering total domestic deposits.
Consequently, we suggest an alternative interpretation to Lin (2020) regarding the response of demand deposits to the stock market. According to Lin (2020, p. 31), “. . . stock market booms are associated with slower bank deposit growth due to households’ reduced demand for deposits.” Our analysis suggests a different phenomenon at work: households rush to banks when stock markets decline, but households are not responsive when stock markets increase.
As shown in Column 2, the sum of the estimates of the impact of negative stock market returns on checking and savings deposits, −0.076, is slightly lower than the sum for total domestic deposits. Moreover, the coefficients of positive stock market returns are also negative. Because checking and savings deposits can be withdrawn at any time, individuals tend to spend more when the stock market goes up and less when it goes down. The result for time deposits is presented in Column 3. The negative stock market return coefficients are significantly different from zero, with a sum of −0.113 (p-value = 0.016). In contrast, the sum of the positive stock market return coefficients is positive.
Column 4 presents the estimates from the piecewise regression for sweep deposits, which exhibit a far greater pronounced asymmetrical relation with the stock market return than domestic deposits. The sum of negative stock market return coefficients is −0.456, five times larger than the sum for total domestic deposits.35In Column 5, the result for non-sweep brokered deposits is quite interesting. There is a strong negative relationship between non-sweep brokered deposit growth and positive stock market returns, suggesting that banks receive fewer non-sweep brokered deposits when the stock market is up.
Beyond the stock market return variables, the coefficients for the Federal Funds rate provide information about the interest-rate sensitivity of different deposit categories. Our focus here is to contrast the response of sweep deposits versus other types of deposits to changes in the Federal Funds rate. As indicated in Column 5, sweep deposits decline, albeit with a lag, in response to increases in the Federal Funds rate. As rates increase, brokerage firms receive higher yields for sweep deposits from their counterparty banks, but generally do not pass along the yield increases to their clients. That is, sweep deposits tend to have relatively low deposit betas. Consequently, when rates increase, some brokerage clients find that the cost of convenience increases sufficiently enough to transfer cash out of brokerage accounts and into money market funds and/or short-term Treasury securities. This phenomenon is also at work for liquid checking and savings accounts that also exhibit a high convenience factor.36
Non-sweep brokered deposits, such as brokered CDs, respond the opposite of sweep deposits, increasing in amount due to increases in the Federal Funds rate. The same is true for the relatively illiquid time deposits. As money market rates increase, brokered deposits and time deposits expand due to paying higher rates. The net result for total deposits is an exit from the overall banking system when Federal Funds rates increase, and this is due to the greater proportion of checking and savings deposits versus time deposits.
Overall, the results suggest sweep deposits are the primary driver behind the negative relation between domestic deposits and stock market activity, as Lin (2020) reported. And the negative relation between the stock market and demand deposits is driven by market crashes rather than market booms. Moreover, sweep deposits are substantially underreported by IDC because qualified-affiliate sweep deposits are excluded from brokered deposits in the reporting to the FFIEC. As previously noted, the FDIC indicated in September 2018 that the total amount of sweep deposits from affiliated brokerage firms was $724 billion versus the IDC estimate of $516 billion for sweep deposits from non-affiliated brokerage firms. Thus, at least towards the end of the sample period, the estimated sweep deposits understate the actual sweep deposits by a factor greater than two. Given that affiliate sweep deposits should behave similarly to non-affiliate sweep deposits, the relation between non-sweep deposits and the stock market would diminish considerably further if all sweep deposits were measured as such.
3.5 Event Study Analysis
The primary finding from our research, namely that sweep deposits exhibit significantly high growth rates during stock market declines, also implies that sweep deposits from brokerage firms may play an important role for banks in managing their liquidity risk during stress periods when corporations access liquidity via credit line drawdowns. The question is whether the increase in sweep deposits during periods of market stress reverses quickly when markets rebound. To determine whether this is the case, we perform an event study to examine the dynamic response of sweep deposits growth to negative returns using bank-level data.
The model we estimate is
where eventt is an indicator function equal to one at the time of the event (when the stock market return is equal to or less than a negative 10 percent), and is an indicator equal to one for the following four quarters after the event ( is equal to 1 to 4), sweep deposit share is the amount of sweep deposits held by a bank over its total assets, and λi and δt are bank and time fixed effects, respectively. Standard errors are clustered by bank and time (two-way clustering).
Table 6 presents the results. In Columns 1 and 2, we include bank fixed effects to control for time-invariant bank characteristics; in Columns 3 and 4, we add year fixed effects to control for aggregate macroeconomic shocks, and in Columns 5 and 6, we further include seasonal fixed effects, using quarterly dummies, to account for seasonality. Also, we include a set of control variables used in our earlier analysis in the three even-numbered columns.
The coefficients of the event indicator variable at the time of the initial event in all six columns are positive, and significantly positive in the last four columns. Also, 19 of the 24 post-event coefficients are positive, 12 of which are significant. Only 5 post-event coefficients are negative, and all are insignificant. The positive coefficients indicate the inflow of sweep deposits persists for at least one year.37
Giglio et al.(2021) conducted a large-scale survey of retail investors and found that “[f]ollowing the stock market crash, the average investor turned more pessimistic about the short-run performance of both the stock market and. . . also perceived higher probabilities of both further extreme stock market declines and large declines in short-run real economic activity.” This anecdotal finding is consistent with our results that not only do retail investors rush to cash concurrently with steep market declines, but also that the inflow of sweep deposits does not quickly reverse.
3.6 Sweep Deposits and Bank Assets
We have conjectured that sweep deposits play a growing role in funding bank assets, particularly during stress periods. In this section, we attempt to estimate whether increases in sweep deposits lead to increases in certain types of assets. The analysis includes five types of assets: cash, real estate loans, commercial & industrial loans, agricultural loans, personal loans, and all other assets.38 In addition, we also consider unused loan commitments.
We estimate the following cross-sectional regression
where ΔX t consists of changes in other types of deposit shares, including checking and savings, time, and non-sweep brokered deposits. λi and δt are bank and time fixed effects. The assets and deposits are calculated as percentage shares of total assets. Also, we include the lagged variable Asset sharei,t−1. Standard errors are clustered by bank and time (two-way clustering).
Table 7 displays the empirical results. As shown in Column 1, an increase in the share of sweep deposits results in an increase in the share of cash as part of the overall bank assets. For the four other loan measures, for only agricultural and personal loans we find a significant impact from changes in sweep deposits, albeit with different signs. In the case of agricultural loans, we find a positive relation with additional funding by sweep deposits. According to the Kansas City Federal Reserve, agricultural loans tend to have a short duration of slightly less than one year, so the positive relationship may be reasonable to the extent that additional sweep deposits themselves are short-term.39 Also, there is a negative relation between the share of sweep deposits and the share of personal loans. This category of loans includes automobile loans (with an average term of over five years), (revolving) credit loans, and other consumer loans, which have relatively longer terms than agricultural loans. Moreover, the relationship between the share of all other assets and sweep deposits is significantly negative. Regarding commercial & industrial loans, there is no change associated with increases in sweep deposits, which may be due to confounding events of stock market declines. At the same time, the failure to find an increase in the C&I loan share is inconsistent with sweep deposits funding drawdowns in lines of credit because drawdowns typically increase C&I loans.
Column 7 displays the results for unused corporate loan commitments. Here, we document a significant and negative relationship between the share of sweep deposits and unused loan commitments, which is consistent with the view that sweep deposits may help fund credit line drawdowns. As mentioned earlier, Ivashina and Scharfstein (2010) show that in the aftermath of the failure of Lehman Brothers in 2008, there was a run on banks by corporations that drew down their credit lines.40Likewise, large corporations across the board drew down their credit facilities in March 2020 during the height of the COVID-19 fears when volatility spiked to historical levels.41The inflow of sweep deposits from brokerage firms contributes to the bank deposits available to respond to loan shocks during periods of market stress.42Absent the recent innovation of sweep deposits swept from brokerage firms to banks, client cash would reside on the balance sheets of brokerage firms and invested in short-dated Treasuries and comparable low-risk securities.
We view the results in Table 7 as speculative and thus do not make strong inferences as such. To the extent that sweep deposits are often used to supplement other types of deposits and financings of various loan types, other unknown factors are at play in these regression results. However, the results support the notion that sweep deposits likely play a role in financing loan commitments and providing an additional cash cushion for funding.
3.7 COVID-19, Deposit Inflows, and Drawdowns in Lines of Credit
As noted throughout this paper, sweep deposits experienced an extraordinary surge in growth during the onset of COVID-19 in March 2020. We suggest that sweep deposits can play an important role by increasing bank funds during periods of economic stress when corporations are known to seek liquidity. According to Li et al.(2020a), corporations drew about $480 billion on their lines of credit (LOC) during the end of the first quarter of 2020 and the beginning of the second quarter of 2020.43By comparison, corporations executed drawdowns of less than $100 billion in the aftermath of Lehman Brothers’ 2008 collapse during the Great Recession. Given the unprecedented size of the corporate LOC drawdowns, we examine how much the contemporaneous surge in deposit growth matches the drawdowns.
Panel A of Table 8 displays various measures of deposit growth for the first three quarters of 2020. Total domestic deposits grew at an extraordinary rate of 8.2 percent during the first quarter of 2020 and 8.5 percent during the second quarter of 2020. By comparison, the largest prior quarterly growth rate for domestic deposits was 5.5 percent during the fourth quarter of 1984, more than thirty-five years earlier. Moreover, the cumulative growth rate of 17.4 percent over the first two-quarters of 2020 far exceeds the prior highest two-quarter growth rate of 6.7 percent. These net deposit inflows of $1.1 trillion and $1.2 trillion, respectively, in the first two-quarters of 2020 far exceed the extraordinary LOC drawdowns of nearly $500 billion.
Sweep deposits increased at a rate of 7.9 percent and 5.3 percent, respectively, during the first two quarters of 2020, high growth rates relative to historical growth rates. As discussed earlier, the estimated sweeps from IDC do not include sweeps to banks from brokerage firms that satisfy the “primary purpose” exemption. As noted in the Introduction, Charles Schwab raised capital during March-April 2020 to support the growth in deposits of its banking subsidiary. While Charles Schwab has always been known as a discount brokerage firm, it founded Charles Schwab Bank in 2003 to allow clients to sweep excess cash from their brokerage accounts to the bank. Given the purpose of the bank, the FDIC classifies such sweep deposits as “primary purpose” exempted deposits and thus excluded from brokered deposits.
The inclusion of the exempted sweeps at Charles Schwab has a noticeable impact on the growth rate of total sweep deposits during the COVID-19 period.44The growth rate for sweep deposits (including those classified as primary purpose exempted deposits at Charles Schwab Bank) is 12.9 percent for the first quarter of 2020 and 6.1 percent for the second quarter of 2020. And in terms of magnitude, sweep deposits grew more than $160 billion during the two quarters, with nearly $110 billion in growth during the first quarter alone. Indeed, the growth in “exempted” sweep deposits from Charles Schwab is close to that of the estimated sweep deposits from IDC. We chose Charles Schwab to focus on because its banking subsidiary’s purpose is solely to service its brokerage clients. All deposit flows to the Charles Schwab Bank are sweep deposits. We could do the same exercise for other brokerages, such as E⋆Trade Financial, which has a bank solely to service its brokerage clients. But for other large financial service firms, such as JPMorgan or Bank of America (with its Merrill Lynch brokerage firm), it is difficult to estimate the magnitude of their brokered subsidiary’s “exempted” sweep deposits to their respective banks, given they don’t exist primarily for the benefit of brokerage clients. However, we are confident that their respective brokerages swept extraordinary amounts of cash to their banking affiliates during COVID-19. For example, JPMorgan reported that deposits grew by 19 percent within its wealth-management subsidiary to $169 billion.45 This deposit growth to the banking unit at JPMorgan likely stemmed from the sale of securities, just as the case at Charles Schwab, TD Ameritrade, and several other brokerage firms. Thus, we believe that the estimates of sweep deposits from IDC displayed in Table 8 grossly underestimate the actual amount of sweep deposits.
Unlike total domestic and sweep deposits, Panel A of Table 8 conveys a different pattern for non-sweep brokered deposits. Specifically, during the second and third quarters of 2020, non-sweep brokered deposits declined at double-digit rates. We believe this decline in brokered deposits is endogenous to the extraordinary growth in total domestic deposits. That is, when banks became flush with deposits near the end of the first quarter of 2020, they reduced their reliance in the subsequent two quarters on brokered deposits and such borrowings as Federal Funds purchased and Federal Home Loan Bank loans. At the same time, it might be noted that checking and savings deposits, like sweep deposits, increased, while time deposits, like non-sweep brokered deposits, decreased. During this period of extraordinary uncertainty, investors placed a high value on the convenience of liquid checking and savings deposits versus relatively illiquid time deposits which did not command substantially higher yields, partly due to the near-zero yields on short-term Treasuries.
The empirical evidence in this paper documents a far stronger relationship with sweep deposits than total domestic deposits to market downturns. For example, the negative stock return coefficients for the sweep deposits are more than five times the size of the corresponding coefficients for total domestic deposits. Yet, the deposit growth data from the COVID-19 period show similar growth rates for total domestic and sweep deposits. Panel B of Table 8 displays our estimate for the breakdown of the domestic deposit growth during this period.
The starting point in identifying the sources for the tremendous surge in total domestic deposits of $2.3 trillion is the predicted deposit growth for the first two quarters of 2020 based on ARIMA model estimates over the second quarter of 1984 through the fourth quarter of 2019. The ARIMA model predicts growth of $176 billion for the first quarter of 2020 and $159 billion for the second quarter of 2020, thus total deposit growth over the two-quarters of $335 billion.
We next estimate sweep deposits at contributing $250 billion. This estimate starts with IDC’s $164 billion of estimated sweep deposits plus the primary purpose “exempted” deposits at Charles Schwab Bank. We also referenced the sweep deposits growth at JPMorgan of $27 billion. Our view is that if we could obtain similar estimates from Bank of America (Merrill Lynch), Goldman Sachs, Morgan Stanley, and other financial service firms with banking subsidiaries, the sweep deposits growth would be considerably higher than $191 billion ($164 billion plus $27 billion), or as high as $250 billion.
We earlier referenced the $480 billion estimate of LOC drawdowns over a short period starting in March 2020. As Acharya et al. (2024) show, these drawdowns were not immediately used for investments but increased the various recipients’ liquidity. In this regard, the Office of the Comptroller of the Currency (OCC, 2022, p. 1) states, “. . . large nonfinancial companies that drew down their lines of credit as a precautionary measure initially kept the money in banks that had extended the loans.” And even if any drawdowns were used to cover expenses, for example, they would still end up in bank deposits somewhere. Thus, we assume that the LOC drawdowns contributed $480 billion in bank deposits.46
Our final estimate of a major driver of the huge increase in bank deposits is the Paycheck Protection Program (PPP), which was a part of the Coronavirus Aid, Relief, and Economic Security Act (CARES Act).47According to the Small Business Administration, banks deposited $521 billion in PPP disbursements directly into designated small businesses’ accounts from late March through the end of June 2020 (Anbil et al., 2023). Even for firms that expended the funds quickly, we assume the entire amount stayed in bank accounts rather than marketable securities such as stocks.
The identified drivers can account for over 69 percent of total deposit growth, yet still leave a large gap of $712 billion. Importantly, this residual level of deposit growth, in and of itself, is 5.4 percent, well above historical averages. We believe this residual deposit growth results from cash hoarding by corporations and individuals. As of March 23, 2020, the S&P 500 was down 30.4 percent for the year, and the VIX hit a maximum of 82.7 percent on March 16, 2020. While the S&P 500 rebounded quickly and was even positive for the year by July 2020, we expect the extraordinary stock market turbulence during March 2020 and more cautious spending kept individuals and corporations in cash even after the market began to rebound. More generally, according to the OCC (2022, p. 1), “Near-zero interest rates as well as government transfer payments, including expanded unemployment benefits and checks to individuals, added to deposit growth—as the public, facing rising economic uncertainty, retained the funds in bank accounts.” This level of cash hoarding, notwithstanding the stock market rebound, is consistent with the event-study analysis indicating that the inflow of sweep deposits persists after market declines.
4 Do Sweep Deposits (and Brokered Deposits) Stabilize or Destabilize Banks?
The empirical analyses indicate that sweep deposits covary negatively with the stock market return. Retail investors tend to run to the bank, which takes the form of deposit inflows realized via stock sales when equity markets experience market downturns. In this section, we study sweep deposits’ impact on overall bank deposits’ stability. As noted in the Introduction, regulators have historically held the view that brokered deposits, of which sweep deposits are a major component, can destabilize banks due to their third-party structure. Our conjecture is that sweep deposits are not destabilizing, but perhaps even stabilizing for banks, given the evidence that investors reduce risk by converting stock to cash during periods of high stress.
Our exploration of the impact of sweep deposits on bank deposits’ variability begins with comparing standard deviations and coefficients of variations across various deposit measures. Panel A of Table 9 displays these volatility estimates from 1984–2020 for the quarterly aggregate growth rate measures and converted to annual estimates. Panel B compares the bootstrapped ratios of standard deviations and coefficients of variations for the different types of deposit growth, indicating whether certain types of brokered deposits contribute to stabilizing or destabilizing overall bank deposits.
During 1984–2020, domestic deposits grew 5.28 percent annually, with a standard deviation of 3.31 percent. Compared to other claims on corporate assets, such as equity and debt securities, the 3.31 percent standard deviation for bank deposits is low. As Hanson et al. (2015) explain, with a combination of a costly equity cushion, deposit insurance, and other government protections, bank deposits, in their words, can “remain sleepy” and ignore the volatility of the underlying assets, hence the low volatility for deposit liabilities. In contrast to domestic deposits, Panel A in Table 9 illustrates that brokered deposits and sweep deposits exhibit far higher levels of volatility. For example, the annual volatility of sweep deposits is 18.24 percent, over five times higher than domestic deposits volatility. Similarly, the average growth rate of 12.85 percent for sweep deposits is much higher than for domestic deposits.
An important feature of brokered deposits in general, and sweep deposits, specifically, is that these non-traditional deposit types provide not only additional funding growth for banks but also uncorrelated to low-correlated funding growth. For example, the correlation coefficient between the growth rate of brokered deposits and traditional deposits is −0.047, and the correlation is 0.153 between
sweep deposits and traditional deposits over the same period. The low correlations have the effect of reducing the overall deposit growth rate variability. Notwithstanding their far higher volatility, the addition of brokered deposits, with a standard deviation of 13.32 percent, to traditional deposits, with a standard deviation of 3.37 percent, results in a 1.8 percent decrease in the annual standard deviation of domestic deposits (i.e., combined traditional deposits and brokered deposits) to 3.31 percent, as shown in Panel A of Table 9. This reduction in volatility is largely driven by the sweep deposit component of brokered deposits.
Panel B of Table 9 displays the results of bootstrapped distributions to assess the statistical significance of the impact of brokered deposits and especially sweep deposits on the volatility of bank deposit growth rates. Specifically, we examine the separate effect on the volatility of adding sweep deposits and brokered deposits to traditional deposits via computing the ratio of the volatility of the inclusive deposits sample to that of the traditional deposits sample. We compute 100,000 bootstrap results for each ratio comparison, as described below, for the ratios of the volatilities of the different combinations of deposits displayed in Panel B.
We draw a single observation for a particular type of deposit growth rate at random for the sample. Then with replacement, we repeat the process until we have 146 observations as for the original sample. We then calculate the standard deviation and the coefficient of variation for the bootstrap sample of 146 observations. The final step is to repeat the process 99,999 times, yielding a bootstrapped distribution of 100,000 samples with estimates of the standard deviation and coefficient of variation.
The ratio of the standard deviation of domestic deposits to that of traditional deposits for the bootstrapped distribution is less than one, or 0.984, for the sample period. Thus, the addition of brokered deposits reduces the volatility of domestic deposit growth rates by 1.6 percent, and this decrease is not statistically different from zero. For the coefficient of variation, the ratio of the coefficient of variation of domestic deposits to that of traditional deposits is 0.949; thus, a 5.1 percent decrease that is significant at the 0.05 level.
We document similar results for sweep deposits, finding that sweep deposits reduce the volatility of traditional deposits by 1.1 percent, though this decrease is not statistically different from zero. And the ratio of the coefficient of variation of domestic deposits, which can be viewed as the sum of non-sweep deposits and sweep deposits, to non-sweep deposits is 0.966. Thus, the inclusion of sweep deposits reduces the coefficient of variation by 3.4 percent and is highly significantly different from zero. Moreover, the reduction of the coefficient of variation is due to a reduction in volatility and an increase in the resulting growth rate. Even though the standard deviation of the growth rate of sweep deposits is several times higher than that for traditional deposits, the low correlation, as pointed out earlier, results in reducing the standard deviation of domestic deposits.
Notwithstanding the historical concern by regulators about the lack of stability of brokered deposits, our evidence does not indicate an increase in overall deposit volatility due to the addition of brokered deposits or sweep deposits insofar as the volatility ratios are not significantly greater than one. While the 1.1 percent decrease in deposit volatility is not large in magnitude, it is important to point out that the proportion of sweep deposits to traditional deposits over the 19842020 period is only 2.7 percent. However, as noted earlier, sweep deposits are underestimated by a magnitude of up to two due to the exclusion of sweep deposits by qualified affiliates from the calculation of brokered deposits. Because we expect qualified sweep deposits to behave similarly to non-qualified sweep deposits, we believe that if we could account for the qualified sweep deposits, the resulting decrease in overall deposit variability would be even greater and at higher statistical significance.
Furthermore, when one examines the more recent period 2000–2020, brokered and sweep deposits were a much greater proportion of domestic deposits at 7.5 percent and 4.2 percent, respectively, as compared to 2.4 percent and 0.8 percent for the earlier period 1984–1999. Suppose one focuses only on the 2000-2020 period. In that case, the reduction in the standard deviation of domestic deposits is 3.8 percent due to brokered deposits (though not statistically different from zero) and 3.5 percent due to sweep deposits (and statistically different from zero at the 0.05 level), without accounting for the affiliate sweeps which are now greater than non-affiliate sweeps. In terms of the coefficient of variation, the reduction is 6.8 percent due to brokered deposits and 6.2 percent due to sweep deposits, with both being statistically different from zero at the 0.05 and 0.01 levels, respectively. The magnitude of these reductions is far greater than that illustrated in Table 9, and we conjecture that if accounting for the non-reported qualified sweeps, the reduction in the coefficient of variation would likely approach ten percent.48
These results for sweep deposits and other brokered deposits imply that, at least in aggregate, such deposits are not necessarily destabilizing but rather stabilizing.49This finding is important because the FDIC, along with the Board of Governors of the Federal Reserve System and the Office of the Comptroller of the Currency, revised the Call Reports to report data on sweep deposits as of the third quarter of 2021 (FDIC, 2021a). This should help in evaluating the funding stability of sweep deposits over time.
5 Concluding Remarks
The stock market has experienced numerous significant downturns, with one of the most significant and recent declines occurring in early 2020 due to the COVID-19 pandemic. When these disruptive events occur, retail investors reduce risk and sell stocks, with the proceeds channeled to safer investments, including federally insured bank deposits. As far as we are aware, there has been no study of the role of brokerage firms in serving as intermediaries in channeling funds from stock investors to banks at times when financial markets are under stress. The primary reason for this gap in the banking literature is a lack of data. However, despite the lack of publicly available information, we have gained access to actual data on sweep deposits for TD Ameritrade and its affiliated banks. Also, we obtain estimates of sweep deposits data for every bank from IDC, and to our knowledge, we are the first researchers to utilize the IDC sweeps data.
Our empirical analysis uncovers a robust and negative relation between stock market returns and sweep deposits of customers at TD Ameritrade. More specifically, based on piecewise linear regression results, we find that sweep deposits growth at program banks of TD Ameritrade is significantly related to stock returns when they are negative, but not when the stock returns are positive. This finding indicates that there is an asymmetric relationship between sweep deposits growth and stock returns. We view this result as consistent with the “run to the bank” thesis; as stock markets drop, brokerage customers reduce exposure to risky assets and thereby raise cash, which is swept to banks.
We also find a significant inverse relationship between stock market returns and cash sweeps when using both aggregate and individual bank data. Indeed, the stock-return coefficients for the sweep deposits results are over five times that for the results of domestic deposits. Intuitively, to the extent that investors reduce exposure to the stock market during stress periods, the reduction is magnified regarding sweep deposits due to their origin, namely, brokerage accounts. Overall, the results suggest that sweep deposits are an important driver behind the relation between domestic deposits and stock market activity, a previously unexplored finding. Importantly, we find a different phenomenon at work than Lin (2020), namely that households rush to banks when stock markets drop, yet are not responsive to increases in the stock market, as he concludes.
In addition, while regulators have been concerned about the lack of stability of brokered deposits as a funding source for several decades, we find that brokered deposits do not increase the overall deposit volatility. Indeed, despite their high volatility, the addition of sweep deposits appears to stabilize rather than destabilize traditional deposits. Thus, from a policy standpoint, this finding may be informative, and further help evaluate the funding stability of sweep deposits.50
The relatively recent innovation of bank sweeps not only provides a growing and diversified funding source for banks as an alternative to branch networks, but critically, during periods where banks are subject to bank runs by borrowers looking to draw down their lines of credit. It would be interesting to see on a cross-sectional basis whether banks with relatively high exposures to credit line drawdowns are more likely to use brokered deposits, and in particular sweep deposits, as an alternative funding source.
While the focus has been on the impact of funds flowing from brokerage firms to banks via sweep deposits, the empirical results suggest further investigation into the behavioral aspects of the flows might be fruitful. One question is, why do households appear to be net sellers of stocks during severe market downturns? A simple risk-based explanation would be that households target a constant risk portfolio and thus seek to rebalance in part from stocks to deposits when equity risk increases. But the question then arises why households would target a constant risk portfolio. Alternatively, a common story in the financial press is that households often tend to flee the stock market sub-optimally when expected returns increase. In this case, institutions and the underlying corporate issuers opportunistically increase market exposure during these stressful periods.51The bottom line is that a better understanding of the reallocation of securities around market downturns arguably will yield greater insight into investor behavior.52
Appendix
Charles Schwab followed up in April 2020 with a $2.5 billion preferred stock issue to provide additional capital to its banking subsidiaries. Due to bank capital requirements, a large, unexpected increase in deposits typically requires additional equity. In the case of Charles Schwab, the company meets the requirement for additional capital via moving funds from the holding company to its banking subsidiaries in the form of equity capital. Thus, even though banks may carry equity cushions to satisfy new net deposits, during certain stress environments these cushions may not be sufficient, thereby raising the need for additional equity injections.
According to the FDIC (2011, p. 48), for sweeps and referrals from affiliates, data are either incomplete or nonexistent. The FDIC recently began reporting sweep deposit data but only starting in 2021.
See for example, Barth et al. (1990, p. 739) who state, “. . .severely troubled institutions held more direct investments and relied to a much greater extent on brokered deposits ........”
Also, see related empirical support by Gatev and Strahan (2006). As noted by Pennacchi (2006), investors did not consider deposits a safe haven during times of financial stress prior to the creation of the FDIC.
The settlement period switched from three trading days to two trading days in 2017, and from five trading days to three trading days in 1995.
Indeed, the brokerage firm tends to receive the cash immediately and begins using it, with certain restrictions, even before the trade settles and the customer receives credit for the cash.
Clients of brokerage firms are protected by the Securities Investor Protection Corporation (SIPC) if their brokerage firm fails. The protection covers the securities and the cash in the brokerage account up to a total of $500,000, and the cash portion is covered up to $250,000.
Some brokerage firms such as Fidelity and Vanguard also sweep client cash into one of their money-market funds as well as to an unaffiliated program bank. They will generally give the option as to where to sweep the cash to the client. However, most brokerage firms do not provide a money market fund as a sweep option, rather a money market fund is treated just like any other mutual fund. These firms include Charles Schwab, E-Trade Financial, Edward Jones Bank of America Merrill Lynch, Morgan Stanley, and TD Ameritrade. While investing in the money market fund offers a higher yield, the client has to treat the money market fund like any stock or fund and thus must sell the money market fund, for example, to raise cash for stock trades.
Notably, the sweep deposits from TD Ameritrade account for over 40 percent of the domestic deposits of TD Bank, making TD Bank the tenth-largest bank based on assets in the U.S., as of 2020.
Traditional deposits are all types of deposits, including checking and savings deposits, and time deposits, which are made directly by the account owner, whether at a branch bank, an ATM, or online via a mobile deposit. And as mentioned below, certain affiliate sweep deposits are also included in traditional deposits.
On February 3, 2005, the FDIC decided that for a firm when the “primary purpose” of its sweep deposits program is to facilitate its clients’ purchase and sale of securities, not to provide them with a deposit-placement service, the sweep deposits are not classified as brokered deposits.
Indeed, according to the FDIC (2021b, p. 6742), “. . . banks are increasingly relying on new technologies to engage and interact with their customers, and it appears that this trend will continue.”
According to Acharya and Mora (2015, pp. 3 and 5), in 2008, “. . . the mechanism whereby the banking system as a whole provides backup liquidity to the market by experiencing deposit inflows broke down. This crisis was in fact a crisis of banks as liquidity providers in the aggregate; and not just of the weakest banks [T]he crisis particularly hit banks exposed to drawdowns of commitments and credit lines. . . These banks . . . were more likely to seek expensive brokered deposits.”
Note that the brokerage firms don’t pass these higher rates on to their clients per se, rather it allows them to offer commissions at roughly zero prices, etc. Due to the relatively higher rates generated from sweep deposits, brokerage firms in today’s market direct most of customer cash to banks and receive FDIC protection rather than investing directly themselves in short-term Treasury securities per SEC Rule 15c3-3.
As of July 2017, several restrictions were placed on brokered deposits: (1) well-capitalized banks may accept brokered deposits at any time and pay any rate on those deposits; (2) adequately capitalized banks may accept brokered deposits if they obtain a waiver from the FDIC and pay a rate on the deposits that doesn’t exceed the “national rate” plus 75 basis points; and (3) undercapitalized banks may not accept brokered deposits (Barth et al., 2020).
An important example is that of Charles Schwab, which as of March 2020 had roughly $247.4 billion in domestic deposits, yet IDC indicates bank sweep deposits of only $16.1 billion. Due to the exempt ruling by the FDIC, Charles Schwab was not required to treat nearly its entire bank sweeps as brokered deposits even though nearly all the cash at Charles Schwab Bank originates at the broker dealer.
While TD Ameritrade has sweep data on a daily basis, they provided it at the monthly level only.
Note that the starting point for the deposit levels is the first quarter of 1984, and thus, our return metric starts in the second quarter of 1984.
We end the IDC data series as of the third quarter of 2020 to coincide with the end of the TD Ameritrade data series.
Note that while the winsorizing modestly reduces the standard errors associated with some of the regression coefficients, this process does not materially alter the coefficient estimates or any of the conclusions reached.
Empirical model (1) is similar to Lin (2020) with a few distinctions. However, empirical model (2) is quite different and the main focus of our study. We will subsequently contrast our results with that of Lin.
We noted earlier that we winsorize the aggregate sweep growth rates due to a concern of extreme outliers caused by IDC estimation errors. However, we do not winsorize the TD Ameritrade sweep growth rates as we have sufficient information about the outliers and thus eliminate observations from the regression model where justified. Moreover, we are not concerned about the estimation error of the TD Ameritrade sweep deposits as they are subject to rigorous internal and external auditing controls.
TD Ameritrade, like other brokerage firms of which we are aware of, does not report monthly sweep data in their quarterly and annual filings. Rather, they tend to report either average sweep balances over the quarter or end-of-quarter sweep balances, and not always in a consistent manner. While TD Ameritrade commenced its bank sweep program at the end of 2006 with TD Bank, the company was unable to provide us with comparable monthly data during the three-year period leading up to October 2009.
The average monthly change (in absolute value) over the months corresponding to the TD Ameritrade data is only four basis points.
Instead of simply taking the change in the Baker and Wurgler investor sentiment index, we follow the prescription in Baker and Wurgler (2007) and create a new index by taking the first principal component of the six proxies underlying their index. We also note that their series does not extend beyond 2018 and thus we supplement with a comparable series from the American Association of Individual Investors.
Note that we are strictly employing investor sentiment as a control variable rather than a focus variable of interest. It is possible that the lack of statistical significance is due to the timing of the relationship between sentiment and sweep growth rates as we only include the contemporaneous and lagged monthly measures. Note that for some of the empirical models we employ, the coefficients are significant for the investor sentiment variable.
Note, using the Newey-West estimator to address autocorrelation and heteroskedasticity in the error terms does not diminish the significance level of the results.
The zero breakpoint is chosen to examine the relationship over two regimes, one with positive and the other with negative stock returns. Also, note that for both figures, the fitted regression line is for the current month only, thus excluding the lagged month.
As we noted earlier, while the TD Ameritrade sweep program commenced in 2006, the official data series did not begin until 2009. However, when the S&P 500 declined nearly 30 percent during the September-November 2008 period, per conversations with senior finance personnel of TD Ameritrade, clients sold stock and converted to cash on a level similar to that during COVID-19.
Also, we included the sweep deposits over total assets from the previous quarter as an explanatory variable in all our basic regressions and the basic results remain unchanged.
The original 2006 agreement, as amended and extended various times over the years, permits TD Ameritrade to sweep uninsured cash balances to banks other than TD Bank. For example, a client with $1 million in cash would only be insured for $500,000, that is, $250,000 from each of the two TD Bank charters. In 2018, TD Ameritrade began to sweep uninsured deposits away from TD Bank, which amount to less than 10 percent of its total cash balances. In our comparisons to the IDC data which estimates TD Bank sweep deposits, we include only the TD Ameritrade cash balances that are swept to deposits at TD Bank.
We report these results in the Appendix.
We do not include time fixed effects because all the control variables are the same for all banks.
However, when we focus on only banks with assets greater than $1 billion, the sum of the negative stock market return coefficients roughly doubles to −0.911 and the p-value is 0.023. In addition, we find the contemporaneous negative stock market return coefficient also roughly doubles to −0.603 and is now statistically significant.
As previously mentioned, see Drechsler et al. (2017) for an insightful discussion of deposit spread betas across banks.
Also, when we perform a F-test on the sum of the event coefficients (separately for all five event variables and the four post-event variables), the results indicate the sum is positive in all columns and significant in Columns 1, 3, 4, 5 and 6.
The shares of the assets examined add to 100 percent.
National Survey of Terms of Lending to Farmers,https://www.kansascityfed.org/agriculture/agfinance-updates/.
Note that like us Ivashina and Scharfstein (2010, p. 320) state “. . .we do not directly observe credit-line drawdowns.”
“Coronavirus-related Revolving Credit Drawdowns Grow to $222B via 414 Issuers,” S&P Global Market Intelligence, April 14, 2020.
According to Berrospide and Meisenzahl (2022, p. 332), “Credit line availability is based on contractual clauses and is reported to the best of our knowledge only in regulatory filings.” Such filings only provide limited data on LOC drawdowns for bigger bank holding companies and are available in Schedule H.1 of the Federal Reserve’s Y-14Q starting in Fall 2011. However, the data are confidential supervisory data and therefore not publicly available. This feature prevented us from exploring the relation between drawdowns in lines of credit and sweep deposits.
Acharya et al. (2024) document that publicly traded corporations drew down $225 billion on their bank lines of credit.
The data sources are 10Ks and 10Qs from Charles Schwab Corporation with the item “deposits swept from brokerage account.” We then subtract from the total amount of sweep deposits obtained the estimates from the IDC sweep data for the Charles Schwab Bank. That is, the brokerage arm does not sweep 100 percent of customer cash to the Charles Schwab Bank as a small amount is swept to other banks and thus does not qualify as primary purpose deposits.
However, we are unable to produce this data series for an extended period.
When corporations draw down their credit lines, especially if for potential emergency use, they generally maintain the cash with the banking syndicate rather than to invest in short-term Treasuries or related securities.
The CARES Act was a $2.3 trillion relief package that targeted households, businesses (including PPP) and other groups such as health providers and states that collectively contributed to increases in deposits (seehttps://www.crfb.org/blogs/visualization-cares-act, accessed February 22, 2022).
The results for the period 2000–2020 are reported in the Appendix.
At the individual bank level, however, there are certainly times and cases where brokered deposits can be problematic. Indeed, according to the FDIC (2021b, p. 6762), “[h]istorical experience has been that higher use of deposits currently reported to the FDIC as brokered has been associated with higher probability of bank failure and higher DIF [deposit insurance fund] loss rates.”
Indeed, in conversations with senior executives of banks that are obligated to accept sweep deposits, they actually view the run to the bank as a risk if forced to substantially increase equity capital due to the additional deposits, especially if forced to do so at an inopportune time of high market uncertainty. We note that the regulators appreciated this concern during the COVID-19 crisis and relaxed lending limits, capital, and liquidity rules, including community bank leverage ratios, supplementary leverage ratios (SLRs), capital and liquidity buffers and total loss absorbing capacity (TLAC).
Institutions are largely funding directly out of Treasuries or indirectly via money market funds, and thus the sweep deposit channel is primarily driven by retail investors or small institutions representing retail investors such as registered investment advisors.
In this regard, see Hirshleifer (2015), for an excellent discussion of the importance of behavioral finance and the need to move to social finance to better understand how financial decisions form and spread.