


This study aims to investigate the state-of-the-art in economic sustainability (EcS) and social sustainability (ScS) of prefabricated construction (PFC), addressing gaps in holistic life cycle perspectives.
A bibliometric analysis and a content-based critical review were used to synthesise literature on EcS and ScS of PFC.
Results reveal that life cycle sustainability assessment (LCSA), social life cycle assessment and additive manufacturing are emerging themes. EcS is more extensively researched than ScS, with developed regions dominating case studies. While PFC marginally outperforms conventional methods in most EcS and ScS evaluations, critical gaps persist in indicator diversity, stakeholder representation and data availability. Challenges related to methodological immaturity and data availability are discussed in depth, leading to an improvement strategy framework proposal. The discussion emphasises how holistic sustainability assessments, circular economy (CE) principles and alignment with sustainable development goals (SDGs) can position PFC as a driver for sustainable urban development. A future research agenda should prioritise methodological advancements, case-specific studies (e.g. CE), LCSA and SDG-aligned policies and decision support systems to enhance sustainability decision-making in PFC.
Although environmental sustainability in PFC is well-examined, economic and social dimensions remain underexplored. A holistic life cycle approach that integrates CE principles and SDGs can better reveal performance, assessment methods, system boundaries and gaps, ultimately driving global sustainable development, construction innovation and technological progress.
1. Introduction
Prefabricated construction (PFC) is an advanced construction method in which building components are manufactured at an off-site manufacturing facility and assembled at the construction site to complete the installation (Peiris et al., 2023). Typically, PFC approaches can be classified into three sub-divisions: non-volumetric (beams, columns and panelised systems), volumetric (modular units comprising elements such as wall panels, floor and ceiling) and hybrid systems (combination of non-volumetric and volumetric units) (Wong and Loo, 2022; Harrison, 2018). PFC allows simultaneous project work both in in situ (such as site preparation and foundation) and off-site environments. On top of that, the operations at a controlled manufacturing base in PFC present a series of competitive advantages compared to fully in situ traditional construction (TC) practices. The potential engagement of advanced machinery and manufacturing technologies often emphasises improved standardisation and efficiency of the produced prefabricated elements (Yin et al., 2019). Moreover, factory-based production increases quality control and worker safety and minimises weather-related risks, thus, reaching faster project deliveries (Ismail et al., 2022). Furthermore, reduced overall construction costs, heightened waste control and the potential for adopting CE strategies are well-known sustainability benefits of PFC (Hammad et al., 2019; Minunno et al., 2020).
The assessments investigating the comparative life cycle sustainability performance of PFC technologies over TC are critical to formulating continuously improved solutions. The general notion of sustainability consists of a triple bottom line (environmental, economic and social) that targets the planet, profit and people, respectively. Comparatively, the research related to the environmental performance of PFC has been explored extensively in the relevant literature by comprehensive review studies (Kamali and Hewage, 2016; Jin et al., 2020; Jayawardana et al., 2023a, 2023b, 2023c). However, a deficiency exists with adequate review work on research studies on the life cycle economic sustainability (EcS) and social sustainability (ScS) aspects of PFC (López-Guerrero et al., 2022). Multiple state-of-the-art research elements in EcS and ScS of PFC still need to be covered in-depth to motivate future investigations in the broader spectrum. The EcS and ScS pillars are imperative to understanding and describing the holistic sustainability of prefabrication and estimating the contributions to the global sustainable construction and SDGs.
An initial review of the relevant literature highlights several ambiguities in key research questions (RQs), including but not limited to: the core sources, documents, key research themes, emerging trends in EcS and ScS of PFC (RQ1); the life cycle EcS and ScS performance of PFC projects in developed and developing economies (RQ2); assessment methodologies used to evaluate EcS and ScS of PFC (RQ3); barriers for life cycle EcS and ScS assessments in PFC projects (RQ4); strategies for effective evaluation of EcS and ScS of PFC (RQ5); and holistic LCSA in PFC to enhance sustainability and drive CE and support SDGs (RQ6); future research directions for EcS and ScS of PFC (RQ7). Thus, the current review study aims to systematically assess the available literature structured around the above research questions. A systematic review encompasses a quantitative approach (bibliometric analysis) and a qualitative method (critical discussion) to interpret the relevant domain knowledge and facilitate research outcomes through challenges and future directions. The findings help global construction industry practitioners gain a deeper understanding of the life cycle EcS and ScS assessment and performance of PFC, promoting a holistic approach to CE and SDGs for sustainable development and construction innovation.
2. Research methodology
The systematic literature review adopted in the current research comprises data collection, bibliometric mapping and a qualitative critical discussion, as shown in Figure 1. The quality of the final outcomes of a review study depends on the comprehensiveness and reliability of the input data sample (i.e. scientific articles). Hence, the current research closely followed a systematic search protocol to facilitate data collection. The initial literature review assisted in identifying the interchangeable terms for the primary keywords, “prefabricated construction”, “economic sustainability” and “social sustainability”. The “AND” and “OR” Boolean operators were used to form relevant query sub-clusters in the search (refer to Table S.1). In the current study, the Scopus database was used as it indexes leading journals in the construction subject domain and covers a wide range of peer-reviewed journals (Hu and Chong, 2019; Yin et al., 2019).
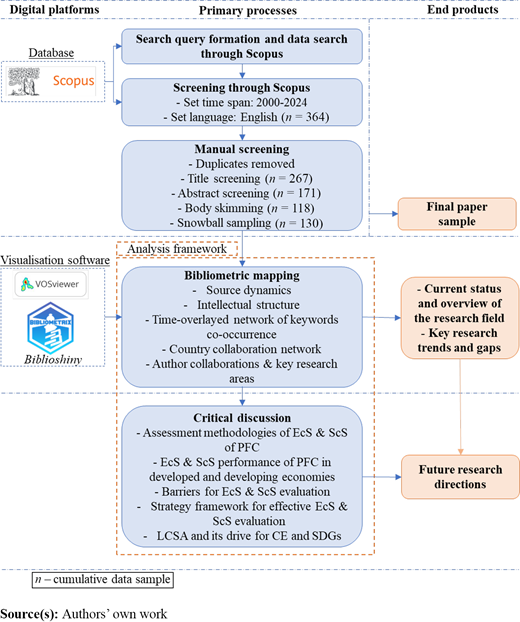
The keyword search field in Scopus was set as title–abstract–keywords. The search command was restricted to choosing articles, reviews, conference papers and book chapters written in English. Successively, the time span was set from January 2000 to May 2024. This period was considered appropriate considering the modern development period of PFC and the increased integration of the sustainability paradigm in prefabrication research. A subsequent manual screening process was conducted to remove duplicates and exclude irrelevant documents from the review scope by title, abstract and content screening. A snowball sampling method through the reference list was conducted to identify relevant articles that may not have been found through the search string. A total of 130 documents were selected based on both quantitative and qualitative aspects of the EcS and ScS of PFC. The selection can be justified considering the less research conducted on the considered subject scope and to have a rich and extended discussion on the research topics.
Bibliometric mapping is a statistics-based quantitative approach that aims at visualising the structural and dynamic connections of a scientific research domain (Cobo et al., 2011). The current review used VOSviewer, a desktop software tool for visualising bibliometric networks and Biblioshiny, a Web-based application, which uses bibliometrix R-package in a local R environment to create the science maps (Van Eck and Waltman, 2010; Aria and Cuccurullo, 2017). The Scopus meta-data file with bibliometric data is loaded into these platforms to generate the bibliometric maps presented in Figure 1. The unique visualisation strengths of the two tools were considered in the mapping process. VOSviewer is used to create the time-overlayed network of keywords and country collaboration network. VOSviewer allows merging keywords in singular and plural form or with or without a hyphen using a thesaurus file. The source dynamics, intellectual structure and author collaboration network are generated using Biblioshiny. Bibliometric mapping identifies the current status and creates an overview of the research field of interest.
Subsequently, the critical discussion facilitates an in-depth review and deeper insights related to the key questions in the review scope. The articles are carefully reviewed and selected from the primary sample to draw the essential contents and derive the relevant outcomes of the critical discussion. For example, in determining the EcS and ScS performance of PFC projects in developed and developing regions, the studies that comprise case studies are selected. Similarly, the papers were chosen for other research questions, except for developing the strategy framework for effectively evaluating EcS and ScS in PFC. For this purpose, the articles with insights from the sustainability assessment of other industry sectors (e.g. the manufacturing industry) are considered. The selection of the manufacturing industry is logical, considering that prefabrication occurs in a production environment.
3. Bibliometric mapping results
3.1 Annual production and source dynamics
The annual production data of the relevant research space showed that around 90% of the research work was published in the last decade. The introduction of the 2030 Agenda for Sustainable Development in the United Nations (UN) General Assembly conducted in 2015 is a crucial milestone that influenced increased requirements for performing construction projects conforming to sustainability standards (Resolution, 2015). Since the prefabrication approach is receiving increased attention and investments considering the potential due to advanced technology integration and positive stakeholder perceptions (Thai et al., 2020). Furthermore, the 2030 Agenda triggered a global trend for conducting sustainability assessments to benchmark, monitor and improve construction processes. Considering EcS and ScS of PFC research, about 70% of studies were published in the last half-decade. Thus, this period marks the prominent stage of EcS and ScS of PFC research. Hence, it is crucial to analyse the findings of the previous studies in this research field to identify trends and gaps and understand future directions.
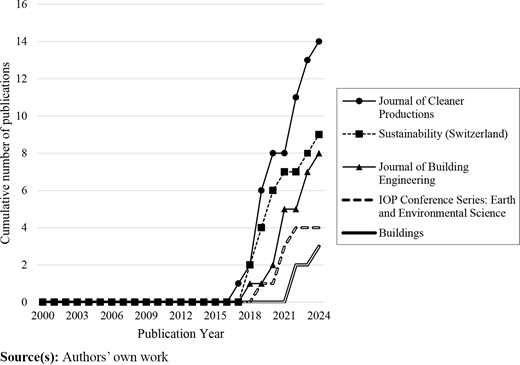
The source dynamics analysis is vital to identify the publishing sources that include the relevant and impactful articles associated with the EcS and ScS themes of PFC. The 130 papers selected for the bibliometric mapping belong to a total of 82 publication sources. The top publishing sources covering the research in EcS and ScS of PFC are illustrated in Figure 2 with the registered cumulative annual publications. Notably, the publications started around the mid of 2010s in all top five sources. “Journal of Cleaner Production” was the source with the highest published work (n = 14) in the field of interest. “Sustainability” ranked second in cumulative publications (n = 9), closely followed by the “Journal of Building Engineering” (n = 8). “Journal of Cleaner Production” and “Sustainability” support multidisciplinary research, creating a wide-scoped platform for sustainability research in construction engineering applications. The fourth most productive source is a conference proceeding series (“IOP Conference Series: Earth And Environmental Science”), which publishes papers presented in civil engineering and environmental sciences-related conferences. The fifth-ranked, “Buildings”, similar to “Journal of Building Engineering”, covers building-related construction research.
3.2 Intellectual structure
Co-citation analysis uses co-citation counts to map the intellectual structure of a research field by linking units of analysis (such as documents) based on their simultaneous appearance in the reference lists of other documents (Zupic and Čater, 2015). This method helps identify highly influential publications within a specific domain (Díez-Martín et al., 2020). A higher frequency of co-citations suggests a strong likelihood that each document is also highly cited individually, indicating their significant impact on the research field (Zupic and Čater, 2015). The document intellectual network (Figure 3) reveals that the most significant documents in EcS–ScS–PFC literature, based on co-citation frequencies, can be grouped into five distinct clusters. The supplementary material provides the front-line studies list (Table S.2). Each co-citation cluster represents a specific thematic research domain. A higher betweenness centrality suggests researchers view a document as a key intellectual resource. In social network theory, nodes with betweenness centrality above 0.10 serve as bridges, linking network clusters (Díez-Martín et al., 2020). The EcS–ScS–PFC literature includes 29 research documents that form the intellectual foundation of this domain.
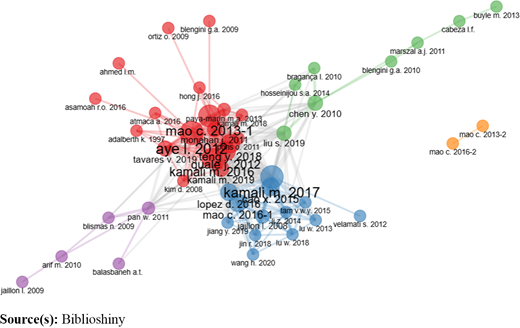
The red cluster (Cluster 1) represents front-line research comparing the “life cycle environmental performance of PFC with TC using environmental LCA (ELCA)”. Studies in this cluster emphasise the potential of PFC to reduce carbon emissions and enhance energy efficiency and recycling potential across the building life cycle (Aye et al., 2012; Mao et al., 2013; Kamali et al., 2019). Moreover, this research work provided rigorous methodologies and benchmarks through ELCA. Cluster 1’s life cycle assessment (LCA)-driven environmental findings have become a foundation for interdisciplinary sustainability research, enabling economic and social studies to define their scope, adopt rigorous methodologies and align with global sustainability agendas. For instance, economic analyses adopt Cluster 1’s system boundaries (e.g. cradle-to-gate) to align environmental and economic evaluations, enabling hybrid assessments that justify PFC’s higher initial investment through life cycle savings. Cluster 2 (blue) bridges environmental sustainability with economic and strategic considerations, addressing barriers and opportunities in PFC adoption (Lopez and Froese, 2016; Tam et al., 2015). Cluster 2 reflects its alignment with front-line research on holistic sustainability, where economic viability and stakeholder engagement are as critical as environmental metrics.
Cluster 3 (Green) focuses on “frameworks for life cycle sustainability evaluation in PFC building design and construction”. Chen et al. (2010) developed a stakeholder-driven framework with 33 criteria across economic, social and environmental dimensions for construction method selection in concrete buildings. Furthermore, Liu and Qian (2019a) developed a stakeholder-based S-LCA framework for buildings, integrating quantitative and semi-quantitative indicators with analytic hierarchy process (AHP) weighting to compare PFC and TC. Cluster 4 (purple) examines “global challenges and regional strategies in PFC adoption” (Blismas and Wakefield, 2009; Arif and Egbu, 2010; Pan and Sidwell, 2011). Cluster 4 studies have been a critical reference for policymakers and practitioners seeking region-specific strategies, emphasising the need for adaptable solutions for PFC in diverse markets. Cluster 5 evaluates the “sustainability and efficiency in PFC by environmental impact and cost analysis” through case studies (Mao et al., 2013; Mao et al., 2016).
3.3 Conceptual structure
The author keywords of the research articles can be used to develop bibliometric maps to understand the core topics, patterns, relationships and emerging research themes. The VOSviewer network visualisation was used to generate the research clusters by setting the parameters such as minimum number of occurrences of a keyword as 2, minimum cluster size and clustering resolution as 6 and 1.0, respectively. Moreover, a text file (tab-delimited) was uploaded in the step “choose the type of analysis and counting method” to merge terms such as “life-cycle costing” and “life cycle costing”, as described in the methodology section. Figure 4 depicts the keyword co-occurrence relationship integrated with the temporal behaviour. In the network, each circular node corresponds to a keyword, and its size denotes the number of keyword occurrences. The line thickness between nodes represents the co-occurrence frequency. Furthermore, the colour spectrum indicates the average publication year of each keyword. The nodes with yellow colour are the most recent author keywords in the research domain, whereas the purple colour nodes represent relatively older keywords.
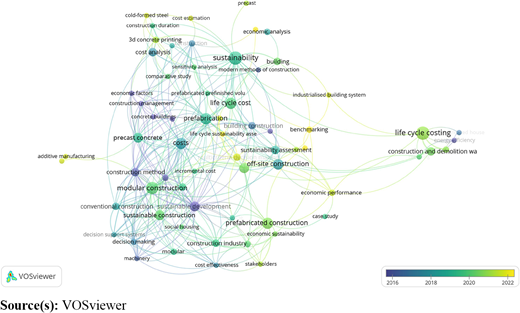
The nodes “sustainability”, “life cycle costing”, “modular construction”, “prefabrication” and “costs” have the highest number of occurrences (13, 13, 11, 9, 9, respectively), which signify the relevance to the review scope. “Sustainable development” and “construction method” show the maximum co-occurrence strength, which indicates the importance of the construction method to support global sustainable development. The number of occurrences and total link strength of the top 15 keywords are presented in Table S.3 (in supplementary materials). Total link strength is the aggregated co-occurrences of a keyword. The time overlay mapping outcomes depict that earlier research concentrated on “economic factors” and “cost analysis” related to EcS of PFC. Subsequently, the research evolved into considering indicators such as “productivity” and “construction duration” and technologies such as “building information modelling” in EcS of the PFC research paradigm. Topics such as “life cycle sustainability assessment” (LCSA), “social life cycle assessment” (S-LCA), “3d concrete printing” and “additive manufacturing” are recently emerging relating to both EcS and ScS of PFC subject domains.
The overlay network visualisation assisted the bibliometric mapping process in identifying the most relevant and influential keywords and the impact of time on the evolution of conceptual themes. Subsequently, a manual full-text literature analysis is conducted to cluster the keywords into meaningful and relevant seven topic areas, as shown in Figure 5. Topic Area 1 represents three aspects of PFC. The first sub-cluster denoted different terminologies for PFC used in different geographical regions and application contexts (Cao et al., 2015). “Prefabricated construction” itself, “off-site construction”, “prefabrication” and “industrial building systems” are the most practising interchangeable terms for PFC. The second sub-cluster comprises the most common types of PFC. “Modular integrated construction” or “modular construction” manufactures three-dimensional enclosed spaces in an off-site facility and is assembled on the final site depending on the project schedule. These systems are the most advanced, reaching around 70% to 95% of work finished before on-site assembly (Thai et al., 2020). “Precast concrete” or “precast construction” generally refers to producing wall panels, beams, columns and other building elements, with concrete as the primary material. For example, Hong Kong is a leading adopter of precast construction (Dong et al., 2015). Recorded statistics show that 25% of the total concrete volume in public residential housing was from precast concrete by 2015 (Wong et al., 2015). The third sub-cluster represents the specific applications of PFC, such as “modular building” and “prefabricated house”.
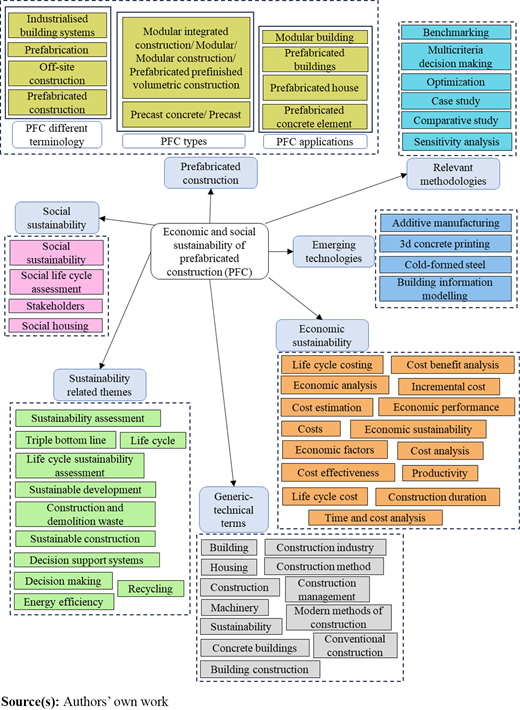
Topic Area 2 covers the themes relevant to EcS of PFC, such as economic indicators, EcS assessment methodologies and specific technical terms. For example, “life cycle cost” is an indicator, whereas “life cycle costing” (LCC) is a standard methodology to assess the costs relevant to a PFC life cycle (Ciroth et al., 2011). Furthermore, “construction duration” and “productivity” are indicators that can be incorporated into economic evaluations related to PFC projects. Moreover, “cost-benefit analysis” is a specific methodology; contrastingly, keywords such as “economic analysis” and “cost analysis” are generic terms for representing assessment methodologies. “Costs”, “cost-effectiveness” and “economic factors” are examples of specific technical terms relevant to the EcS topic. Topic Area 3 envelops the aspects related to the ScS of PFC. The inclusion of only four keywords, compared to 15 in EcS of PFC, indicates a lack of research in ScS of PFC relative to EcS. Except for the key term “social sustainability” itself, S-LCA is a well-known evaluation technique for assessing life cycle social performance (Andrews, 2009). Furthermore, the life cycle social impacts are assigned to “stakeholders” of PFC projects, such as workers, local community and value chain actors in S-LCA. The elements such as indicators, impacts and assessment methodologies of EcS and ScS of PFC are explored based on real case studies in the later sections as part of the critical discussion.
Topic Area 4 describes the common terminologies, concepts and methodologies relevant to sustainability as the central theme. LCSA is a methodological approach that integrates the “triple bottom line” sustainability from a life cycle perspective (Ciroth et al., 2011; Liu and Qian, 2019b) conducted an LCSA to assess and compare the sustainability performance of modular, precast and conventional construction methods. Thus, generally, LCSA entails EcS and ScS assessments. Moreover, sustainability indicators such as “energy efficiency” affect the life cycle costs of PFC projects. On top of that, CE strategies such as “recycling” and circular management of end-of-life “construction and demolition waste” impact all environmental, EcS and ScS. Furthermore, to support sustainability-based “decision making” in PFC applications, intelligent “decision support systems” are imperative.
Topic Area 5 identifies recent technology integration solutions in the global PFC industry, which have a high potential to enhance sustainability. The factory-controlled settings in PFC ease the use of “additive manufacturing” technologies (e.g. “3d concrete printing”) that generate distinctive architectural features that are demanding to achieve using traditional casting methods (Anton et al., 2020). “Cold-formed steel” (CFS) displays significant advantages compared to conventional hot-rolled steel, such as speedy construction, excellent potential for reusing and recycling, lightweight and higher strength-to-weight ratios (Liang et al., 2022; Billah et al., 2019). Therefore, CFS is a recent trending building material choice for PFC techniques, such as modular construction (Liang et al., 2022). “Building information modelling”, although not a relatively recent technology in PFC projects, facilitates an integrated digital platform to conduct sustainability assessments and automate monitoring of sustainability indicators by incorporating smart technologies such as the Internet of Things (IoT) (Hao et al., 2020; Mostafa et al., 2020). Topic Area 6 represents commonly used research methodologies and approaches in sustainability studies, such as “sensitivity analysis”, “optimization” and “multicriteria decision making”. Finally, topic Area 7 denotes generic-technical terms related to the research area as a whole (e.g. “construction industry” and “housing”).
3.4 Social structure
Academic social collaborations are imperative in research to promote productivity and effective advancement of the research field by knowledge sharing (Li et al., 2024b). Figure 6 illustrates seven cooperative academic groups in EcS and ScS of PFC research, including the primary research themes focused on. The most extensive and close collaboration network is observed between Hu M, Tukker A, Yang C, Zhang C, Garnesson T and Laclau B with a closeness centrality of 0.2 (the lower the score, the distance to travel to others in the network are lower). They have primarily researched the EcS of PFC using LCC as the methodology covering different European Union (EU) nations (Zhang et al., 2021b; Zhang et al., 2021a; Zhang et al., 2020). Collaborative work between Abidin NI, Hashim N, Shamsuddin SM and Zakaria R also exhibited a strong network with a closeness centrality of 0.33. These scholars centred their research on managerial aspects of LCC of PFC in Malaysia using survey methods such as questionnaires and interviews (Shamsuddin et al., 2021; Shamsuddin et al., 2017). The academic clusters Freire F-Tavares V and Kozlovská M-Švajlenka J focused mainly on estimating the life cycle costs and time of different prefabricated systems and compared them with TC methods (Tavares et al., 2021a; Tavares et al., 2021b; Švajlenka and Kozlovská, 2018; Švajlenka et al., 2017; Kozlovska et al., 2015). In contrast, the Qian S-Liu S author group additionally considered social performance using S-LCA (Liu and Qian, 2019a; Liu and Qian, 2019b).
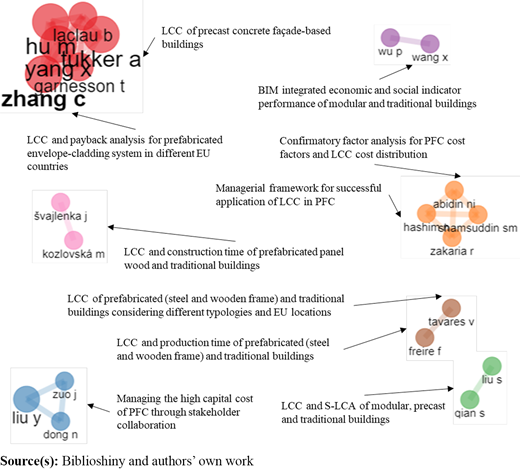
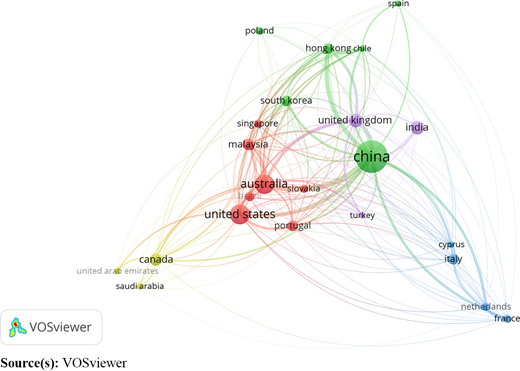
Figure 7 shows the country collaboration network of the EcS and ScS of PFC research with five cooperative clusters. Node size denotes the number of collaborative document occurrences in a particular country, and the line thickness indicates collaborative strength (Xie et al., 2020). China, the USA, Australia, the UK and India are the top countries with the highest collaborative publications (42, 17, 16, 8, 8, respectively). China had the highest total link strength (3223), followed by Australia (1976), USA (1184), UK (1131) and Hong Kong (945), respectively. Furthermore, China and Hong Kong showed the most substantial collaboration in the research space. The results show that developed economies (such as the USA, Australia and the UK) and emerging economies, such as China and Malaysia, were prominent in conducting research in the EcS and ScS of the PFC research domain compared to the developing regions.
4. Economic sustainability assessment of prefabricated construction
The current section focused on a comprehensive critical discussion, including a content analysis of selected studies to answer the EcS of the PFC part of the RQ2 and RQ3. Case studies-based quantitative assessments were chosen to analyse, present and discuss the content in the current section. In the selection process for the quantitative content analysis, the studies with qualitative, managerial aspects and viewpoints were excluded. Moreover, due to readability issues, the cost-analysed studies that presented figure-based results without specific identifiable quantitative values had to be omitted. Table 1 summarises selected life cycle economic sustainability assessment (LCEA) studies conducted in developed and developing countries to assess EcS of PFC. Developed, emerging and industrialised economies have a significant share of the studies compared to developing countries. North American and European nations are the leading ones that have undertaken research related to EcS in PFC.
Important economic sustainability assessment studies of PFC in developed and developing economies
| Study | Country/region | Economic assessment type | System boundary4 | Construction system | Case study type1 | PFC type | Indicator quantification highlights | ||
|---|---|---|---|---|---|---|---|---|---|
| Comp. | Stan. | Cost | Time/productivity | ||||||
| (Vasishta et al., 2023) | US | LCC | Cradle-to-grave | Building systems | ✓ | Precast | Annualised cost equation (EAC), energy simulation | ||
| (Pan and Zhang, 2023) | Hong Kong | Economic sub-indicator estimations | Construction phase | Superstructure and foundation | ✓ | Modular – Steel and concrete | Estimations based on on-site information, interviews and secondary sources | ||
| (Szalay et al., 2022) | Hungary | LCC | Cradle-to-grave | Building systems | ✓ | Cross-laminated timber | Energy simulation, cost estimations | ||
| (Kamali et al., 2022) | Canada | LCEA | Cradle-to-use | Building systems | ✓ | Modular | Performance level function, multi-criteria | ||
| (Vassiliades et al., 2022) | Cyprus, Italy | LCC | Cradle-to-grave | Building systems | ✓ | Modular | Present value, energy simulation | ||
| (Batikha et al., 2022) | United Arab Emirates | Total costs and other indicators | Material, construction | Building systems | ✓ | Modular | Estimations based on on-site information | ||
| (Jang et al., 2022) | South Korea | LCC | Cradle-to-gate3 | Building systems | ✓ | Modular | Direct estimation | ||
| (Alshamrani, 2022) | Saudi Arabia | LCC | Cradle-to-grave | Building systems | ✓ | Precast | NPV2 | ||
| (Tavares et al., 2021a) | EU countries | LCC | Cradle-to-grave | Buildings systems and locations | ✓ | Prefab – steel and wood framing | Direct estimations through EU-27 country-specific databases | ||
| (Balasbaneh and Sher, 2021) | Malaysia | LCC | Cradle-to-grave | Building systems | ✓ | Modular, precast | Discounted method, NPV | ||
| (Wang et al., 2020) | Japan | LCC | Cradle-to-grave | Building systems | ✓ | Precast | Estimations based on on-site information and secondary sources | ||
| (Kurpinska et al., 2019) | Poland | Economic sub-indicator estimations | Cradle-to-gate | Shell (walls, ceilings, stairs) | ✓ | Precast | Estimations based on on-site information and secondary sources | ||
| (Liu and Qian, 2019b) | Singapore | LCC | Cradle-to-use | Building systems | ✓ | Modular, precast | NPV | ||
| (Sutrisna et al., 2019) | Australia | Total costs | Cradle-to-gate | Building systems | ✓ | Modular | Direct estimation | ||
| (Samani et al., 2018) | US | LCC | Cradle-to-grave | Buildings systems and locations | ✓ | Prefabricated fibre-reinforced concrete | NPV | ||
| (Jeong et al., 2017) | South Korea | Total costs and other indicators | Cradle-to-gate | Columns | ✓ | Precast | CYCLONE (CYCLic operation networks) | ||
| (Mao et al., 2016) | China | LCC | Cradle-to-gate | Building systems | ✓ | Precast | Estimations based on on-site information, interviews and secondary sources | ||
| (Fagen and Phares, 2000) | US | Total costs | Cradle-to-grave | Bridge beam | ✓ | Precast | Direct estimation | ||
1Comp. = Comparative with TC, Stand. = Standalone only with PFC methods, 2NPV = Net present value, 3gate refers to end of construction stage, 4Relevant to cost assessment
4.1 Economic sustainability assessment methods
Studies primarily have adopted five assessment types (LCEA, LCC, Total costs, Total costs and other indicators and Economic sub-indicator estimations) to assess the EcS of PFC. LCEA uses the life cycle approach, including LCC and other economic indicators, such as time and productivity. LCC is an accumulation of all direct costs related to a product (i.e. buildings) over its whole life cycle from resource extraction to the end-of-life stage (demolition). An LCC analysis steps can be attributed to an LCA under the four primary phases defined in ISO 14040:2006 [goal and scope, life cycle inventory (LCI), indicator assessment and interpretation] (Ciroth et al., 2011; ISO, 2006). Furthermore, ISO has published a specific standard (ISO 15686–5:2017, Buildings and constructed assets – Service life planning – Part 5: Life-cycle costing) to guide on performing LCCs of buildings and construction assets and their parts (new or existing) (ISO, 2017). A Canadian study developed an LCEA framework including LCC (cradle-to-use), design and construction time, building durability, integrated management, investment and related risks and building adaptability as the performance criteria for single-family modular homes (Kamali et al., 2022). The second type, LCC, only focused on cost variables from a life cycle perspective. Most selected research adopted this approach in evaluating EcS of PFC cases, as recorded in Table 1.
Type 3 (total costs) did not specify a life cycle approach but assessed costs relevant to single or multiple life cycle stages. The implication of the cost allocation to individual life cycle stages is ambiguous in these studies. Furthermore, in economic assessment Type 4 (total costs and other indicator types), other indicators were focused on in addition to the cost domain. For example, large-scale residential development in Dubai considered material costs, construction costs and construction duration (man hours for structural and non-structural activities) to compare prefabricated modular construction, cast-in situ reinforced concrete, cold-formed steel, hot-rolled steel and 3D Concrete Printing (Batikha et al., 2022). The fifth type, economic sub-indicator estimations, concentrated on sub-parts of certain life cycle stages instead of calculating the total economic effect of a life cycle stage. Pan and Zhang (2023) estimated the costs for building works and labour per a typical floor and time parameters, floor cycle and duration for superstructure in comparing concrete and steel-based modular construction with TC.
4.2 Goal, scope and life cycle inventory
The main goal of the selected case studies for the content analysis (∼78%) was to compare the EcS performance of prefabricated systems with the TC. The remaining studies were focused on evaluating and comparing the EcS of different prefabricated systems or projects. The choice of the assessment method (i.e. LCEA, LCC or other technique) needs to be decided in the goal definition stage to support subsequent scope development and LCI analysis. Defining the scope of EcS assessments depends on critical factors such as study goal, data availability and data requirements (i.e. specificity and accuracy) (Jayawardana et al., 2022). Similar to environmental LCAs, the system boundary of EcS assessments of PFC can be defined based on the “cradle-to-grave” model. Cradle-to-grave considers the whole life cycle of a PFC project. For example, considering a prefabricated building, the cradle-to-grave includes main cost elements such as design and raw material acquisition costs, off-site manufacturing and transportation costs, on-site assembly costs, operation and end-of-life disassembly costs (Li et al., 2020; Ghisellini et al., 2018). Mao et al. (2016) proposed a PFC project lifespan cost framework to differentiate the cost elements in PFC and TC methods. The selected cases in Table 1 show that cradle-to-grave and cradle-to-gate are the most applied system boundaries in relevant studies. Furthermore, buildings are the most considered construction system, followed by a few sub-systems such as superstructure and walls. Notably, there is one case of bridge beam as the construction application (Fagen and Phares, 2000).
Relevant data collection related to EcS, including cost details, can be particularly challenging for commercial sensitivity considerations. Thus, gathering project/process-level economic data pertinent to real case studies can be limited. Three primary approaches can be used to collect economic data related to PFC projects. The first is the site/plant-specific project and process economic information. Internal organisational sources such as finance, quantity surveying and manufacturing departments can help find the required data. Furthermore, external sources such as industry databases state and national databases can be used to acquire data. Secondly, generic data sources such as literature, project reports and public databases can gather general data and convert them to context-specific PFC cases. Thirdly, computer-based simulation methods over a specific period can be used to estimate costs. Energy simulation is a common approach in previous case studies used to estimate costs at the occupation phase of a PFC project life cycle (Szalay et al., 2022; Vassiliades et al., 2022).
4.3 Economic indicators and quantification methods
Calculations related to indicators such as construction time are straightforward. They can be directly acquired from project timelines or estimated through interviews or questionnaires involving key stakeholders. Conversely, cost estimation may require quantitative models due to factors such as the time value of the money (e.g. inflation effects) (Adrian-Cosmin et al., 2023). The typical building lifecycle ranges between 50 and 60 years (Rodriguez et al., 2020). Net present value (NPV) and equivalent annual cost (EAC) are common capital budgeting methods used in relevant studies to consider future cash flows of the PFC project investments. In the NPV approach, cash flows are discounted to the present, whereas EAC transforms cash flows into an equivalent series of uniform annual values (Jones and Smith, 1982). NPV is more suitable for project cost estimations over a specified period, whereas EAC is better when accounting for projects with different life spans (Cui et al., 2022). Some studies that used direct estimations in Table 1 do not specify the use of cost models to consider the time value of money in their publications. In some cases, direct cost values are used where only the construction stage is considered. These studies are limited to the present time, where the construction costs range within a single to a few marginal years (project construction life cycle). Few research publications used simulation methods such as energy simulation to derive the relevant project costs (Szalay et al., 2022; Vassiliades et al., 2022; Jeong et al., 2017). LCCs are mostly conducted manually in spreadsheets. However, software platforms such as SimaPro (Reference Guide: Life cycle costing in SimaPro) (PRe-Sustainability, 2022) and openLCA (Reference Guide: Two different methods to perform Life Cycle Costing in openLCA) (Özlem Duyan and Andreas Ciroth, 2013) can be used.
4.4 Economic performance results
Table 2 summarises the EcS performance results from the selected studies in Table 1. Referring to the summary, the use of different economic indicators (mainly related to cost), units, system boundaries and construction systems in assessing the EcS of PFC is noticeable. Hence, the diversity of the EcS performance results raises a challenge in the subsequent comparisons. However, Table 2 presents the specific values (and value ranges) related to cost and other indicators to create improved visibility of the performance comparison of PFC and TC technologies. Some studies have compared the EcS of PFC and TC, whereas others have compared different PFC methods and cases. Comparative environmental sustainability assessments of PFC and TC in the literature indicate clear and distinct environmental benefits (Jayawardana et al., 2023a, 2023b, 2023c; Xu et al., 2020).
Quantitative results of selected studies in economic sustainability of PFC
| Study | Cost | Time/productivity | ||||||||
|---|---|---|---|---|---|---|---|---|---|---|
| Indicator | Unit | PFC1 | TC | Change (%) | Indicator | Unit | PFC | TC | Change | |
| (Vasishta et al., 2023) | Annualised LCC | $ (103)/ year | 464 (with SWP2), 487 (Without) | 602 | −23% | |||||
| (Pan and Zhang, 2023) | Unit cost (building works) | $ (103)/ m2 | 26.4 (C) 32.5 (S) | Not given | ∼ −6% (C) ∼ −7% (S) | Duration (superstructure) | months | 19 (C) 14 (S) | Not given | ∼ −32% (C) ∼ −50% (S) |
| Labor cost/typical floor | $(103)/ m2 | ∼0.75 (C) ∼0.63 (S) | Not given | ∼ −43% (C) ∼ −71% (S) | Labor productivity | m2/ man-hour | 0.12 (C) 0.10 (S) | |||
| (Szalay et al., 2022) | Global cost | EUR (103) | 68–94 | |||||||
| (Kamali et al., 2022) | Design and construction costs | Index value | 98.6 (M1), 97.2 (M2) | Design and Construction time | Index value | 94.9 (M1), 89.1(M2) | ||||
| Operational costs | 57.7 (M1), 15.5 (M2) | |||||||||
| Maintenance costs | 47.90 (M1), 26.60 (M2) | |||||||||
| (Vassiliades et al., 2022) | Life cycle cost | EUR (103) | (−)0.45 to −1.24 | |||||||
| (Batikha et al., 2022) | Total cost | USD | 371 | 223 | 66% | Construction period | Total man hours/ m2 | 2.7 | 20.8 | −87% |
| (Jang et al., 2022) | Total direct construction cost | USD | 982.57 | 908.97 | 8% | |||||
| (Alshamrani, 2022) | Total cost | Saudi Riyals (106) | 2.21 | 1.76–2.07 | 6–25% | |||||
| (Tavares et al., 2021a) | Total LCC | kEUR/m2 | 1.1–4.1 | 1.2–6.0 | (−)8% to −82% | |||||
| (Balasbaneh and Sher, 2021) | Life cycle cost | Ringgit-MYR (103) | 73.34 (M), 74.60 (PC) | 71.56 | 2.4 and 4% | |||||
| (Sutrisna et al., 2019) | Life cycle cost | 103 Yen/ year.m2 | 21.47 | 23.42 | 10.62% | |||||
| (Kurpinska et al., 2019) | Total cost of elements | Monetary units (105) | 9.98 (PC1), 10.39 (PC2), 11.28 (PC3) | Assembly time | hours (102) | 2.79 (PC1) 2.77 (PC2) 2.68 (PC3) | ||||
| (Liu and Qian, 2019b) | Life cycle cost | Million SGD | 152.90 (M), 130.57 (PC) | 133.57 | 14% and −2% | |||||
| (Sutrisna et al., 2019) | Total cost | AUD (105) | 2.51–4.53 | |||||||
| (Samani et al., 2018) | Total LCC | $ (103) | >20 and <30 | >14 and <23 | ∼27% to 36% | |||||
| (Jeong et al., 2017) | Total cost | $ (106) | 4.26 | 4.32–4.49 | (−)1% to −5% | Productivity | Cycle/minute | 0.015 | 0.008–0.01 | −42.5% |
| (Mao et al., 2016) | Total added cost | Yuan/m2 | 406–557 | |||||||
| (Fagen and Phares, 2000) | Total life cycle cost | $ (105) | 2.95 | 3.11 | −5% | |||||
1(C) = Concrete, (S) = Steel, (M) = Modular, (PC) = Precast concrete, 2precast with sandwich panels
Most studies identified that the estimated economic indicator value difference between PFC vs TC and PFC vs PFC methods lies in a closer range. Some of the case studies conducted in the US (Vasishta et al., 2023; Fagen and Phares, 2000), Hong Kong (Pan and Zhang, 2023), EU countries (Tavares et al., 2021a) and South Korea (Jeong et al., 2017) showed better cost performance of PFC compared to TC. A Singaporean-based LCC found that a precast building had a lower (−2%) and a modular building had a higher (14%) cradle-to-use life cycle cost than a traditional building (Liu and Qian, 2019b). Two cases in the United Arab Emirates (Batikha et al., 2022) and US (Samani et al., 2018) showed significantly higher life cycle costs (66%, approximately 27%–36%, respectively) compared to TC. Prefabrication possesses additional cost-influencing factors compared to TC, such as prefabricated component transportation, specialised labour wages, design accuracy and standardisation, market maturity and the need for extensive coordination before and during construction (Jayawardana et al., 2024; Liu et al., 2023). These factors critically influence the PFC project life cycle costs and lead to higher capital costs. Therefore, managing these factors with active engagement between core stakeholders, such as contractors, designers and manufacturers, is imperative to achieve better benefits (Zhang et al., 2023).
A couple of research studies evaluated the effect of different locations on the PFC project life cycle costs (Samani et al., 2018; Tavares et al., 2021a; Tavares et al., 2021b) assessed the costs of PFC systems with TC for 27 European countries. The study found that costs range from 1.1–3.6 k€/m2 for light steel framed PFC, 1.1–4.1k€/m2 for wood framed PFC and 1.2–6.0 k€/m2 for TC buildings. Moreover, the study highlighted the impact of the cost of living (primarily influenced by electricity and labour costs) for the high life cycle costs of single-family houses compared to other applications such as residential buildings (Tavares et al., 2021a). In a similar study, Samani et al. (2018) stressed that the location of PFC projects can substantially influence construction, maintenance and demolition costs in different US cities (El Paso, Los Angeles and San Francisco). Mao et al. (2016) emphasised additional costs may arise from the requirement for external consulting (domestic and international) due to the immaturity of the PFC designs in countries with less advanced prefabrication. In the chosen literature, the costs of raw materials are generally aggregated to the building components (e.g. prefabricated elements) or to the construction stage. For example, a prefabricated building shell (walls, ceilings and stairs) of a multi-family residential prefabricated building in Poland made using reinforced concrete, concrete products made of sintered and expanded clay aggregate and using lightweight concrete with granulated expanded glass aggregate have a descending order of total costs (Kurpinska et al., 2019).
Using Chinese case studies, Mao et al. (2016) highlighted that increased use of trucks in PFC projects can increase transportation costs by 2.5% to 4.1%. Similar research in Malaysia emphasised expensive transportation and initial cranage costs as the main challenges relevant to modular and panelised precast construction (Balasbaneh and Sher, 2021). Most studies collectively integrated material, manufacturing, labour and transportation costs into construction stage costs, complicating a separate cost analysis. Notably, Wang et al. (2020) found that site construction costs were reduced by 17.08% in the prefabricated building compared to the traditional case. Pan and Zhang (2023) stressed the potential of saving modular construction costs in Hong Kong by introducing more modules and enhancing the efficiency of the supply chain.
Previous literature has predominantly considered energy and maintenance costs at the operation stage of a building. Comparing only construction and operation costs can lead to divisive outcomes. The studies (Vasishta et al., 2023; Wang et al., 2020) highlighted the higher costs of the operation phase compared to construction, whereas these studies (Alshamrani, 2022; Samani et al., 2018) had opposing results. Many factors, such as user behaviours, specific applications, regional cost dynamics, project management, cost completion and aggregation levels, can influence the varying results of the construction versus occupation stages. The cost outcomes need to be compared according to other factors such as time span and building area to generalise the comparisons. Concerning the end-of-life, the studies confirmed that prefabrication reduces demolition costs compared to conventional methods (Samani et al., 2018; Wang et al., 2020; Vasishta et al., 2023). The PFC technologies create unique capabilities that support end-of-life disassembly, recycling and reuse of components (Jayawardana et al., 2023a, 2023b, 2023c; Minunno et al., 2018).
Among the four cases that considered time as an indicator, two compared PFC with TC and found significant time savings in using prefabrication. Notably, Batikha et al. (2022) estimated that using modular construction technology reduces the time of construction activities (structural and non-structural) by 87% compared to TC. Furthermore, Jeong et al. (2017) identified that a form-latticed prefabricated steel-reinforced concrete column improved productivity by 42.5% compared to a conventional steel-reinforced concrete column. However, the study found that CO2 emissions of the prefabricated column is 72.18% higher than the traditional column (Jeong et al., 2017). Thus, the aggregated sustainability impacts of TBL must be considered when reaching sustainability-making decisions related to PFC. Tools such as LCSA can be used to evaluate holistic sustainability by integrating TBL sustainability from a life cycle perspective (Jayawardana et al., 2022).
5. Social sustainability assessment of prefabricated construction
The current section addresses the ScS of the PFC component relevant to RQ2 and RQ3 through a qualitative discussion. Similar to the previous section, the articles were screened for content analysis. Table 3 reports the S-LCAs conducted in developed and developing economies to evaluate the ScS of PFC. All S-LCAs were based on case studies in developed, emerging and industrialised economies, creating a closer context to EcS of PFC. Moreover, compared to the quantity of published research in the EcS of PFC, the studies on ScS of PFC are significantly low in numbers.
Social sustainability assessment studies of PFC in developed and developing economies
| Study | Country/region | SLCIA type | System boundary | Case study type2 | PFC type | Stakeholders3 | Impact categories | Indicator quantification method | Data types4 | ||||||
|---|---|---|---|---|---|---|---|---|---|---|---|---|---|---|---|
| Comp. | Stan. | Wo | Oc | LC | So | VA | QN | SQN | |||||||
| (Pan and Zhang, 2023) | Hong Kong | Other | Construction phase | ✓ | Modular – steel and concrete | ✓ | ✓ | ✓ | ✓ | Safety, welfare, impacts on industry and community | Estimations from on-site information, interviews and secondary sources | ✓ | |||
| (Filho et al., 2022) | Brazil | Other | N/S1 | ✓ | Precast | ✓ | Impact on the local community | Brazilian cost and index research system | ✓ | ||||||
| (Barron et al., 2022) | US | Other | Construction phase | ✓ | Modular | ✓ | Safety | Hazardous process stream index (HPSI) | ✓ | ||||||
| (Balasbaneh and Sher, 2021) | Malaysia | Other | Cradle-to-use | ✓ | Modular, precast | ✓ | ✓ | ✓ | ✓ | ✓ | *23 – Wo (5), LC (9), So (5), Oc (2), VA (2) | Expert judgment based – AHP | ✓ | ||
| (Hammad et al., 2019) | Australia | Other | Construction phase | ✓ | Modular construction | ✓ | Safety and health | Safety – fuzzy logic and risk distribution Noise – noise-level measurement | ✓ | ||||||
| (Liu and Qian, 2019a) | Singapore | I | Cradle-to-use | ✓ | Modular, precast | ✓ | ✓ | ✓ | ✓ | *16 – Wo (6), Oc (4), LC (4), So (2) | Fuzzy, country contribution analysis, expert judgment based – consistent fuzzy preference relations AHP | ✓ | ✓ | ||
| (Dong and Ng, 2015) | Hong Kong | I | Cradle-to-gate | ✓ | Precast | ✓ | ✓ | ✓ | *13 – Wo (7), LC (5), So (1) | Country contribution analysis, expert judgment-based weighting | ✓ | ✓ | |||
1N/S = Not Specified; 2Comp. = Comparative, Stand. = Standalone; 3Wo = Workers, Oc = Occupants, LC = Local Community, So = Society, VA = Value Chain Actors; 4QN = Quantitative, SQN = Semi-quantitative; *Presented under Table 4
Quantitative results of selected studies in social sustainability of PFC
| Study | Stakeholder | |||||||||||||||||||
|---|---|---|---|---|---|---|---|---|---|---|---|---|---|---|---|---|---|---|---|---|
| Worker | Local community | Occupant | Society | |||||||||||||||||
| Impact category | Ind. | Unit | PFC | TC | Impact category | Ind. | Unit | PFC | TC | Impact category | Ind. | Unit | PFC | TC | Impact category | Ind. | Unit | PFC | TC | |
| (Pan and Zhang, 2023) | Safety | Accident rate | 0(C, S) | Impact on community | Trips of delivery/floor | times | <40 (C) ∼30 (S) | ∼25% high(C) ∼62% high (S) | ||||||||||||
| Working at height | /typical floor | ∼50 (C) ∼25 (S) | ∼100 | |||||||||||||||||
| Welfare | Training opportunities | Times/ month | 4–5 (C) 4 (S) | |||||||||||||||||
| (Filho et al., 2022) | Impact on community | Investment on local labours | USD (103) | 14.02–14.74 | 15.26–16.34 | |||||||||||||||
| (Barron et al., 2022) | Safety | Process risk | 0.03 | 0.22 | ||||||||||||||||
| (Balasbaneh and Sher, 2021) | Respect for freedom of association | 0.45 (M) 0.37 (P) | 0.18 | Land use | 0.37 (M) 0.43 (P) | 0.2 | Consumer complaint presence | 0.4 (M) 0.28 (P) | 0.32 | Ease of installation | 0.4 (Mo) 0.28 (PC) | 0.3 | ||||||||
| Occupational accidents | 0.4 (M) 0.33 (P) | 0.27 | Levels of industrial water use | 0.48 (M) 0.36 (P) | 0.16 | Reduced sound production | 0.42 (M) 0.38 (P) | 0.2 | Contribution to GDP | 0.49 (M) 0.29 (P) | 0.2 | |||||||||
| Living/non-poverty wages | 0.44 (M) 0.33 (P) | 0.23 | Extraction of material resources | 0.36 (M) 0.45 (P) | 0.19 | Functionality and appeal | 0.45 (M) 0.32 (P) | 0.2 | ||||||||||||
| Use of forced labour | 0.44 (M) 0.32 (P) | 0.24 | Pollution levels | 0.4 (M) 0.4 (P) | 0.2 | Durability | 0.39 (M) 0.36 (P) | 0.3 | ||||||||||||
| Discrimination related to the ages of workers | 0.33 (M) 0.35 (P) | 0.32 | Waste generation | 0.39 (M) 0.41 (P) | 0.2 | Maintenance cost and frequency | 0.49 (M) 0.29 (P) | 0.2 | ||||||||||||
| Job creation | 0.33 (M) 0.42 (P) | 0.25 | ||||||||||||||||||
| Use of local labour | 0.35 (M) 0.39 (P) | 0.26 | Below two factors (F1, F2) are under stakeholder – Value Chain Actors | |||||||||||||||||
| Presence of complaints by local communities | 0.28 (M) 0.36 (P) | 0.36 | F1-Monopoly and anti-competitiveness | 0.44 (M) 0.33 (P) | 0.2 | |||||||||||||||
| Protection of cultural heritage | 0.36 (M) 0.45 (P) | 0.19 | F2-On-time payment | 0.44 (M) 0.32 (P) | 0.2 | |||||||||||||||
| (Hammad et al., 2019) | Health and safety | Injury risk level | 1.63 (M1) 2.01 (M2) | 2.17 (TC1) 3.35 (TC2) | ||||||||||||||||
| Noise level | dB(A) | 59–70 (M1) 68–72 (M2) | 69–73 (TC1) 70–78 (TC2) | |||||||||||||||||
| (Liu and Qian, 2019a) | Health and safety | 1.16 (M) 0.8 (P) | Health and safety | 0.71 (M) 0.82 (P) | Functionality and usability | 1.46 (M) 1.46 (P) | Technology development | 1.1 (M) 0.43 (P) | ||||||||||||
| Fair salary | 0.24 (M) 0.26 (P) | Accessibility | 1.15 (M) 1.22 (P) | Health and comfort | 0.97 (M) 1.11 (P) | Public commitment to sustainability issues | 0.26 (M) 0.26 (P) | |||||||||||||
| Working hours | 0.40 (M) 0.42 (P) | Integration and interaction | 0.51 (M) 0.61 (P) | Accessibility | 1.31 (M) 1.31 (P) | |||||||||||||||
| Discrimination | 1.07 (M) 1.08 (P) | Local employment | 0.82 (M) 0.82 (P) | Feedback mechanism | 1.50 (M) 1.50 (P) | |||||||||||||||
| Forced labour | 1.5 (M) 1.48 (P) | |||||||||||||||||||
| Child labour | 1.42 (M) 1.37 (P) | |||||||||||||||||||
| (Dong and Ng, 2015) | Freedom of association and collective bargaining | 0.09 | Access to material resources | 0.84 | Public commitment to sustainability issues | 1.00 | NA | |||||||||||||
| Child labour | 0.74 | Cultural heritage | 0.27 | |||||||||||||||||
| Fair salary | 0.77 | Safe/healthy living conditions | 1.00 | |||||||||||||||||
| Working hours | 0.95 | Community engagement | 1.00 | |||||||||||||||||
| Forced labour | −0.22 | Local employment | 1.00 | |||||||||||||||||
| Equal opportunities/ discrimination | 0.15 | |||||||||||||||||||
| Health and safety | 1.00 | |||||||||||||||||||
*(C) = Concrete, (S) = Steel, (M) = Modular, (P) = Precast concrete
5.1 Social sustainability assessment methods
S-LCA is the most known methodological tool for assessing the social impacts of products (e.g. prefabricated buildings) throughout their life cycles (Huarachi et al., 2020). In the evolution of the S-LCA concept, the most significant contribution occurred in 2009, with the publication of “Guidelines for Social Life Cycle Assessment of Products” (Andrews, 2009). Recently introduced guidelines, “Guidelines for Social Life Cycle Assessment of Products and Organizations 2020” (United Nations Environment Programme, 2020) and “Methodological Sheets for Subcategories in Social Life Cycle Assessment (S-LCA) 2021” (United Nations Environment Programme, 2021), introduce the social organisational LCA (SO-LCA) and guidance for social stakeholder and impact subcategories. From a typological point of view, S-LCAs can be categorised into three main groups based on the social life cycle impact assessment (S-LCIA) method: S-LCIA type I, S-LCIA type II and others. The in-depth details of these types are presented under the following sections.
5.2 Goal, scope and life cycle inventory
The primary goal of the S-LCAs (∼70%) was to compare the social performance of PFC with TC methods. The rest evaluate the ScS of multiple prefabricated systems, except for one study that considered only a single PFC case. Under the system boundary, the S-LCA user must decide on selecting PFC life cycle stages (physical perspective) and the key life cycle stakeholders (effect perspective) (United Nations Environment Programme, 2020). Similar to the EcS assessment case, decisive factors such as study goal, data availability and data requirements need to be considered when developing the scope components. The same “cradle-to-grave” model can be used to define physical boundaries. Table 3 shows that all S-LCAs considered the construction stage, except for one study that did not specify the physical boundary. Among the six studies that considered the construction phase, three only focused on the construction stage, and the other three used different boundaries (i.e. cradle-to-gate and cradle-to-use). In the stakeholder selection, the practitioners can stick to general stakeholders (i.e. workers, occupants, local community, society and value chain actors) relevant to PFC projects, introduce new stakeholders (e.g. children) and decide on sub-dividing the chosen stakeholders (e.g. divide value chain actors to sub stakeholders such as material suppliers, manufacturers and logistics providers) or keep them all at primary stakeholder level. Table 3 indicates that all seven S-LCAs are limited to the general stakeholders of PFC.
Decisions on impact assessment method selection and use of activity variables become critical in manual analyses compared to software-based approaches. S-LCIA type I use performance reference points, comparing these with performance indicators to evaluate the ScS of PFC projects. The SLCIA type II approach accompanies impact pathways to investigate social performance (Huarachi et al., 2020). Meanwhile, the “other” type does not distinctly specify the use of the impact assessment method (type I or type II), nor is it clearly identifiable from the methodology described in the respective study.
The activity variable is a process activity measure related to the process output (United Nations Environment Programme, 2020). The worker hours is a common activity variable used in commercial software platforms and manual calculations. Indicator selection for each social impact category can be made into three types based on the output type (quantitative, qualitative and semi-quantitative), resolution level (company, site-specific and generic) and collection source (primary, secondary) (United Nations Environment Programme, 2021).
Considering the site-specific and primary data in S-LCA, the participation of PFC stakeholders (e.g. workers) will be required to collect data. Survey questionnaires, interviews, focus group discussions and observatory exercises can be conducted to fulfil this purpose. Commercial databases such as the Social Hotspots Database (Norris et al., 2013) and Product Social Impact LCA (PSILCA) (Ciroth and Eisfeldt, 2016) can be used for generic and secondary information. Moreover, international databases such as ILO and OECD can be referred to (OECD, 2024; ILO, 2024). Data quality management is vital to enhance the accuracy and validity of the LCSA study. The pedigree matrix indicator scoring system used in ecoinvent can be used to maintain a record of data quality (Ciroth et al., 2016).
5.3 Social life cycle impact assessment
Social impact subcategories can be selected based on the UNEP guideline (United Nations Environment Programme, 2021) and relevant S-LCA studies in the construction domain. As tabulated in Table 4, health and safety and working hours for workers, and local employment and accessibility for the local community are some typical impacts included in the ScS assessment in PFC-related case studies. The indicators are required to quantify the social impact subcategories. For example, “non-fatal and fatal occupational injuries per 100,000 workers” is a quantitative indicator to estimate the health and safety impact for construction workers (Liu and Qian, 2019a). Compared to environmental and EcS performance indicators, social impact-based indicators are subjective and more complicated to quantify due to the uniqueness of the projects. Thus, incorporating semi-quantitative and qualitative indicators is recommended in relevant guidelines (refer sub-section 5.1) and related research (Liu and Qian, 2019a; Balasbaneh and Sher, 2021). “Adequate general occupational safety measures are taken” is such a semi-quantitative/qualitative indicator that can estimate the health and safety impact of workers (United Nations Environment Programme, 2021).
Two S-LCA research studies followed a country performance-based analysis to score the indicators relevant to the cradle stages (raw material extraction and processing stages) (Liu and Qian, 2019a; Dong and Ng, 2015; Liu and Qian, 2019a) used SLCIA type I-based manual S-LCA using country performance scores to normalise social indicators at these life cycle stages. In the site-specific life cycle stages, all quantitative, qualitative and semi-quantitative indicators may need to be primarily collected from sites depending on the scope of the study. Performance reference values can normalise the raw quantitative indicators and derive social performance scores for impact subcategories. Considering semi-quantitative indicators, mathematical methods such as fuzzy number analysis can be used to convert semi-quantitative scores to crisp values (Liu and Qian, 2019a). Weighting is essential in calculating final single sustainability scores to compare between impact categories and/or alternative construction methods (e.g. PFC vs TC). Furthermore, Huertas-Valdivia et al. (2020) recommend using a weighting system relating to stakeholders, considering the relevancy and the level of differential impact of each stakeholder. Expert-based opinions and ratings can be gathered to calculate the weights using multi-criteria decision methods such as the AHP (Jayawardana et al., 2022). Moreover, equal weighting can also be considered depending on the specific context with proper justifications for the assumptions. Furthermore, two more prioritisation approaches can be integrated into the weighting process, including the most robust and relevant category prioritisation and worst performance prioritisation (United Nations Environment Programme, 2020).
5.4 Social performance results
Table 4 shows the ScS performance values of the case studies mapped with relevant stakeholders and impact subcategories. Similar to EcS of PFC studies, inter-comparison between different research outcomes is restricted due to study-specific system boundaries, assumptions and data completeness levels. However, an intra-comparison among S-LCAs is provided to create an objective view of the social performance of PFC. All S-LCAs that compared the social performance of PFC and TC found that PFC performed better. The results indicate that the workers and local community are the most focused stakeholders in the PFC S-LCAs.
The research that assessed the social impact of Brazilian low-income buildings quantified the impact on the community in terms of US$. In this scenario, according to the study’s interpretation, low values show a more positive contribution to ScS (Filho et al., 2022). Thus, the precast concrete-based buildings performed marginally better than cast-in-place concrete and structural masonry structures in terms of ScS (Filho et al., 2022; Pan and Zhang, 2023) highlighted that modular buildings substantially elevate the ScS, particularly the steel modular system (e.g. working at height was reduced by about 80% in the steel case). Moreover, from an industry perspective, the Hong Kong-based study stressed that intelligent technology integrations (e.g. BIM, IoT, VR, AR and blockchain technologies) in modular projects lead to increased productivity, more young talent involvement and enhanced innovation (Pan and Zhang, 2023). Hammad et al. (2019), using a BIM-based framework, evaluated the ScS of two PFC (modular) and two TC buildings in Australia and indicated that modular construction is the most suitable alternative to reducing the risk of worker injuries and noise pollution generated by the construction equipment (see Table 4).
Malaysian research on ScS of PFC (modular and panelised) and TC found that modular construction is the best construction method with the highest normalised values in workers, society, occupants and value chain actors except for the local community. Individual panelised residential building surpasses the modular case related to the local community stakeholder group (Balasbaneh and Sher, 2021; Balasbaneh and Sher, 2021) highlighted that less maturity of modular construction (< five years) compared to panelised technology (> 20 years) in the Malaysian PFC industry context has influenced the indicators such as job creation related to local communities. Moreover, a Singaporean case study had a similar outcome that indicated modular construction outperformed semi-prefabrication in terms of ScS (Liu and Qian, 2019a). This study highlighted that the difference is primarily created by the impact subcategories health and safety (worker) and technology development (society) with the support of indicators reduced working at height times and prompt actions in novel construction technology integration (Liu and Qian, 2019a). Furthermore, Liu and Qian (2019a) stressed the impact of importing modules from foreign channels on the social indicator of local employment related to modular construction compared to the semi-prefabrication method. The results from a handful of S-LCA studies indicate the need for more research to explore, assess and understand the social themes in the PFC and construction as a whole. These findings suggest that the social impacts relevant to upstream and downstream supply chain processes of PFC projects should be comprehensively evaluated.
6. Challenges to economic and social assessments of prefabricated construction and proposed improvement strategies
6.1 Methodological immaturity and data availability barriers
Unlike environmental sustainability assessment (i.e. LCA), the immaturity of EcS and ScS assessment methods significantly hinders applying a holistic life cycle perspective in prefabricated structures (Jayawardana et al., 2022). Studies have highlighted the need for the maturity of impact assessment methods, context-specific techniques to carry out uncertainty analyses and the requirement for harmonisation of the TBL assessment methods relevant to industrial sectors (Costa et al., 2019; Fauzi et al., 2019). Even with the publicly available guidelines, as highlighted by López-Guerrero et al. (2022), the economic and social aspects of PFC lack robust indicators and methods for their quantification. Furthermore, data availability is a common and significant challenge for both economic and social assessments in general (Costa et al., 2019; Alejandrino et al., 2021), in their review of case studies related to LCSA, emphasised the limited use of databases in EcS and ScS assessments due to the immaturity of social and economic commercial databases. Dong and Ng (2016) noted that lack of data availability is a greater concern in building construction sustainability assessments. Fauzi et al. (2019) also stated that the real scenarios may not adequately reflect by using high volumes of national or sector-level statistical data instead of primary data.
6.2 Economic and social assessment-specific barriers
Concerning EcS, the time value of money and diverse cost categories in the life cycle stages of a prefabricated project increase the ambiguities in cost assessments. The financial information may originate from different sources; thus, developing a consistent data sample can be complicated (Swarr et al., 2011). Moreover, different currency types, discount rate definitions and the relevance and importance of life cycle costs for the various PFC stakeholders (such as clients, contractors, manufacturers, workers and society) are typical complications in LCC analyses (Costa et al., 2019). Cost data with different currencies at different temporal points need to be converted into currency at present value by suitable exchange and discount rate calculations (Ciroth, 2009). Furthermore, Swarr et al. (2011) suggested presenting data in a way that fairly informs all stakeholders in a product system, even though the LCC is targeting the decision-making of a specific stakeholder. ScS assessments in PFC projects present significant challenges. Social data quantification and correlation to the function unit, the choice of stakeholders, impact subcategories and indicators are some additional challenges besides methodological and data availability issues (Jayawardana et al., 2022). The involvement of multiple life cycle stages in numerous locations at different periods with various stakeholders de-motivate the consideration of social assessments as compared to economic and environmental sustainability assessments. For a comprehensive social performance evaluation, the direct involvement of stakeholders is crucial in the data collection. Thus, determining adequate sample sizes in various life cycle stages of a PFC project and collecting data can be resource-consuming. Hence, additional efforts in terms of time, physical presence, funding and continuous communication can be tedious thereby not considering S-LCA assessments.
6.3 Prefabricated construction-based barriers
The life cycle phases of construction projects can be more diverse, dispersed and complicated depending on the magnitude of the building structures. On top of that, PFC has additional life cycle stages due to off-site prefabrication compared to TC methods, thus, elevating the need for more extensive coordination (Bello et al., 2023). Site specifications, diverse potential components and material types, different assembly techniques and the decentralised nature of the industry challenge the tracking of relevant data and derive meaningful and generalisable sustainability assessment outcomes (Quale et al., 2012; Li et al., 2024b) state that in contrast to the mature supply chain management in the manufacturing industry, the same is lagging in the PFC sector. Thus, the shortcomings in the PFC supply chain can directly affect the effectiveness of the sustainability data collection processes. Moreover, the PFC supply chain can have many direct and indirect value chain actors that is a variable of the project scale, which complicates the stakeholder cut-off boundaries and criteria. Furthermore, the various sources generating information at different tiers of abstraction and detail create a fragmented behaviour in construction projects, challenging the comprehensive data collection related to sustainability evaluations (Behera et al., 2015). An Australian study highlighted the context of different sustainability perceptions of PFC industry stakeholders and the lack of sustainability benchmarks purposefully designed for PFC to conduct sustainability research (Hu et al., 2019). Therefore, it is imperative to find mitigation solutions to support the sustainability work towards global sustainable construction.
6.4 Potential improvement strategies
Figure 8 presents a set of strategies that can be applied to directly and indirectly support EcS and ScS of PFC assessments based on the barrier groups identified earlier in this section. Continuous and focused research efforts are vital in developing specific aspects, such as impact assessment techniques and pilot case studies, to demonstrate and enhance maturity relevant to prefabrication. Furthermore, benchmarking-based life cycle TBL sustainability performance assessment frameworks for different PFC applications (e.g. buildings, bridges, high-rise vs low-rise buildings) need to be developed and use real cases to showcase them (Kamali et al., 2018). Fauzi et al. (2019) suggested conducting more research to establish step-wise procedures to capture consequential aspects of the LCC following the footprints of consequential LCAs. The consequential perspective aims to identify the effects of changes within the life cycle, i.e. changes to certain parts of the LCI that can lead to a series of consequences through chains of cause-effect relationships (Zamagni et al., 2012). Successful data acquisition is imperative to generate accurate and comprehensive outcomes and to inform the principal stakeholders. Thus, active collaboration between industry and R&D is required to develop reliable, accessible national/sector/local level LCI databases (Satola et al., 2020). Furthermore, more site-specific case studies involving multiple stakeholders are imminent to capture local social performances in PFC compared with TC (López-Guerrero et al., 2022).
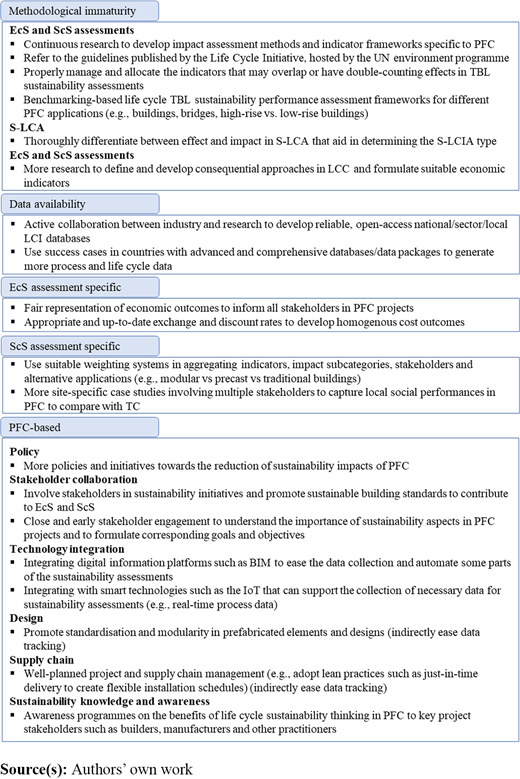
From an industry and practice point of view, more sustainability policies and initiatives need to be established to motivate and initiate actions to reduce the sustainability impacts of PFC operations (Jayawardana et al., 2023a, 2023b, 2023c). Active stakeholder collaboration is crucial to involve these actors in sustainability initiatives and promote sustainable building standards to contribute to EcS and ScS of PFC (Li et al., 2024b). Sophisticated technology integration with PFC construction processes has the potential to yield favourable results for sustainability assessments. Digital information platforms such as BIM can aid in assessing the sustainability indicators before building the physical facility by combining with rating systems such as BREEAM and LEEDS (Hao et al., 2020; Yin et al., 2019; Abanda et al., 2017). On top of that, intelligent technologies such as IoT (e.g. RFID) can support the gathering of necessary data to facilitate sustainability assessment (e.g. real-time process data) (Jayawardana et al., 2023a, 2023b, 2023c). Standardisation and modularity in prefabricated elements and well-planned supply chain management are vital for indirectly benefiting sustainability assessments. Furthermore, awareness of the benefits of life cycle sustainability thinking in PFC to key project stakeholders can offer a strategic drive for realising holistic sustainability.
7. Discussion
7.1 Holistic sustainability in prefabricated construction
Four studies summarised in Table 5 use LCSAs, which offer a holistic evaluation by examining all sustainability dimensions. Pan and Zhang (2023) assessed two modular building projects in Hong Kong, evaluating 11 sustainability indicators across environmental, social and economic aspects. Findings show that modular construction significantly outperforms traditional methods, achieving a 46%–87% reduction in waste and easing urban waste disposal challenges (Pan and Zhang, 2023). Malaysian study identified modular construction as the most environmentally sustainable construction technique, outperforming the precast method by 6% in carbon emissions, 2% in fossil depletion and 6% in ozone layer depletion (Balasbaneh and Sher, 2021). Hammad et al. (2019) found that the modular construction method outperformed the conventional approach by an average of 21% in social, 52% in environmental and 60% in EcS across the evaluated cases. Liu and Qian (2019b) applied an LCSA model to evaluate sustainability across three structural designs: modular construction, semi-prefabricated and conventional. The findings indicate that the semi-prefabricated design is the most sustainable option in this context considering holistic sustainability (Liu and Qian, 2019b).
LCSA Research of prefabricated construction
| Study | Sustainability pillar | Indicators | Indicator quantification methods |
|---|---|---|---|
| (Pan and Zhang, 2023) | Environmental | Waste, energy, pollution | Estimations based on on-site information, interviews and secondary sources |
| Economic | Refer Table 1 | ||
| Social | Refer Table 3 | ||
| (Balasbaneh and Sher, 2021) | Environmental | Greenhouse gas emissions, ozone layer depletion, human toxicity, fossil depletion, terrestrial ecotoxicity | ReCiPe midpoint (H) |
| Economic | Refer Table 1 | ||
| Social | Refer Table 3 | ||
| (Hammad et al., 2019) | Environmental | Energy efficiency, embodied energy | U-value calculation, cradle-to-gate (derived equations) |
| Economic | Time and cost of construction | Utilisation of schedules, productivity databases and cost indices | |
| Social | Refer Table 3 | ||
| (Liu and Qian, 2019b) | Environmental | Human health, ecosystem diversity, resource availability | ReCiPe endpoint |
| Economic | Refer Table 1 | ||
| Social | Refer Table 3 | ||
LCSA studies demonstrated that PFC enhances the TBL when life cycle interactions across environmental, economic and social dimensions are effectively integrated and managed. These LCSA studies stressed the interdependence of the economic, social and environmental dimensions. For instance, the cost efficiencies achieved through optimised prefabrication processes are closely linked with decreased resource consumption and lower emissions, while improvements in social outcomes further enhance overall sustainability. Consequently, the holistic approach provided by LCSAs reinforces the potential of PFC as a robust, sustainable construction technology.
7.2 Holistic sustainability as a driver for circular economy in the built environment through prefabrication
The integration of economic, social and environmental sustainability within the TBL framework serves as a key driver for adopting CE principles in the built environment. PFC inherently supports CE strategies by facilitating modular design, standardisation and the efficient use of resources (Minunno et al., 2018). The controlled manufacturing environment of PFC not only minimises waste generation but also enhances the potential for recycling and reusing components, thus, reducing the environmental footprint of construction projects (Li et al., 2024a). When economic and social benefits, such as reduced costs, improved worker safety and enhanced community engagement, are aligned with these environmental benefits, a sustainable loop is created that promotes resource efficiency and long-term resilience. Furthermore, incorporating integrated sustainability metrics allows stakeholders to better assess and prioritise interventions that maximise CE outcomes. Using decision support tools that combine LCC with environmental and social impact assessments facilitates identifying projects where CE principles can be most effectively implemented. Thus, the TBL perspective not only drives innovation in material reuse and waste reduction but also supports the creation of sustainable urban environments adaptable to future challenges.
7.3 Holistic sustainability in prefabrication to support sustainable development goals
Applying TBL sustainability in PFC is crucial in advancing the UN SDGs. Particularly, PFC can contribute to SDG 9 (Industry, innovation and infrastructure) by promoting innovative construction techniques that enhance productivity and reduce waste. Simultaneously, energy efficiency and emissions reduction improvements align with SDG 12 (Responsible consumption and production), while enhanced community engagement and improved worker safety support SDG 11 (Sustainable cities and communities). Integrating sustainability assessments considering economic, environmental and social factors helps turn research into practical policies. For example, aligning PFC with SDGs can be achieved through standardised sustainability indicators, public–private partnerships and supportive regulations. These measures promote sustainable construction while ensuring broader societal and environmental benefits. This approach provides a roadmap for future research and policy, highlighting the importance of holistic sustainability in building a resilient and inclusive environment.
The discussion section highlights how strengthening TBL sustainability, using multidimensional data and aligning with CE principles and SDGs can make PFC a key driver of sustainable urban development. This integrated approach bridges the gap between theory and practice while paving the way for future innovations and policy improvements in the construction industry.
8. Future research directions
In addition to the gaps identified earlier, the research findings suggest several critical areas that should be prioritised in future research on PFC sustainability: enhanced economic and social assessments, integration of CE strategies and methodological advancements in LCSA and emerging technologies. The findings highlighted (Figure 9) the need for more economic and social assessments of PFC projects, especially in developing countries. On top of that, future case studies should incorporate more ScS sustainability indicators, evaluate impacts on wider stakeholder groups and attempt to expand system boundaries. Other factors such as prefabrication rate, multiple project effects and short-term vs long-term perspectives are essential to integrate with EcS and ScS assessments for better comparisons (Aghasizadeh et al., 2022). Considering the potential of prefabrication to support implementing CE strategies such as reuse and recycling, environmental sustainability studies focused on this aspect are available in the current literature (Minunno et al., 2020; Jayawardana et al., 2023a, 2023b, 2023c). However, a gap exists in evaluating the CE integration effect on the EcS and ScS of PFC. Furthermore, as an emerging research theme, the impact of additive manufacturing technologies centred prefabrication on sustainability performance needs to be extensively covered in future research.
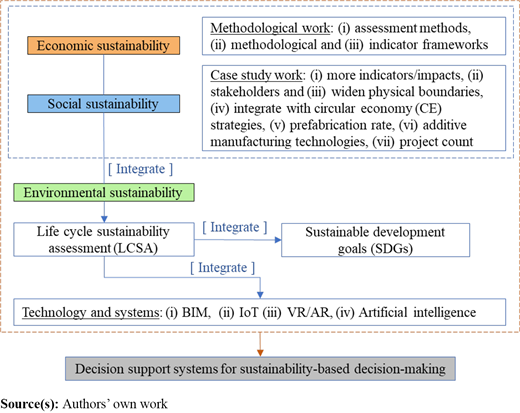
Results show that more assessment methods and methodological and indicator frameworks specific to PFC are required in a global-to-regional-to-local context. On top of that, more research attempts to conduct LCSAs by integrating with environmental sustainability to reach and show holistic sustainability performance are needed in the PFC contemporary status (Jayawardana et al., 2023a, 2023b, 2023c). The converged sustainability performances are imperative to aid strategical decision-making in PFC projects, particularly in regions with low-adopting and less advanced prefabrication contexts. The methodological advances in LCSA integration can immensely benefit motivation in sustainability practitioners. Furthermore, linking the sustainability indicators with SDGs to showcase the contribution of PFC technologies to the United Nations 2030 agenda for sustainable development can positively help the case for PFC on the global stage. As proposed in the section 6, advanced technology integration can be pivotal for automating sustainability assessments. Furthermore, artificial intelligence models can be used to predict and facilitate dynamic sustainability performance analysis of PFC projects. Finally, all these integrations can be used to develop decision-support systems for holistic and practical decision-making and facilitate comparative sustainability performance between traditional and PFC (Jayawardana et al., 2023a, 2023b, 2023c).
9. Conclusions and limitations
The current research conducted a systematic literature review to answer six questions related to EcS and ScS of PFC that are not adequately explored in the current literature. A bibliometric analysis and a critical review, including a content analysis, provided the methodological support to derive the key findings and subsequent study discussions. The bibliometric assessment outcomes indicated the high current research interest and relevance for the EcS and ScS of the PFC domain. The keyword clustering identified seven prominent subject topic areas relevant to EcS and ScS of PFC. The conceptual structure highlighted emerging topics such as LCSA, S-LCA and additive manufacturing pertinent to the research area. Under the critical review, Section 4 identified and clustered EcS assessment methods of PFC using real case studies in developed and developing economies. Furthermore, insights into the goal, scope, LCI and indicator quantification were provided based on results from the content analysis. Thirdly, the EcS performance of the case study PFC projects revealed that the estimated indicator value difference lies in a closer range between PFC vs TC and PFC vs PFC methods in most cases. Similarly, Section 5 focused on the ScS aspect of PFC. Results show that only a handful of studies have conducted S-LCAs for PFC, and most only assessed a few social impacts. Notably, all S-LCAs that compared the ScS performance of PFC and TC identified that PFC performed better. Section 6 presented a range of challenges for EcS and ScS assessments of PFC under the main categories: methodological immaturity and data availability, economic and social assessment-specific and PFC-specific. Subsequently, improvement strategies were proposed to mitigate the resistance to the EcS and ScS of PFC evaluation attempts. The discussion emphasises that TBL benefits of PFC are elevated when environmental, economic and social dimensions are integrated. Addressing gaps in methodology, stakeholder representation and data are crucial to aligning PFC with CE principles and SDGs, realising resilient, sustainable urban development and global construction innovation.
The current research comprises some limitations. The data acquisition was limited to the information available in the Scopus database. There is always a potential to overlook a few relevant studies that might be indexed in other major databases. This was mitigated through snowball sampling to identify further articles through reference lists. Only articles written in English were selected to support the authors’ review process. Therefore, some relevant articles published in other languages might not have been considered in the current review. Furthermore, all the screening processes are conducted according to the instructions given in the methodology section. However, reproducing the same results can be limited. Finally, some case studies of EcS of PFC were excluded due to the difficulties and uncertainties in extracting quantified values presented in the digital publications.
Supplementary material
The supplementary material for this article can be found online.
