This study aims to enhance the effectiveness and reliability of stator winding fault detection in squirrel-cage induction machines. It specifically investigates the influence of signal preprocessing methods, including the Fast Fourier Transform and the Wavelet Transform, on the extraction of fault-related information and the subsequent performance of Deep Neural Networks (DNNs) in classifying inter-turn faults.
The study uses a quantitative mixed-method approach, combining field-circuit modeling with experimental validation. A field-circuit model was developed to simulate both healthy and faulty motor conditions and generate training data. Diagnostic features derived from measured phase current waveforms were processed and used as inputs to a deep convolutional neural network. The framework was rigorously tested using laboratory experiments to verify the classification of inter-turn short-circuits.
The results reveal that appropriate signal preprocessing enhances feature representation quality, indicating that the choice of transform method directly impacts diagnostic accuracy. These findings provide evidence that the developed framework achieves higher precision, sensitivity and robustness, confirming its capability to detect early-stage multi-phase inter-turn short-circuits effectively.
This research offers a novel perspective on noninvasive diagnostics by integrating advanced signal processing with deep learning classifiers. The study provides valuable insights into optimizing input data for DNN fault detection, contributing to the advancement of reliable condition monitoring systems for industrial induction motors.
1. Introduction
Induction machines are essential components of numerous industrial applications, where their reliability directly impacts operational efficiency and productivity. With the increasing shift toward electrified transportation and the growing adoption of electric vehicles, the demand for high-performance induction motors has intensified (Kampker et al., 2022; Xiangjie et al., 2023). These machines are favored for their structural simplicity, robustness, cost efficiency and compatibility with modern frequency converters (Or lowska-Kowalska and Dybkowski 2016). However, diagnosing faults in such systems remains a complex task due to the strong coupling between electrical, mechanical and thermal phenomena. Among the different types of failures, inter-turn short-circuits in the stator winding are particularly critical, as they can propagate rapidly and cause severe winding damage if not detected at an early stage (Dongare et al., 2022).
Early fault identification enables preventive maintenance and minimizes the risk of unplanned downtime. Deep neural networks (DNNs) have recently gained significant attention in machine condition monitoring due to their ability to perform automatic feature extraction and nonlinear pattern recognition (Nazemi et al., 2024). In addition to convolutional architectures, recurrent networks such as long short-term memory (LSTM) have been investigated for motor fault diagnosis Han et al., (2018). Nevertheless, the performance of DNN classifiers depends heavily on the quality and representativeness of the input data. Signal processing techniques such as the Fast Fourier Transform (FFT) and the Wavelet Transform (WT) are widely used to enhance diagnostic signatures, isolate fault-related frequency components and capture transient signal characteristics.
High-fidelity simulation models can further strengthen the diagnostic process by reproducing realistic fault conditions (Berzoy et al., 2017). In research on electrical machine diagnostics, field and field-circuit models based on the finite element method (FEM) have become standard due to their precision in representing coupled electromagnetic and thermal phenomena (Yang et al., 2016; Ojaghi et al., 2018). FEM modeling enables controlled fault simulation and facilitates analysis of key parameters such as fault location, severity and supply distortion. These models also provide valuable data sets for training neural networks, particularly when real fault data are difficult, risky or costly to obtain experimentally.
This study evaluates the influence of FFT and WT feature representations on the classification accuracy of DNNs. The analysis focuses on how various signal domains affect model convergence and performance metrics such as precision, sensitivity and F1-score under different fault severities. The comparative results contribute to the development of more effective deep learning diagnostic systems for inter-turn fault detection in induction motors.
Inter-turn short-circuits typically result from local insulation degradation between adjacent turns, creating a conductive path that generates circulating currents and accelerates thermal aging. Even a single shorted turn alters the magnetic flux distribution, introduces asymmetry in the phase currents and increases torque ripple, producing subtle but measurable signatures in the electrical signals. These effects are influenced by factors such as load, supply quality and operating point. Therefore, reliable fault detection requires diagnostic techniques that remain stable under variable operating conditions and sensitive to small deviations indicative of incipient faults (Dongare et al., 2022).
Traditional noninvasive diagnostic methods, such as motor current signature analysis (Yang et al., 2016; Morsalin et al., 2014), motor vibration signal analysis (MVSA) (Bessous et al., 2018) and the Park’s vector approach, provide valuable insights into machine health. Recent research has also highlighted the effectiveness of Homopolar Rotor Slot Harmonics for detecting asymmetries, although these techniques often require high-resolution spectral analysis and specialized sensor placement (Bonet-Jara et al., 2025; Kouadria et al., 2025). Related start-up torque-based indicators have also been explored (Pietrowski and G’orny, 2017a, b). However, these methods often require expert interpretation of subtle signal patterns, especially when the fault is at an early stage. This reliance on human expertise limits both robustness and repeatability. In contrast, data-driven approaches based on deep learning can automatically extract complex fault-related features from measurement data, representing a significant advancement toward autonomous condition monitoring systems (Wolkiewicz and Kowalski, 2016).
Frequency-domain analysis using the FFT provides a concise representation of stationary components in the stator current. Characteristic sidebands appear around the fundamental frequency and selected harmonics, with amplitudes and spacing dependent on fault location and severity. These spectral features enhance interpretability for maintenance decisions; however, at low fault severity or in the presence of supply distortion, their clarity may decrease. Therefore, appropriate windowing and averaging are necessary to improve the signal-to-noise ratio while preserving frequency resolution.
Time-frequency analysis using the WT extends observability to non-stationary regimes. Wavelet scalograms reveal localized energy concentrations associated with fault onset, transient load variations and intermittent disturbances. The performance of this technique depends on parameters such as the mother wavelet, the number of scales and the scale-to-frequency mapping. Proper parameter selection increases sensitivity to short-lived phenomena, whereas suboptimal choices may blur discriminative features and degrade classifier separability.
Convolutional neural networks (CNNs) are particularly suitable for this task, as they can learn hierarchical representations from raw waveforms, FFT spectra and wavelet scalograms (Shao et al., 2020). Convolutional layers extract local motifs that are progressively combined into higher level features, enabling robust classification under moderate noise and varying operating conditions (Nazemi et al., 2024; Han et al., 2019). When the inputs are two-dimensional signal transforms, the spatial structure aligns well with convolutional processing, allowing the use of established computer vision techniques such as data augmentation, regularization and early stopping. The design of such architectures involves numerous hyperparameters including filter count, kernel size, stride and dropout rate that must be optimized to achieve high classification accuracy. In this study, grid search was applied to systematically tune these parameters, ensuring reproducibility and model stability.
An effective diagnostic framework must balance sensitivity, robustness and computational efficiency. Raw waveform inputs minimize preprocessing and are suitable for embedded implementations, but they require the network to learn frequency-selective features directly from the data. FFT representations introduce a lightweight preprocessing stage that enhances class separability while maintaining low computational cost. Wavelet representations provide richer time–frequency localization, which is beneficial for transient analysis, though they require careful parameter tuning and introduce additional computational overhead.
The data sets used in this research combine simulated signals from a high-fidelity finite element model with experimental measurements from a physical test setup. This approach ensures precise control of fault conditions during training and allows the evaluation of model generalization under real world noise and unmodeled disturbances (Pietrowski and G’orny, 2024). The experiments emphasize low severity cases, including single turn short-circuits, which are most valuable for predictive maintenance yet remain the most challenging to detect automatically.
Performance evaluation focuses on precision, sensitivity and F1-score, reported as macro and weighted averages across fault severities and stator phases. These metrics capture both balanced accuracy and the influence of class imbalance, which is crucial in data sets dominated by healthy samples. Cross-validation enhances the reliability of results, while L2 regularization mitigates overfitting and promotes training stability.
Comparative results indicate that FFT features provide a favorable trade-off between accuracy and simplicity. They maintain strong performance for low severity faults and stable behavior across varying operating conditions, making them suitable for integration in industrial monitoring systems. Wavelet features offer advantages in non-stationary conditions but require careful design to achieve optimal performance. Raw waveform inputs yield competitive results in consistent environments and are preferable when preprocessing resources are limited.
The main contributions of this paper are threefold:
A comparative analysis of three input modalities for convolutional classifiers;
An evaluation of incipient inter-turn short-circuit detection across all stator phases using a unified training protocol; and
Experimental validation on a physical test setup to assess robustness under domain shifts.
The results provide practical guidance for selecting diagnostic signal representations in predictive maintenance systems aimed at early fault detection, reduced downtime and improved operational safety.
The remainder of the paper is structured as follows: Section 2 describes the signal acquisition process using the FEM model, the experimental setup and the preprocessing stages involving FFT and WTs. Section 3 presents the CNN architecture, training protocol and a detailed discussion of the classification results for both simulated and experimental data. Finally, Section 4 provides concluding remarks and outlines future research directions.
2. Signal acquisition and processing
The data acquisition process was conducted using a detailed finite element method (FEM) model of a three-phase induction motor, enabling precise simulation and incorporation of inter-turn short-circuit faults (Pietrowski and G’orny, 2024). This approach allowed the generation of current waveforms representative of both healthy and faulty operating conditions.
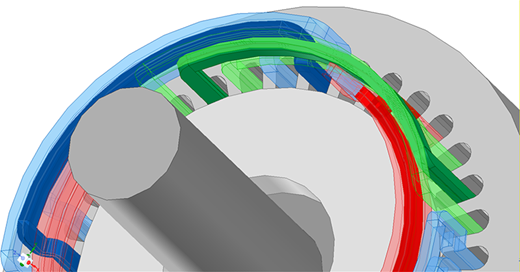
A two-dimensional (2D) and three-dimensional (3D) finite element model of a 3 kW, 400V, 50 Hz squirrel-cage induction motor 3SIE100L-4B was developed using Ansys Maxwell software, using the geometry shown in Figure 1.
The field-circuit coupling ensured consistent computation of phase currents at each time step based on the solution of Maxwell’s equations. The magnetodynamic behavior in the A–V formulation is described by:
where is the magnetic vector potential, V represents the electric scalar potential, denotes the magnetic reluctivity, is the conductivity and is the source current density.
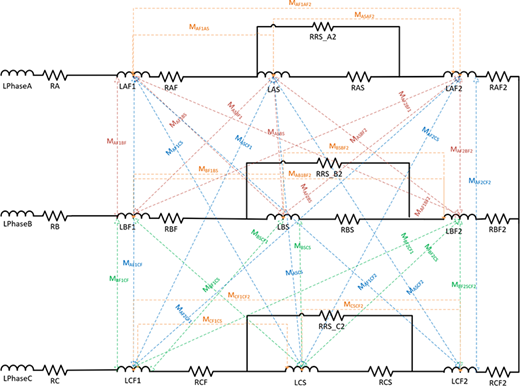
Each stator phase consisted of six coils connected in series, with 30 turns per coil. In the implemented model, each phase winding was divided into a healthy portion and a faulted portion, represented by separate resistance and inductance branches as illustrated in Figure 2.
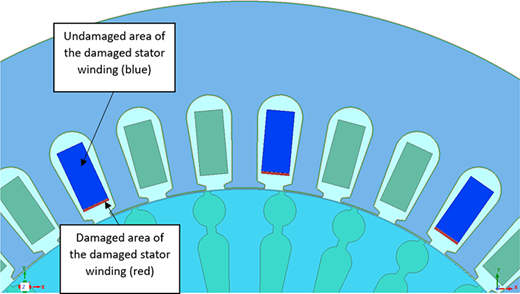
This configuration made it possible to simulate multi-phase inter-turn short-circuits of variable severity in any phase. Figure 3 presents the implemented procedure for modeling the physical location of these faults within the FEM framework.
The electrical dynamics of the stator winding are governed by the voltage balance equation:
where is the terminal voltage, is the stator resistance matrix, is the phase current vector and is the flux linkage. Furthermore, the mechanical dynamics of the system are defined by the equation of motion:
relating the electromagnetic torque , load torque , rotor inertia J and angular speed .
The FEM model incorporated nonlinear magnetization characteristics of both stator and rotor cores to account for magnetic saturation effects. Dirichlet boundary conditions () were applied at the outer perimeter of the computational region, approximating an open magnetic boundary. The air gap mesh was refined to a minimum element size of 0.1 mm, resulting in approximately elements for the 2D model and more than elements for the 3D model. Both healthy and faulty operating conditions were simulated, including multi-phase short-circuits with one to ten shorted turns per phase.
To increase the realism of the data set, non-ideal supply conditions were introduced by superimposing higher harmonics (250, 350, 450 and 850 Hz) on the 50 Hz stator voltage. This approach enabled the investigation of diagnostic robustness under distorted supply waveforms, which is a key factor in industrial environments. The simulation results provided time-domain current waveforms, electromagnetic torque and flux linkages, forming a comprehensive data set for classifier training and validation.
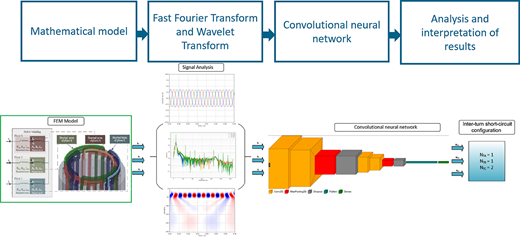
The obtained current signals were then subjected to advanced signal processing methods, including the FFT and the WT. FFT analysis provided insight into frequency-domain characteristics, emphasizing distinctive spectral patterns and fault-related harmonics. In parallel, WT enabled the extraction of transient features and localized time-frequency anomalies, enhancing sensitivity to short-lived phenomena associated with incipient faults. The preprocessing chain, summarized in Figure 4, also included signal normalization and windowing to minimize spectral leakage and ensure consistent amplitude scaling across the data set. The FFT analysis was performed using a Hanning window to reduce spectral leakage, with a window length of points. For the WT, the Morlet mother wavelet was selected due to its effectiveness in capturing oscillating signals, and the decomposition was carried out across 64 scales to match the final image resolution. The sampling frequency for both simulation and experimental measurements was fixed at 10 kHz, with an acquisition window of 10 s per sample, ensuring a high frequency resolution of 0.1 Hz. To ensure a uniform input format for the CNN, all processed signals including raw waveforms, FFT spectra and wavelet scalograms were converted into two-dimensional image representations. Specifically, each of the three stator phase currents () was mapped to one of the three RGB channels of the input image. These images were subsequently rescaled to a fixed resolution of pixels using bilinear interpolation to match the input layer requirements specified in Table 1. This approach allows the CNN to effectively learn spatial patterns and cross-phase dependencies from the multi-channel data.
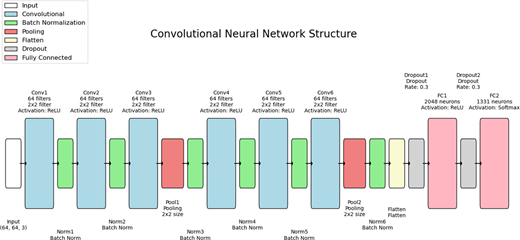
The processed data served as input features for training a CNN. CNNs were selected for their ability to capture spatial hierarchies and complex nonlinear relationships, making them particularly effective for analyzing multidimensional and high-resolution data such as current signal spectrograms and wavelet scalograms. Figure 5 presents the detailed architecture of the CNN model used in this study.
Training of the CNN involved extensive experimentation with various architectures, layer configurations and hyperparameter settings to optimize performance metrics such as precision, sensitivity and F1-score. Cross-validation techniques were applied to ensure the robustness and generalization capability of the trained models. Furthermore, data augmentation procedures –including amplitude scaling, random noise injection and minor temporal shifts were used to expand the data set, improve generalization and reduce the risk of overfitting.
Table 1 summarizes key parameters and configurations of the final CNN architecture, including the number of layers, activation functions and optimization methods used.
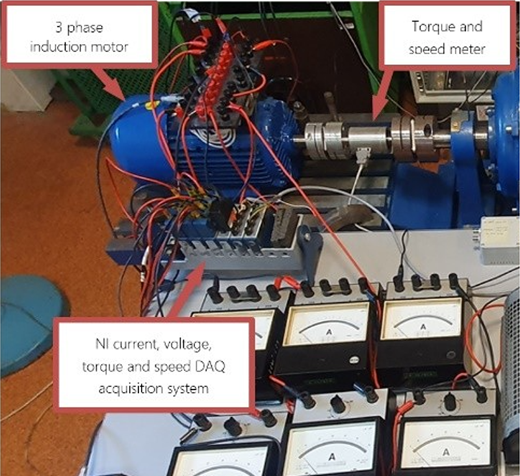
Finally, the trained CNN model was validated using data acquired from a physical test object. The experimental setup consisted of a laboratory test bench with the same 3 kW motor, equipped with dedicated taps in the stator windings to introduce inter-turn short-circuits in a controlled manner. Phase currents and voltages were measured using NI-9247 and NI-9229 acquisition modules operating at a 10 kHz sampling rate, while torque and rotational speed were recorded with an MT100 transducer. Measurements were conducted under both no load and nominal load conditions for healthy and faulted states, using the experimental setup shown in Figure 6.
This validation confirmed that the FEM obtained data accurately represented real machine behavior and that the CNN diagnostic model maintained high classification performance on experimental signals despite measurement noise and minor parameter variations. The consistent results obtained from both simulation and laboratory tests demonstrate the robustness of the proposed model and its potential applicability in industrial predictive maintenance systems. While this study focuses on a specific 3 kW motor model (3SIE100L-4B), the proposed hybrid FEM-CNN framework is designed to be scalable. The use of a high-fidelity FEM model allowed for precise fault injection that would be difficult to replicate across multiple physical machines. Future research will focus on transfer learning techniques to adapt the pre-trained model to different motor power ratings and configurations.
3. Selected inter-turn short-circuit classification results
This section presents selected classification results for inter-turn short-circuit fault detection in stator windings. Three distinct feature extraction approaches were analyzed and compared: raw current waveforms, FFT spectra and WT scalograms. Each method was evaluated under various fault configurations involving inter-turn short-circuits in each phase, with fault severity ranging from one to ten shorted turns.
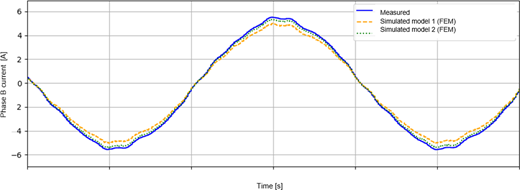
The field-circuit model described in the previous section was first verified through comparison with experimental measurements. Under healthy operating conditions, the simulated phase current waveforms and electromagnetic torque closely matched the measured data. The quantitative validation of the developed FEM models against experimental data is illustrated in Figure 7, showing the phase B current. Two modeling approaches were compared to ensure maximum fidelity. The optimal configuration (Simulated Model 2) yielded a mean absolute error of 0.0697A and a relative error of 2.34% for the phase B current waveform under nominal load conditions, demonstrating excellent agreement with the measured signals.
This agreement confirmed that the finite element model accurately represents the electromagnetic and electromechanical behavior of the real motor. The model also correctly reproduced the slight increase in phase current under load and the expected waveform shape, including minor distortions resulting from magnetic saturation and higher supply harmonics.
After validation, the model was used to generate data sets covering a wide range of fault scenarios. These data sets included single-phase and multi-phase inter-turn short-circuits of varying severity, allowing a systematic assessment of the classifier’s sensitivity. It was observed that for minimal fault severity, such as a single shorted turn, the resulting changes in the current waveform were extremely subtle and often visually indistinguishable from the healthy case (Gyftakis and Marques-Cardoso, 2019). For instance, simulated phase A currents for healthy and one-turn fault conditions nearly overlapped, with fault induced distortions barely visible in the time-domain. This illustrates the inherent difficulty of detecting incipient faults based solely on direct waveform observation. In more severe cases, amplitude variations, phase shifts and spectral sidebands became more pronounced; however, under low severity conditions, these indicators were often masked by measurement noise or supply distortion.
To better reveal fault signatures, the current signals were transformed using Fourier and wavelet methods. Frequency-domain analysis exposed characteristic sidebands around the fundamental component and its harmonics, whereas wavelet scalograms captured transient and localized energy variations associated with fault onset. Nevertheless, at low fault severity, these features were not consistently observable and were frequently obscured by unrelated spectral components. These limitations highlight the importance of data-driven diagnostic techniques capable of automatically identifying subtle nonlinear patterns that may remain undetected through traditional signal processing methods alone.
The performance of the classifiers was evaluated using standard multi-class metrics, including precision, recall and the F1-score. For a one-vs-all (OvA) classification scheme, the following definitions apply for each class k:
where denotes the confusion-matrix entry for samples of class i predicted as class j:
Macro-averaged metrics, which treat all classes equally, are:
Weighted averages account for class imbalance using the class support :
where and N denotes the total number of samples. Macro-averaged metrics provide an overall measure of classifier balance, while weighted metrics reflect performance considering data set class distribution.
The performance metrics presented in Table 2 represent averaged results across all simulated and experimental fault scenarios, including low severity cases with only one shorted turn. These configurations posed the greatest challenge for the classifiers, particularly when using only time-domain waveforms. Notably, FFT features maintained high metric values even for minimal fault cases, indicating their capability to capture subtle frequency-domain deviations introduced by inter-turn asymmetry. Wavelet features exhibited greater performance variability, which can be attributed to the sensitivity of wavelet decomposition to the selection of the mother wavelet, decomposition depth and scale-to-frequency mapping.
The CNN classifier used for this study consisted of six convolutional layers with ReLU activations, followed by one dense layer and an output layer. The model input was the two-dimensional three-channel RGB image tensor () constructed from the preprocessed phase currents, ensuring topological consistency across all analyzed input modalities. Hyperparameter optimization was performed through a grid search strategy. Among the tested optimizers such as SGD, RMSProp and Adam, the latter consistently achieved the best convergence and generalization. With Adam and a learning rate of 0.0001, the CNN reached an average precision of approximately 81% in the multiclass classification task, demonstrating a slight but consistent performance advantage over other configurations. This improvement was accompanied by smoother training curves and reduced validation loss oscillations, confirming that adaptive learning rate methods are advantageous for complex diagnostic data sets.
The effects of learning rate magnitude and dropout regularization were also examined. Lower learning rates improved final accuracy at the cost of longer training, while moderate dropout (around 0.1) effectively mitigated overfitting without impairing generalization. Conversely, higher dropout rates (e.g. 0.3) degraded validation precision by removing too many informative features. Increasing the number of convolutional filters enhanced representation capability but also increased the risk of overfitting when the model became too complex relative to the data set size. Therefore, a balanced configuration was selected to maximize the validation F1-score.
The trained model was evaluated on both simulated and experimental data sets. The confusion matrix showed strong class separation for all but the weakest faults, with correct classification rates exceeding 90% for multi-turn short circuits and above 70% even for single-turn faults. These results confirm that the network successfully learns discriminative features corresponding to physical distortions in the current waveforms caused by localized short circuits. Importantly, the model generalized well to real measurement data despite being trained primarily on simulation-derived signals, demonstrating robustness to measurement noise and small parameter discrepancies between the physical and numerical models.
Additional analysis was carried out to evaluate the influence of input data representation. Although FFT and WT inputs explicitly encode frequency and time-frequency information, the CNN trained directly on raw waveforms achieved comparable results to FFT inputs under controlled, stationary conditions. However, across varying operating conditions and low-severity faults, FFT features remained more stable. This finding suggests that the network can internally extract relevant spectral and temporal patterns without explicit preprocessing. Consequently, a fully end-to-end architecture that accepts unprocessed current signals may be preferable for practical implementation due to its lower preprocessing complexity and real time applicability.
The results further indicate that using multi-phase current inputs helps suppress false alarms caused by noise or supply disturbances, since real faults introduce characteristic phase relationships that differ from common mode interference. The classifier exhibited resilience to typical laboratory noise sources, including inverter switching ripple and sensor quantization effects. This robustness can be further enhanced through data augmentation, where synthetic noise and random waveform perturbations are added during training to emulate field conditions (Chang et al., 2022).
Overall, the CNN diagnostic framework delivered consistent and interpretable classification results across all feature extraction methods, with FFT input offering the best balance between accuracy and computational efficiency (Xie et al., 2024). The average inference time for the developed CNN model is approximately 5 ms per sample on a standard workstation equipped with an Intel Core i9-9900K CPU and an NVIDIA RTX 2080 Ti GPU, which confirms its suitability for real-time industrial condition monitoring. The network effectively identified both single and multi-phase faults without requiring specific test conditions such as start-up or no load operation.
The performance metrics in Table 2, together with the confusion matrix analysis, demonstrate that the proposed AI diagnostic approach significantly enhances sensitivity to early stage stator winding degradation. These findings are consistent with experimental observations and confirm the suitability of the finite element data generation method.
Despite minor variations between feature extraction techniques, all three approaches achieved F1-scores above 0.79, confirming the robustness of the classification system. The consistent accuracy across phases indicates reliable generalization and suggests that the trained network could be integrated into industrial monitoring systems for continuous condition assessment.
Future work will focus on hybrid feature fusion, combining time-domain and frequency-domain representations within a unified neural architecture to further improve fault separability. Additional research will also explore lightweight model variants suitable for embedded diagnostics in drive controllers. The presented results establish a solid foundation for developing intelligent, non-intrusive monitoring systems aimed at enhancing the reliability of induction motors.
4. Conclusions
The conducted analysis confirmed that advanced signal processing techniques noticeably influence the performance of fault diagnosis models, particularly in terms of precision, recall and F1-score. Among the evaluated approaches, FFT feature extraction provided highly consistent and stable results in identifying and classifying inter-turn short-circuit faults compared with time-domain waveforms. Although waveform data alone demonstrated reasonable diagnostic capability, the frequency-domain information obtained from FFT analysis improved fault separability and led to higher recall and F1-score values in CNN classification. In contrast, the WT, despite its theoretical advantage in capturing transient phenomena, produced comparatively lower performance metrics in this study. Nevertheless, further refinement of CNN architecture and hyperparameter optimization may enhance the diagnostic potential of wavelet features. Overall, FFT appears to be the most effective signal processing method for CNN diagnostics of induction motor faults, offering a favorable balance between classification accuracy and computational efficiency. These findings emphasize the importance of selecting appropriate feature extraction techniques when developing reliable predictive maintenance solutions.
This study introduced a comprehensive diagnostic methodology for detecting stator winding faults in induction motors by combining a high-fidelity finite element field model with a DNN classifier. The hybrid approach enabled the generation of a diverse data set covering both healthy and faulty operating conditions, including single and multi-phase inter-turn short-circuits of varying severity. The close agreement between simulated and experimental data validated the accuracy of the FEM model and confirmed its suitability for training AI diagnostic systems.
The trained CNN demonstrated the capability to detect early stage inter-turn faults that cause only subtle distortions in current waveforms. By automatically learning hierarchical features from the input data, the CNN effectively differentiated multiple fault classes without the need for manual feature extraction or expert interpretation. This represents a major improvement over conventional model driven or rule based diagnostic methods, which rely on predefined indicators and are often sensitive to changes in operating conditions.
The main findings of this study can be summarized as follows:
High-fidelity field models of three-phase induction motors accurately reproduce the electromagnetic effects of stator winding faults and provide a reliable source of synthetic data for AI training.
Deep CNNs are effective classifiers for inter-turn short-circuit faults, achieving high precision and robustness in distinguishing multiple fault severities across all stator phases.
Raw time-domain current signals are sufficient for accurate classification; however, FFT preprocessing delivers a modest but consistent improvement in recall and F1 and greater stability across operating conditions. WT can help in non-stationary regimes but was more sensitive to parameter choices in our study.
Proper hyperparameter tuning, particularly the use of the Adam optimizer with a low learning rate, proved essential for achieving optimal accuracy and convergence. Balanced architectures provided the best generalization, whereas excessive model complexity led to overfitting.
The proposed diagnostic system is noninvasive, relies solely on standard current measurements available in most drive systems, and operates under normal steady state conditions without interrupting machine operation.
These results confirm the practicality of deep learning methods for fault detection in industrial drives, where early fault identification can minimize downtime and prevent costly failures. Moreover, the demonstrated ability of the model to generalize from simulation to experimental data shows that physics based modeling can effectively complement data driven learning, reducing the need for extensive experimental campaigns.
Future work will focus on improving classification accuracy for the most challenging cases, particularly single turn incipient faults, by extending observation windows or incorporating additional sensing modalities such as vibration or stray magnetic flux. Another promising direction involves expanding the diagnostic framework to include other fault types, such as rotor bar damage and bearing wear, and applying transfer learning to adapt pretrained models across different machines. Finally, embedding lightweight CNN architectures into real time monitoring systems and incorporating interpretability techniques such as signal attribution or layer-wise relevance propagation could bridge the gap between high-performance machine learning models and industrial reliability requirements, paving the way toward intelligent, explainable and autonomous condition monitoring systems.