In the current literature, there is little systematic research on the relationship among adjustment of the income distribution, change in economic structure and improvement of macroeconomic efficiency.
This paper expands Marx's reproduction schema into the “Marx–Sraffa” three-department structure table comprising fixed capital, general means of production and means of consumption and employs China's input–output table from 1987 to 2015 to portray the relationship between income distribution and macroeconomic efficiency under investment-driven growth.
This paper calculates the wage–profit curve of China's economy and evaluates the space of macroeconomic efficiency improvement in China based on the deviation between actual and potential income distribution structure.
The results show that there is a downward trend of the profit rate, which meets Marx's theoretical prediction, and the decline in the profit rate is mainly attributed to an increase in the organic composition of capital arising from the rapid growth of fixed capital investment under extended growth. The analysis of macroeconomic efficiency shows that the space for improving macroeconomic efficiency is extremely limited under traditional growth pattern and that China must transform its economic development pattern and foster new economic growth drivers.
1. Problem introduction
The report to the 19th National Congress of the Communist Party of China has pointed out that “socialism with Chinese characteristics has entered a new era and the principal contradiction in Chinese society has evolved into the contradiction between unbalanced and inadequate development and the people's ever-growing needs for a better life”. On the one hand, the profound change in principle social contradiction urgently requires China to focus on supply-side structural reform, push for change in quality, change in efficiency and change in growth drivers of economic development, and improve macroeconomic efficiency. On the other hand, after the previous wave-style consumption stage is essentially over, China should promote more reasonable, more orderly income distribution, cultivate new economic growth points in medium- and high-end consumption fields and better boost the basic role of consumption upgrade in economic development. How to build a theoretical framework that systematically studies the relationship among the structural adjustment in income distribution, economic structural change and macroeconomic efficiency improvement based on fundamental principles of Marxist political economy so as to measure and evaluate the change in China's macroeconomic efficiency is an important task of innovating and developing Marxist political economy in the new era.
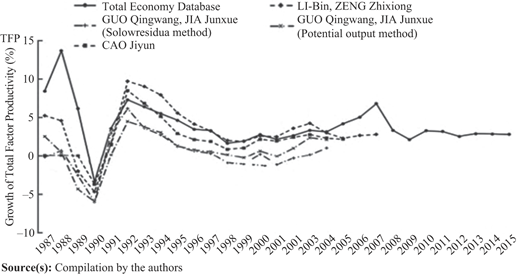
The efficiency and potential growth rate of China's economy is a key area of economic research. The prevailing research approach is to employ various methods to calculate the total factor productivity (TFP) of China's economy based on the neoclassical economic growth model and use this figure as the basis for evaluation of economic efficiency and potential growth rate (Guo and Jia, 2005; Cao, 2007; Yi et al., 2003; Li and Zeng, 2009; Chen and Yao, 2012; Liu and Chen, 2013; Lu and Cai, 2016). However, subject to calculation methods and data, the calculation results of TFP are inconsistent (see Figure 1) [1]. Also, the prevailing calculation methods do not take into consideration the impacts of macroproduction structure and income distribution structure on TFP, and this deficiency often needs to be filled up in combination with other economic concepts. This is because the theoretical basis of TFP is the “residual value” of economic growth accounting after deduction of the contribution of various production factors and incorporates several factors like efficiency, technical progress and institutional change (Zheng, 1999). To shift from a high-speed growth stage to a high-quality growth stage under the guidance of the new development philosophy, China should strengthen the coordination between supply-side structural reform and income distribution improvement and continually improve the efficiency of economic operation and ability to meet the people's needs. Therefore, there is a need to set up a theoretical framework that can accurately measure the macroeconomic efficiency against the background of adjustment of income distribution structure and change in the production structure and can provide guidance for feasible empirical studies.
The two-department reproduction schema involving means of production and means of consumption initiated by Karl Marx in Part 3 of Volume II of Das Kapital (Marx, 2004) is the basic framework of political economy to analyse macroeconomic operation, production structure and income distribution issues (Dong, 1980; Xue, 1988). First of all, the macroclassification of basic economic structure into two departments based on use value not only provides ideas leading to the solution of the structural compensation issue in the macroeconomics but also elucidates the mechanism of macroeconomic structure acting on national economic operation at the most general level. Furthermore, at the value level, the wage derived from the transformation of variable capital and the profit derived from the transformation of surplus value are the most important determinants of the national income distribution structure, and they are also the basic sources of household consumption and enterprise investment in total social demand. Their total quantity and structure are determinants that impact on the realisation of aggregate social product and macroeconomic operation. In recent years, some scholars have applied China's macroeconomic data and provincial-level panel data in their empirical studies based on this theory. They find that the changing trend of economic structure and income distribution structure generally meets the theoretical expectation of Marxist political economy, which reflects the ability of the two-department reproduction model to explain and predict the actual economy (Zhao and Li, 2017; Li, 2017).
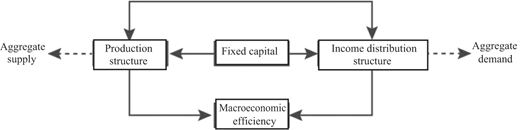
However, Karl Marx did not go into depth into the following two issues: First, production and reproduction of fixed capital not just impact on short-term technical conditions of production and macroeconomic efficiency but also has a significant impact on long-term change in production structure. However, this has not yet been fully reflected in the two-department reproduction schema. Second, when Marx discussed the long-term growth of the capitalist economy in Volume II of Das Kapital, an underlying assumption was that resources were fully utilised (Marglin, 1984; Dutt, 1990). However, in Volume III of Das Kapital, Marx pointed out that the inherent contradiction of capitalist distribution structure will lead to relatively surplus population and capital (Marx, 2004) and did not further discuss how to ease this contradiction by adjusting the income distribution structure. In Volume II of Das Kapital, Marx initially discussed the impact of fixed capital compensation and replenishment on reproduction (Marx, 2004), thus impacting short-term fluctuation and long-term structural change of an economy (Li and Zhao, 2017). Therefore, the expansion of the classical two-department reproduction schema to the three-department reproduction schema consisting of fixed capital, general means of production and means of consumption not only helps us to understand the action mechanism of production structure in improving macroeconomic efficiency but also helps us to understand the effect of change in income distribution structure on macroeconomic efficiency (see Figure 2), forming an analytical framework of political economy for aggregate supply and aggregate demand.
Based on the foregoing research approach, this paper tentatively puts forward a quantitative macroeconomic efficiency model of political economy, and its main contributions cover the following three aspects: First, this paper develops a three-department dynamic general equilibrium model, expands the classical reproduction theory of Marxist political economy and provides a theoretical framework to study the relationship between production efficiency and structural change. Second, based on the above model, this paper sets up an index for measuring and calculating macroeconomic efficiency, thus boosting the applicability of political economy in monitoring actual economic operation status and evaluating the macropolicy effect. Third, this paper uses China's input–output tables to calculate macroeconomic efficiency from 1987 to 2015. The calculation results prove that the space for improvement of macroeconomic efficiency is very limited under the traditional growth pattern and that we should strengthen the coordination of income distribution perfection, production structure optimisation and macroeconomic efficiency improvement in order to foster new economic growth drivers.
The following chapters of this paper are arranged as follows. Chapter II addresses the conversion of input–output tables into the three-department table, which consists of fixed capital, general means of production and means of consumption, based on Marx's two-department reproduction schema. In Chapter III, under the conditions of joint production and wage advance, the authors find the equilibrium solution of the three-department producer price system and then calculate the wage–profit curve reflecting the optimal income distribution relationship and the actual coordinates of China's economy to evaluate the dynamic change in China's macroeconomic efficiency. The last chapter is about the conclusions and prospects.
2. From input–output table to three-department table
The two-department reproduction schema is an important macroresearch tool of Marxist political economy. The first problem to be solved in applied research is how to convert the current national economic accounting system into the accounting system corresponding to the political economy. The simplified classical Marxist economic model has proven that the input–output table (balance sheet of the national economy) can be transformed into the two-department reproduction schema (Nemchinov, 1980; Lange, 1980), and this is the inspiration for the construction of the three-department table in this paper. Theoretically speaking, the theoretical basis of the input–output table is the model of Leontief (1941, 1986), which dates further back to physiocrat Quesnay's economic table (Phillip, 1955) and Marx's reproduction schema (Pasinetti, 1977). In the late 20th century, some economists successfully transformed the sectors of the input–output table into the two-department model under the guidance of Marx's reproduction theory, exploring a new field in which the scholars of political economy employ the national economic accounting system to study macroeconomic structure and growth issues (Koshimura, 1984; Fujimori, 1992a) and thus providing a methodological basis for the further expansion into the three-department table that includes a separate fixed capital department.
2.1 Research review and difficulties on fixed capital matters
Fixed capital is distinguishable from general means of production in terms of use value and value, and it influences social production in two aspects, namely the production of aggregate social product and the formation of the total product of society as follows. First, the input of fixed capital requires a relatively long period for forming productive capacity, during which a positive effect of aggregate demand for social production comes into being. Second, upon the formation of the productive capacity of fixed capital, the fixed capital capacity will immediately improve social productive capacity, and such improvement is not at a constant speed but by leaps and bounds. Third, the fixed capital investment and capacity formation represent a specific technical level of advanced production and can strongly jump-start or promote the production and utilisation of downstream and upstream circulating constant capital in terms of demand and supply. How to integrate the impacts of fixed assets into a formalised economic growth model is always a difficult problem for the traditional growth theory of the political economy: on the one hand, building a theoretical model requires relatively complicated mathematical skills; on the other hand, empirical tests require relatively complicated methods for re-estimating fixed capital stock.
Unlike general means of production, fixed capital mainly exists in the form of the means of labour like plant, machinery, equipment and tools. Its value is not transferred in a one-off manner but is gradually transferred with depreciation during the production. In Volume II of Das Kapital, Karl Marx initially discussed the characteristics and impacts of fixed capital in the movement of individual capital and aggregate social capital. Sraffa (1960) proposed a method of differentiating fixed capital based on age or service length. Okishio and Nakatani (1975), Fujimori (1982), Schefold (1989) and Kurz and Salvadori (1995) followed and further developed this method and discussed the fixed capital issue under a general theoretical framework of the Marxist economy to conduct systematic analysis and definition of this matter.
For the empirical study of fixed capital from the perspective of political economy, the first problem to be solved is the lack of fixed capital stock data of multiple sectors. Although domestic scholars have achieved fruitful results on the research regarding fixed capital stock data (Wang and Wu, 2003; Zhang and Zhang, 2003; Shan, 2008; Xu et al., 2010; Li, 2011), those studies are restricted to estimates of aggregate fixed capital and can be hardly applied to the multi-sector model. In view of this, Fujimori (1992b) proposed a marginal method for estimating the fixed capital input coefficients based on the table of Japan's multi-sector input and output from 1970 to 1980 and the fixed capital investment matrices. On this basis, Li (2014) estimated China's fixed capital input coefficients for the first time by utilising China's input–output tables from 1987 to 2000 and China's fixed capital investment matrix data estimated by Lü (2007), which provided insights into the multi-sector empirical research. Besides, setting fixed capital as a separate department and obtaining three-department fixed capital input matrix data can solve the problem that China's input–output tables lack investment matrix data [2].
2.2 Construction method of the three-department table
Assuming that the shares of the product that sector inputted into the three departments are respectively, the computational formula is as follows:
where stands for input by sector i into sector j; for the consumption of final demand, fixed capital formation and increase in stocks of sector i, respectively, and for domestic aggregate demand. Then, without the consideration of international trade, and obviously .
In the three-department table corresponding to the input–output table, are used to stand for fixed capital depreciation, the input of general means of production and aggregate output of the three departments, respectively, and the subscript are for the departments. Detailed calculation formulas are as follows:
In this formula, and respectively, stand for depreciation of fixed capital and aggregate output of sector i, and are for profit and wage in the input–output table, respectively. Then, the profit and wage of the three departments, that is , are calculated as follows:
Capital formation , gross capital formation S, accumulation of general means of production K and consumption C of the three departments can be, respectively, expressed as follows:
Then, by extending these models to the open economy and using to represent the net export of the three departments, we can obtain the three-department table (see Table 1). Through equation (7), we can obtain the three-department investment matrix and the proportion of net fixed capital in gross fixed capital, which can be calculated as ( for average depreciation life of fixed capital and for growth rate). Then, the fixed capital input coefficient of the three departments can be calculated as [3]:
Therefore, we can use the input–output table to determine the fixed capital input coefficient of the three departments. The following chapter will address the empirical analysis of the income distribution structural relationship of macroeconomy by using the three-department table and fixed capital input coefficient.
3. Income distribution structure and macroeconomic efficiency of China's economy
In this chapter, the authors first examine the optimum relationship between production and distribution when China's social reproduction reaches equilibrium under existing technical and distribution systems, which is shown in a wage–profit curve, and then calculate actual coordinates of wage and profit. Through the calculation of the deviation of actual coordinates from the wage–profit curve, the authors evaluate the index of macroeconomic efficiency loss and examine the optimisation direction of China's economic structure and efficiency.
3.1 Theoretical model
With reference to the practice of Li (2017), we define the producer price system under joint production as follows:
where is input coefficient matrix, output coefficient matrix, average profit rate and vector the relative producer price between sectors. Each element is a real number and is non-negative [4].
For a certain production process, suppose the depreciation life of fixed capital is , then both are the matrices of . In the meantime, considering the three departments, i.e. fixed capital, general means of production and means of consumption, equation (10) can be spread as follows:
where is wage-goods vector, is actual wage rate and reflects real wages, i.e. workers' demand for consumer goods. Then if the value of , can be obtained by solving the general equilibrium [5]. Based on the correspondence between , we can draw the wage–profit curve reflecting the relationship between production and income distribution. In equation (11), the input coefficient matrix of fixed capital and general means of production of , the wage-goods vector of , and the labour input vector of can be expressed as follows, respectively:
Given an increase in service length of fixed capital involved in the production, we can obtain the output coefficient matrix as follows:
3.2 Calculation process
As drawing China's wage–profit curve requires us to find the equilibrium solution by using the matrix method, we have to calculate or estimate the parameters that constitute input coefficient matrix and output coefficient matrix . In the three-department table, denote the input of general means of production, and the calculation formulas of the coefficients are as follows:
The input matrix of consumer goods depends on the wage-goods bundle and labour input. Among others, per capita wage-goods bundle can be regarded as consumption /total working population . Considering annual total labour time , i.e. the product of the annual total working population and per capita annual labour time , then
, which means wage goods of unit labour, is expressed as follows:
On the other hand, the calculation of labour input shall allow for gross value added , i.e.
The labour time of the unit value is , and the labour time of the three departments is expressed as . Therefore, the labour input required for unit production is expressed as follows:
3.3 Wage–profit curve under equilibrium solution conditions
We can apply the pseudoinverse properties based on the singular value decomposition to the equilibrium equation (11) by right multiplying it with the Moore–Penrose pseudoinverse matrix of output coefficient matrix Then, the following formula is obtained [6]:
It is easy to know that after calculation or estimation, input coefficient matrix is related to actual wage rate . As long as the general equilibrium is solved, we can obtain the correspondence between actual wage rate and profit rate .
With the Leontief input–output model as the object without fixed capital, Hua (1984) proved the “antithetical instability” proposition by finding the characteristic value of the square matrix. Although in more general joint production, both the input coefficient matrix and the output coefficient matrix are non-square matrix systems (that is, columns are larger than rows), the equilibrium problem is of great importance to solving the general equilibrium if we understand equilibrium problems as characteristic value problems and perform the converse of the equilibrium problems by applying Moore–Penrose pseudoinverse properties [7].
where is the characteristic value of the matrix , and price vector is the left eigenvector of the matrix . All elements in the price vector must be real numbers and non-negative. In corresponding characteristic values, there certainly exist non-negative real numbers. We take their maximum value as and then reversely calculate the profit rate by using equation (18).
Before calculation of the wage-profit curve based on the foregoing results, it is necessary to estimate the fixed capital input coefficients of the three departments. We collated the relevant statistical data based on the input–output table, and the result is as follows [8].
As shown in Table 2, fixed capital investment has been continually increasing since the late 1980s, which is especially noticeable in 2007–2010. The trend also shows that the RMB4 trillion fiscal stimulus aimed at coping with the 2008 crisis is of great relevance for fixed capital, and the role of fixed capital input in growth promotion is self-evident. On the whole, in addition to fixed capital, the input of general means of production and means of consumption also went up.
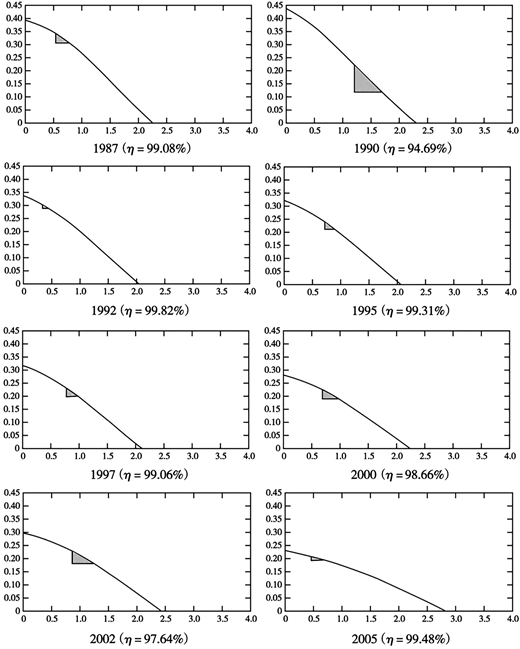
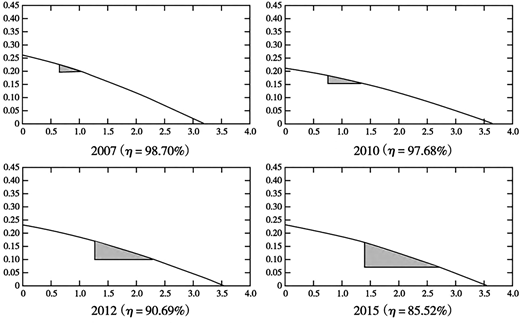
Based on the three-department table, wage–profit curves for 1987–2015 can be drawn (see Figure 3). It is not difficult to find that the profit rate gradually declines as the actual wage rate increases. In other words, there is a strictly negative correlation between them. Undoubtedly, this result is consistent with Marx's opinion that the generation of absolute profit depends on surplus labour and surplus value. Also, all wage–profit curves of China's economy in 1987–2015 show linear relationships.
The research of the practical significance of the intercept and slope of the curve is also one of the keys to interpreting the growth and distribution of China's economy. In the wage–profit curve, let , and we get the vertical intercept , i.e. the maximum profit rate when the actual wage rate is zero, which corresponds to Sraffa's standard factor (Fujimori and Li, 2014); let , and we get the vertical intercept , i.e. the maximum actual wage rate when the profit rate is zero. The results show that the maximum profit rate trends downward but the maximum actual wage rate trends upward in 1987–2015. On the whole, this corresponds to the development trend of China's economy. Specifically, the economic “soft landing” policy put forward by China in recent years means an orderly downward adjustment of growth rate, which will in turn directly lead to a decline in profit rate and an improvement of the actual wage rate. Nevertheless, judging from the maximum actual wage rate , the actual wage rate still has much room for improvement. Conversely, a significant improvement of the actual wage rate contributes to an economic soft landing.
The wage–profit curve of China's economy from 1987 to 2015 can be considered an approximate straight-line curve; therefore, we can calculate its slope based on the values of intercept:
Table 3 shows that slope has gradually decreased over the years. On the one hand, the straight line as a whole gradually approaches the bottom left; on the other hand, this also depicts a gradually weakening of sensitivity of the change in profit rate to the change in actual wage rate . Therefore, the change in slope, i.e. the downward trend of the profit rate, is the result of the long-term effect of depreciation and a reflection of the fact that the influence of actual wage rate on the profit rate tends to become insignificant.
The relationship between profit and wage is a zero-sum relationship on the frontier, but this is not true within the frontier. In the past, the increase in profit rate came from the production of relative surplus value and the production of absolute surplus value of relatively lagged wage. However, with the income distribution reform in recent years, the latter has hit a bottleneck. Therefore, the supply-side reform was relied upon to boost the efficiency and production of relative surplus value. Of course, the frontier movement reflects a change in the potential growth rate. How to measure such change will be the key to quantifying technical progress from the perspective of political economy.
3.4 Calculation of the actual coordinates of China's economy
Using gross domestic product and gross wage of employed persons based on the data from the National Bureau of Statistics, the gross profit is calculated as follows:
According to the definition of accumulation rate , i.e. the ratio of surplus value used for capital accumulation to gross surplus value, the following formula can be obtained:
Calculate the actual profit rate by using the Cambridge equation:
where is the actual economic growth rate (the data are taken from the National Bureau of Statistics). Through the calculation of , the corresponding can be obtained by finding an inverse solution. After standardisation, , where the item in requiring calculation is the wage-goods rate per unit of labour:
Through the above calculations, actual coordinates of China's economy in 1987–2015 are obtained.
As shown in Figure 3, there are apparent differences among the distances from the actual coordinates to the curves, which reflects a loss of macroeconomic efficiency. Such loss can be represented by the area of the shaded region, expressed as follows:
Likewise, assuming the actual coordinates are , the total loss when the efficiency is 0 is as follows:
Therefore, macroeconomic efficiency can be defined as follows:
The value in the above equation reflects the degree of realisation of the optimum distribution structure of wage and profit under given production technical conditions. This value which reflects not only the production structure but also the income distribution structure can indicate the macroeconomic efficiency of aggregate supply and aggregate demand in a more comprehensive manner. In contrast, the prevailing TFP calculation measures the degree of realisation of the maximum output level under given technical conditions, which only reflects the efficiency of the production structure, i.e. aggregate supply, and fails to reflect the efficiency of the income distribution structure, i.e. aggregate demand. Therefore, there is an essential distinction between calculated above and the prevailing TFP calculation, and they have different economic and policy implications.
Based on the calculation of equation (27) (see Table 4 for the results), the average of macroeconomic efficiency indexes in 1987–2015 is , and the figure is above in most of the years. In other words, efficiency loss is generally below . In addition, the variation of ranges from (2015) to (1992), and its standard deviation is 0.04, which indicates that this metric has small fluctuations and high sensitivity for monitoring macroeconomic efficiency.
According to the calculation results, since the late 1980s, China's macroeconomic efficiency has generally stayed at high levels, thanks to a relatively high degree of matching between its production structure and income distribution structure. However, since 2007, China's macroeconomic efficiency has slid noticeably, which indicates an imbalance between the production structure and income structure. Thus, improving macroeconomic efficiency requires a rebalancing of production and income structures, providing a theoretical and empirical basis for adjusting aggregate macrosupply and aggregate demand in China.
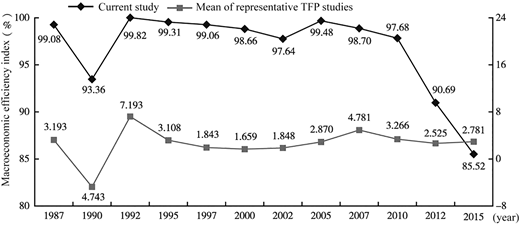
Comparing the results in this paper with those of the representative TFP studies (see Figure 4), it can be found that from 1987 to 2010, the macroeconomic efficiency calculated based on the three-department reproduction schema is broadly consistent in trend with the results of prevailing TFP calculation, indicating that the quantitative macromodel of political economy also has the explanatory power for real economic problems. In addition, as the prevailing TFP calculation results are “residual values”, their absolute values are not economically meaningful. In contrast, the macroeconomic efficiency calculated in this paper is the degree of convergence between the actual coordinates and the optimal boundary, so its absolute value is comparable. Therefore, in addition to being used for trend analysis like TFP, can be used for efficiency evaluation at given time points, which is not possible for TFP, and thus allows real-time monitoring of the macroeconomic climate. The results of TFP calculated according to the prevailing methodology show that the efficiency of China's economy has been largely stable since 2010, from which it is difficult to discern changes in the structure and stage of development of China's economy. However, according to the results calculated in the theoretical model of this paper, China's economy has experienced a significant decline in macroeconomic efficiency from 2010 to 2012 and has continued to decline since then, showing a clear break point from the long-standing macroeconomic efficiency previously maintained. A further analysis shows that a main cause of the decline in China's macroeconomic efficiency is that China experienced a decline in capital profit rate and an increase in actual wage rate within the same period (see Table 4). Possible explanations for these phenomena are as follows: After the emergence of “Lewis Turning Point” in China during this period, gradual loss of demographic dividend and heightened labour protection policies led to an increase in the actual wage rate, and, without an unlimited supply of labour, the law of diminishing marginal return of capital began to manifest itself, resulting in the decreased capital profit rate [9]. In summary, this metric provides relatively adequate explanations concerning changes in China's macroeconomic efficiency and reasons for such changes from the perspective of income structure adjustment.
4. Conclusions and future work
Following the fundamental principles of Marxist political economy, the degree of matching (considering fixed capital) between the production structure and income distribution structure has a critical impact on macroeconomic efficiency. Through the development of the classical Marxist two-department reproduction schema into a three-department reproduction model, this paper puts forward a quantitative macromodel of the political economy, thereby providing a feasible analysis framework for systematic research into macrostructure adjustment and efficiency change. By conducting an empirical study into the matching relationship between China's production structure and income distribution structure based on the converted input–output tables, we examined the changes in macroeconomic efficiency since the late 1980s. Research results show that China's macroeconomic efficiency generally stays at high levels, indicating that macroeconomic structure adjustment is basically consistent with efficiency change and partly explains the long-term high growth of China's economy. This paper shows that Marxist political economy is also applicable to the research of economic climate monitoring and long-term structural change in macroeconomic operation. This is perhaps one of the directions in which we will develop and innovate the Marxist political economy in the future.
This research has the following policy implications. First, by observing the experience of more than 30 years' development, it can be concluded China's adherence to synchronous adjustment of supply-side production structure, and demand-side income distribution structure is a critical pillar of China's sustained high macroeconomic efficiency. As changes in principle social contradiction take place after the socialism with Chinese characteristics enters into a new era, amidst the trend towards an emphasis on the solution of unbalanced and inadequate development issues, the policy focuses aimed at preparing for the future should be to treat the improvement of income distribution structure as the leading force, boost the basic role of consumption upgrade in promoting the adjustment and optimisation of production structure and maintain the smooth and efficient operation of the macroeconomy. In particular, given a growing trend of reverse globalisation, China should attach greater importance to the role of domestic demand in structural adjustment and efficiency improvement than ever before, boost domestic demand through adjustment and optimisation of income distribution structure and achieve a benign interaction between the people's universal enjoyment of the fruits of development and long-term growth. Second, given that production and reproduction of fixed capital impact on production structure and income distribution structure and thus change macroeconomic efficiency, during China's transition from a high-speed growth stage to a high-quality growth stage, China should strengthen the efforts in identification of new fixed asset investments required to support the construction of a modernised economic system and then promote the construction of leading industries and infrastructure adapted to the new economy through an effective combination of fiscal, financial and industrial policies, so as to strengthen the economic foundation for maintaining macroeconomic efficiency in the coming period. Third, by extending the research ideas of this paper, future studies can take advantage of the International Input–Output Association's input–output table data for conducting international comparative research on macroeconomic efficiency and changes in macroeconomic efficiency, thereby better identifying China's economic development stage and providing suggestions for developing better production and distribution systems.
Due to limitations in the availability of research data, the three-department table analysis framework proposed in this paper is based on input–output tables of discontinuous years, and its robustness needs to be verified over continuous time series. In addition, this paper adopts a simplified method for physical depreciation life in various industries, and further in-depth study of the impact of depreciation life on economic operation will help to reveal its economic implication. These issues will be important research directions of quantitative macroanalysis of the Marxist political economy.
The work described in this paper is funded by the National Social Science Fund of China (NSSFC) (No. 17BJL020), Youth Program of NSSFC (No. 14CJL007), Youth Program of National Natural Science Foundation of China (No. 71503261) and “Future Scholars” plan of Tsinghua University Initiative Scientific Research Program (No. 20181081165). This paper was included in the 18th China Young Economists Forum. The authors appreciate anonymous reviewers' valuable opinion and take sole responsibility for their views.
Funding: This paper received funding from the National Social Science Foundation (grant agreement No. 17BJl020, 14CJL007) , National Natural Science Foundation (grant agreement No. 71503261) and the “Future Scholars” program of Tsinghua University (grant agreement No. 20181081165).
Notes
Total Economy Database™. Growth Accounting and Total Factor Productivity, 2017.
While preparing their input–output tables, the USA and Japan also prepare and publish their fixed capital investment matrix data. In contrast, China publishes the former only.
Here is determined by the maximum characteristic value 1 (i.e. Perron–Frobenius root) in (i.e. coefficient matrix in the Sraffa standard system), where is the depreciation rate of fixed capital prescribed by the annuity depreciation method (Li, 2017).
It is noted that equation (10) can be spread as , among which is the value of aggregate social product, is the sum of constant capital and variable capital and is surplus value. Therefore, equation (10) is still a value-based producer price system. For more information, please refer to Morishima (1973), Okishio (1977). We appreciate anonymous reviewers' opinions.
The solving process will be described and proven hereinbelow.
For detailed demonstration of the equivalence relation between equation (10) and equation (17), refer to Li (2017).
For instance, the widely applied “Okishio-Nakatani” method (Okishio and Nakatani, 1975) simplifies the “Marx–Sraffa” system that includes old fixed capital as the Leontief popularisation system incorporating new fixed capital only, and the application of Moore–Penrose pseudoinverse is extremely effective. However, the “Okishio-Nakatani” method is still restricted to a coefficient matrix of specific input and output and is not applicable to more general joint production. Through application of Moore–Penrose pseudoinverse in this paper, the characteristic value thus obtained is consistent with the optimal solution of linear programming, and this approach is superior to the “Okishio-Nakatani” method in terms of universality and convenience of application.
Because the estimation of is relatively complex, the current study directly adopts the three-department fixed capital input coefficient data presented in the working paper of Li (2015), Fixed capital, investment drive and potential growth rate of China's economy, without making specific explanation.
According to Cai (2015, 2018), the rationale for China's high-speed economic growth after reform and opening up is that surplus labour is converted into a cheap factor, and abundant labour restricts the decrease of marginal returns of capital so that capital and economic growth can be realized with increased input. However, with the depletion of original technical potential and demographic dividend, the law of diminishing marginal returns of capital begins to take effect and the existing surplus-value production system and accumulation system trends toward depletion. This situation urgently calls for structural transformation that boosts the quality of economic development and establishes systems for high-level relative surplus-value production and accumulation.