Owing to the growing evidence of crypto asset connectedness and correlation with traditional financial assets, this study sought to determine if there is a time-varying correlation and/or connectedness between the stablecoin market and the currencies of emerging market and developing economies (EMDEs) with significant cryptocurrency penetration.
This study uses a probabilistic principal component analysis (PPCA) to create stablecoin and EMDEs currency returns and volatility indices for EMDEs with significant cryptocurrency penetration. We then employ a time-varying correlation and time-varying parameter vector autoregressive (TVP-VAR) connectedness measures to document the time-dependent correlation and connectedness between the EMDE currencies and the stablecoin market.
The result points to a spillover of return shocks from the EMDE currencies to the stablecoin market prior to and after the COVID-19 pandemic. This is indicative of a flight-to-safety role of stablecoins for EMDE currencies. This calls for increased attention to the stablecoin market by money market investors and monetary authorities.
The paper contributes to the growing cryptocurrency and finance literature by empirically examining the level of connectedness between stablecoins and emerging market currencies. Knowing the relationship (correlation) and shock spillover (connectedness) between the stablecoins and the EMDE currencies will be valuable to currency investors’ diversification and hedging strategies, and to macroeconomic policymakers in designing and implementing regulation.
1. Introduction
While stablecoins and cryptocurrencies in general have been heralded for their potential role in financial inclusion, voices of caution also abound, with Feyen, Frost, Natarajan, and Rice (2021) noting that global stablecoins could pose challenges to emerging and developing economies (EMDEs). These challenges are grouped into developmental, macroeconomic and cross-border challenges. Among these challenges, the more serious risk is on the macroeconomic front. Stablecoins as global currencies pose volatility spillover risk to EMDE currencies and could result in EMDE monetary authorities losing control over monetary policy (Feyen et al., 2021; He et al., 2022).
The Financial Stability Board (2024) admits the high penetration rate of cryptocurrencies in EMDEs and the monetary and capital flow management challenges that it poses. The implications of stablecoins for EMDEs were also discussed, with plans outlined to undertake further work on resolving these challenges. Anadu et al. (2023) examined the parallels between stablecoins and money market mutual funds (MMFs). They concluded the existence of flight to safety periods in the stablecoin market. These periods entail the movement from risky stablecoins to more secure, asset-backed stablecoins. They also note that stablecoin redemption often increases when a stablecoin trades below its peg (1$ for dollar-pegged stablecoins). Anadu et al. (2023) then cautioned that the connection of stablecoin markets to traditional financial and currency markets could pose financial stability risk owing to the vulnerability of the stablecoin market to runs during crypto-market or idiosyncratic stress.
Owing to this, several studies have sought to document the connections that might exist between financial markets and traditional cryptocurrencies. Specifically, Iyer and Popescu (2023) conclude that there is a growing interconnectedness between crypto assets and financial markets. However, the level and trend of connectedness between the stablecoin market and emerging market currencies is yet to be documented. Specifically, there is no study known to us that empirically examines the implications of stablecoins for emerging market economies, even though their currencies are more likely to be vulnerable to global stablecoin displacement (Feyen et al., 2021). Perhaps the only exception is Garita, Bregni, and Asturias (2024), who conducted a case study on the use of stablecoins in Argentina during the inflation crisis. Their study was mainly descriptive. Some other studies on stablecoins are Hoang and Baur (2024), Galati and Capalbo (2024), Oefele, Baur, and Smales (2024), and Zhang, Choi, Chung, Dai, and Wen (2024). While Hoang and Baur (2024) examined the stability of stablecoins and proposed measures of absolute and relative stability for stablecoins, Galati and Capalbo (2024) examined the contagion from conventional banks to stablecoins during bank panics. Oefele et al. (2024) compared stablecoins and money-market mutual fund (MMFs) and found them remarkably similar. Zhang et al. (2024) theoretically model the impact of retailer’s adoption of cryptocurrency and stablecoin on profitability.
This study seeks to empirically answer whether stablecoins are flight-to-safety assets for the fiat currencies of emerging markets with high cryptocurrency penetration. This is done by examining the time-dependent (contemporaneous) correlation and time-dependent (non-contemporaneous) spillover between the stablecoin market and the EMDE currencies with the highest cryptocurrency penetration. In line with the literature on foreign asset demand and exchange rates, we adopt the working hypothesis that there is a negative relationship between the stablecoin returns and the EMDE currency returns and a positive relationship between the stablecoin volatility and EMDE currency volatility. This is because an increase in the returns of stablecoins will make the stablecoin trade at a premium (above its peg, thus increased returns) and will lead to a decrease in the returns (depreciation) of the local currency. That is, periods of increasing returns of stablecoins should trigger a search for yield (fiat currency substitution for stablecoins) and, thus, a decrease in the demand for the local currency, which will lead to a decrease in its returns (depreciation of the currency) and vice versa. On the contrary, an increase in volatility in the stablecoin market will result in the liquidation of stablecoin portfolios, perhaps back to fiat currencies, which will trigger appreciation of the currency and an increase in its volatility. On the non-contemporaneous relationship (spillover), we hypothesise that EMDE currencies, prone to depreciation and volatility as there are, will often be a source of shocks to the stablecoin market. That is, periods of EMDE currency depreciation (decreasing returns) will often trigger increased demand for stablecoins and stablecoins returns with a lag.
The correlations and connectedness between assets are particularly important for stablecoin investors and currency portfolio managers with EMDE currency holdings by informing their hedging strategies. This will also prove useful to macroeconomic and monetary authorities of emerging markets, who are often wary of global assets (currencies) that increase the risks of local currency substitution.
The empirical findings point to a flight-to-safety role of stablecoins for emerging market currencies prior to and after the COVID-19 pandemic. This implies that except during the pandemic, currency turbulence in EMDE currencies always triggers a flight to stablecoins, which in turn causes turbulence in the stablecoin market.
The ensuing section briefly examines the connectedness literature in finance. This is followed by a section on data and methodology that describes the data, sources, transformations and methods employed to determine the correlation and connectedness. The third section presents the results, and the last concludes the study.
2. Literature review
Intra and inter-market connectedness is always of interest to financial analysts and academics due to the potential value of such knowledge in forecasting and predicting turbulence in related markets. In this regard, the connectedness between financial markets, commodity markets and cryptocurrencies has garnered the interest of analysts and policymakers who hope to find useful information in formulating and improving regulation (Zeng, Yang, & Shen, 2020).
Zeng et al. (2020) employed the connectedness indices of Diebold and Yilmaz (2009, 2012, and 2014) in a vector autoregressive (VAR) framework to examine the connectedness and spillover between and among Bitcoin and the stock markets proxied by S&P 500, global risk proxied by the Chicago Board Options Exchange Volatility Index (CBOE-VIX), oil markets proxied by the West Texas Intermediate (WTI) and Gold. They concluded that Bitcoin and the other variables had a rather weak connectedness.
In a study of the connectedness between commodities, stocks, bonds, currency and cryptocurrencies using a hierarchical vector autoregression (HVAR) version of Diebold and Yılmaz (2014, 2015), Bagheri and Ebrahimi (2020) document an insignificant contribution of cryptocurrencies as measured by Bitcoin, Ethereum and Litecoin to the other financial market measures. Mo, Meng, and Zheng (2022) used a time-varying parameter vector autoregressive (TVP-VAR) to examine the connectedness between Bitcoin, Ethereum and Litecoin and 5 commodity indices covering energy, agricultural and natural resources. They concluded that cryptocurrencies are the main source of risk to the system.
The relationship between EMDEs' equities and cryptocurrencies was examined by Balcilar, Ozdemir, and Agan (2022), who found an increasing risk of spillover between cryptocurrencies and EMDE equity markets. This was particularly strong during the COVID-19 pandemic. It was, therefore, concluded that cryptocurrencies could not be used as diversifiers. Bejaoui, Frikha, Jeribi, and Bariviera (2023) sought to measure the connectedness among cryptocurrencies, EMDEs stock markets, gold, DeFi and NFTs using wavelet coherence analysis. They documented an asymmetric interconnectedness between digital assets, gold and emerging market indices.
In Paeng, Senteney, and Yang (2024), the tripartite spillover relationship between the S&P 500, cryptocurrencies and stablecoins is examined, using daily price data from October 8, 2018, to March 5, 2022. They used quantile Granger causality and documented significant bidirectional and spillover effects in low and high quantiles between the S&P 500 return series and the stablecoin, a bidirectional causal relationship between the stablecoin returns and cryptocurrency returns. Abrar, Naeem, Karim, Lucey, and Vigne (2024), upon examining the daily data of precious metals and cryptocurrencies for connectedness, concluded that precious metals are net recipients of shocks from cryptocurrencies. Ali, Naveed, Youssef, and Yousaf (2024) concluded a significant connectedness between Gulf Cooperation Council (GCC) stocks and energy cryptocurrencies. Ghabri, Huynh, and Nasir (2024), on their part, examined the safe haven and hedging properties of Bitcoin, Gold and the pre-eminent stablecoin Tether for several global financial and commodity market indices during COVID-19 and concluded that gold still rules this sphere.
Łęt, Sobański, Świder, and Włosik (2023) examined the frequency connectedness of shocks from traditional, volatile cryptocurrencies to stablecoins and concluded that there exists a moderate but transitory spillover of shocks from the cryptocurrency market to the stablecoin market, with the latter used as a safe haven. Baur and Hoang (2024) distinguished between correlation, the contemporaneous link between two variables, and spillover, the non-contemporaneous link between two variables. They proposed a model to split connectedness into pure spillover and correlation. Using high-frequency price data of Bitcoin (BTC), Dashcoin (DASH), Dogecoin (DOGE), Ethereum (ETC), Litecoin (LTC), USD Tether (USDT), NEM (XEM), Stellar (XLM), Monero (XMR) and Ripple (XPR), they found spillovers among the variables. The only stablecoin in their variables, USD Tether, was found to display a large auto-spillover.
Some other studies have examined the relationship and even the spillover between cryptocurrencies and fiat currencies. For example, Umar, Jareño, and de la O González (2021) utilised Antonakakis, Chatziantoniou, and Gabauer (2020) methodology to examine the impact of media coverage of the COVID-19 pandemic on the connectedness of some fiat and cryptocurrencies. As a measure of the COVID-19 pandemic, the Media Coverage Index (MCI) of the pandemic was used, while the fiat currencies considered were the British Pound (GBP), the Euro and the Chinese Yuan (Yuan), with Bitcoin, Ripple and Ethereum used to represent the cryptocurrency market. A positive pairwise spillover from Bitcoin to the Yuan and Bitcoin to Ethereum was found to exist, while a negative spillover from Ethereum to the GBP and Bitcoin to the GBP was found.
Chemkha, BenSaïda, and Ghorbel (2021) employed vine copulas to study three global vehicle currencies (the Japanese Yen (JPY), the Euro (EUR) and the GBP) and three major cryptocurrencies, Bitcoin, Ripple and Litecoin. It was concluded that the portfolio risk accuracy of fiat currency portfolios is increased if cryptocurrencies are added. This was particularly consequential if the risk measures were Value-at-Risk and Expected Shortfall (ES). Using a quantile-on-quantile (QQ) regression and the cryptocurrencies employed by Chemkha et al. (2021), Raza, Ahmed, and Aloui (2022) also investigated their interdependence with the Swiss Franc (CHF), the Yuan and the Russian Ruble (RUB) as additional currencies. They found positive connections between the fiat currencies and the cryptocurrencies.
Nekhili, Sultan, and Bouri (2023) utilised hourly data to determine the liquidity interdependence between major cryptocurrencies and major international currencies. They found that most cryptocurrencies are net receivers of shocks. Andrada-Félix, Fernandez-Perez, and Sosvilla-Rivero (2020) also looked at the connectedness between Bitcoin, Ripple, Litecoin, and Dash and the Euro (EUR), the Australian dollar (AUD), the Yen (JPY) and the GBP. They concluded that the two markets are largely disconnected. Burniske and White (2017) estimate a one-year rolling correlation between Bitcoin and the emerging market currency index and found that they were negatively correlated between March 2013 and September 2016. Letho, Chelwa, and Alhassan (2022) used daily data from August 2015 to October 2018 to examine the benefits of Bitcoin as a diversifier for South African assets. They document an overall negative correlation between Bitcoin and USDT and the South African assets. Recently, Abakah, Ullah, Abdullah, Lee, and Sulong (2024) examined the correlation between the digital asset market and the dollar exchange rate of several developed and BRICS currencies using a quantile-on-quantile regression and a rolling window wavelet correlation, and they found a heterogeneous relationship between the currencies and the digital asset markets. Kumah (2024) also employs a quantile-on-quantile regression to examine the relationship between Bitcoin and several African fiat currencies from 10 August 2015 to 31 December 2022. Their analysis concluded that Bitcoin could be a viable alternative to the reserve currencies of these countries due to the heterogeneous dependencies across the different quantiles.
Trichilli, Kharrat, and Boujelbène Abbes (2024) use wavelet coherence to examine the co-movement of the gold-backed cryptocurrency, Pax Gold and the dollar price of the several currencies. Large zones of co-movements were found for the Euro, the Yen and the Russian Ruble. Muqeet, Akram, and Umar (2024) sought to determine if cryptocurrencies can and will replace the Pakistani Rupee by comparing the benefits and cost of cryptocurrency adoption in Pakistan and the volatility of the Pakistani Rupee against Bitcoin and Ethereum. They concluded that cryptocurrencies are unlikely to displace the Rupee due to their volatility. This current study differs on several levels to the studies above. While Umar et al. (2021), Andrada-Félix et al. (2020), Chemkha et al. (2021), Raza et al. (2022), Nekhili et al. (2023), Abakah et al. (2024), and Trichilli et al. (2024) all sort to examine the relationship (or spillover) between fiat currencies and cryptocurrencies, they all considered fiat currencies of developed or powerful states (like the BRICS countries). The current study, however, utilises emerging market currencies with significant cryptocurrency penetration and are more susceptible to global currency displacements. Also, while most of these studies examined cryptocurrencies, broadly taken, and only consider USD Tether as one of the big cryptocurrencies, this study focuses exclusively on stablecoins rather than conventional cryptocurrencies. Thus, the object and focus of this study are clearly distinct from the aforementioned studies.
3. Date and methodology
3.1 Data
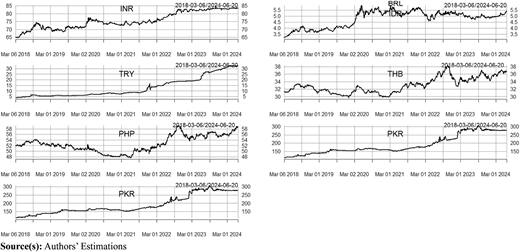
In this study, we utilise the daily EMDEs currency-dollar exchange rate for the EMDEs with significant cryptocurrency penetration. Specifically, the Indian Rupee (INR), the Brazilian Real (BRL), the Indonesian Rupiah (IDR), the Turkish Lira (TRY), the Thai baht (THB), the Philippine Peso (PHP) and the Pakistani Rupee (PKR) are used. These currencies are the currencies of the countries, along with Nigeria, the United States, Vietnam, the United Kingdom, Argentina, Russia and China, which make up the top 15 countries with the highest cryptocurrency penetration, according to Chainanalysis (2023). While the United States and the United Kingdom are excluded due to our focus on EMDEs. China, Vietnam and Argentina are excluded based on IMF (2023), which classifies their exchange rate systems as crawling pegs. Although the Nigerian Naira is classified as de jure floating, the Central Bank of Nigeria (CBN) was operating a segmented exchange rate system until June 14, 2023, and is classified as a de facto stabilised exchange rate system by IMF (2023). Thus, the exchange rate of Nigeria and other countries with, more or less, fixed exchange rates were excluded. Ukraine and Russia have been excluded due to the ongoing war, which started in 2022. As noted in Narayan, Ahmed, and Narayan (2015) and Narayan and Sharma (2015), data frequency has statistically significant implications for financial time series analysis; an important caveat about the possible dependency of the results on data frequency is, therefore, duly observed. The daily exchange rates of the selected currencies were sourced from Yahoo Finance. Specifically, the daily exchange rates for these currencies between 6th March 2018 and 21st June 2024 were utilised. The start date was purposefully chosen so that for each day, there are at least two stablecoin price observations. The resulting daily exchange rates are depicted in Figure 1.
From Figure 1, almost all the EMDE currencies are on a depreciating trend against the dollar. The Indian Rupee was trading at 65.00 Rupee per dollar on 06/03/2018. It has since depreciated and is now trading at 83.60 Rupee per dollar as of 20/06/2024. The Brazilian Real also went through the same phase trading at 4.54 in June 2024 from 3.24 in March 2018. The Turkish Lira, perhaps the most troubled of these currencies, was trading at 3.81 Liras per dollar in March 2018 but has since depreciated to 32.8 Liras per dollar as of June 2024.
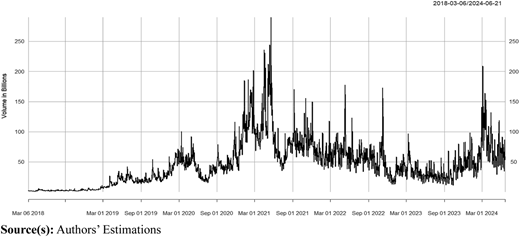
The stablecoin market is also filled with activity, with the number of stablecoins and trading volume increasing explosively over the years. Currently, there are over 200 globally recognised and traded stablecoins. However, USD Tether, the leading stablecoin, still holds about 70% market dominance with a fully diluted market capitalisation of $115,966,268,953 as of 27.06.2024, according to CoinMarketCap. In this study, we utilise the top 15 stablecoins as ranked per market capitalisation to represent the stablecoin market. These stablecoins as of 27.06.2024 according to CoinMarketCap are USD-Tether (USDT), USD-Coin (USDC), Dai (DAI), Ethena USDe (USDe), First Digital USD (FDUSD), Decentralised USD (USDD), Frax (FRAX), True USD (TUSD), Paypal USD (PYUSD), USD Bancor (USDB), Ondo US Dollar Yield (USDY). CrvUSD (CRVUSD), Pax Dollar and Stasis Euro (EUROS). These were further reduced to stablecoins with at least 2 years of data and at least 400 million dollars in market capitalisation. Seven stablecoins (USDT, USDC, DAI, USDD, FRAX, TUSD and USDB) met this criterion. The daily price and trading volume of these stablecoins were retrieved from Yahoo Finance. The daily trading volume of the stablecoin market, as represented by these seven stablecoins, is presented in Figure 2.
As depicted in Figure 2, the daily traded volume gained momentum from November 2018, reaching a high of 290 billion dollars on May 19, 2021. Since then, the daily trades have rarely spiked above the 150-billion-dollar mark. It must be noted that stablecoin trades for January 26, 2022, and January 29, 2022, stood at over 70 trillion dollars and were deleted as obvious outliers.
3.2 Data transformations
Exchange rates, like most financial asset prices, are rarely stationary. As such, it is routine to model the returns instead. The returns are often calculated as the log-difference of the asset prices. This study utilises the percentage log returns computed as in Equation (1).
With representing the returns on currency on day , represents the dollar-to-currency exchange rate on day and is the dollar-to-currency exchange rate on day .
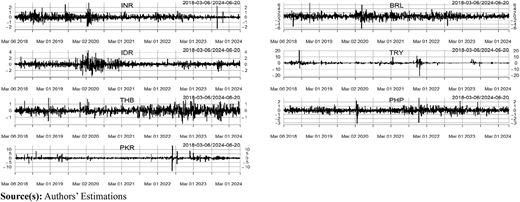
Figure 3 presents the EMDEs currency returns.
As depicted in Figure 3, investors in all the EMDE currencies, except the Turkish Lira and the Pakistani Rupee, over the period could expect returns in the lower single digits with daily returns over 10% rare in these currencies. For the Turkish Lira and Pakistani Rupee, returns in the higher single digits have been the norm, occasionally exceeding the 10% line.
Having computed the log returns of the EMDEs currencies, and stablecoins, we constructed a stablecoin return and an EMDEs currency return index using a widely used index-creation methodology, the principal component analysis (PCA). Dai, Xiong, and Zhou (2021), for example, used the PCA methodology to construct a global economic policy uncertainty index. They found it to be a good proxy for the GDP-weighted global economic policy uncertainty. In this study, we employed the probabilistic PCA (PPCA) of Tipping and Bishop (1999). The PPCA provides a straightforward approach to dealing with missing values (Tipping & Bishop, 1999). This is done by employing a likelihood function that assigns lower weight to data far from the training set, even if they are close to the principal subspace. This increases the accuracy of estimates (Stacklies & Redestig, 2024). We sum the principal components to represent the respective indices. Thus, the index captures 100% of the variations in the data.
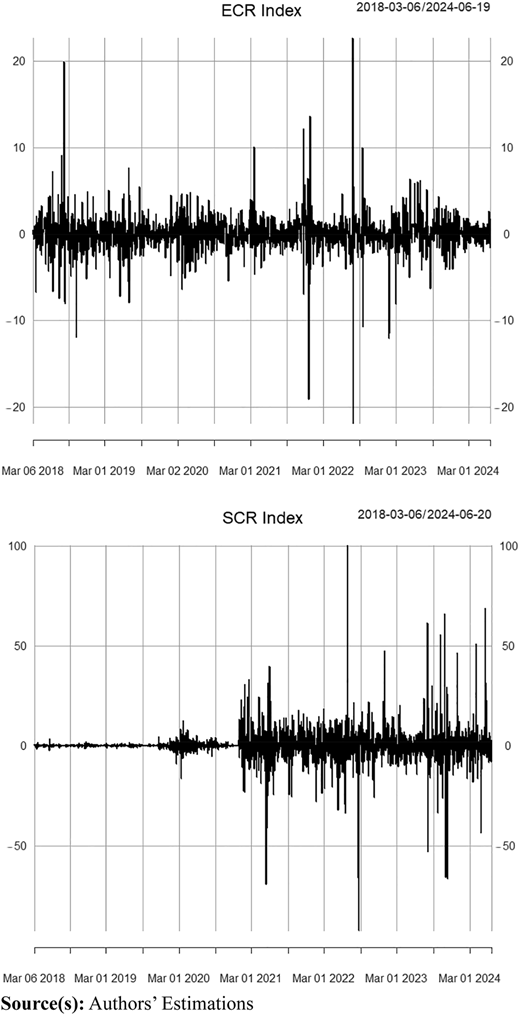
Figure 4 presents the EMDEs currency and stablecoin returns indices.
From Figure 4, it can be observed that the stablecoin return index (SCR index) started with a narrow range becoming extremely oscillatory from the COVID-19 pandemic. This oscillation could also have been due to the increasing number of stablecoins with observation. Over the same period, the EMDEs currency returns index (ECR Index) oscillated largely within the 10 bands but rarely crossed the 20 bands.
Parkinson (1980) argued that if the true variance of an asset is the diffusion constant of the underlying random walk, then an extreme value method is preferable. As such, daily variance is largely computed as in Equation (2) in line with Parkinson (1980).
With being the daily variance, is the range of the dollar to currency rate for day . We transform the daily variance computed in Equation (2) to an annualised volatility as in equation (3), following the lead of Diebold and Yilmaz (2012).
The annualised volatility calculated in Equation (3) is transformed using an inverse hyperbolic sine function as in Equation (4).
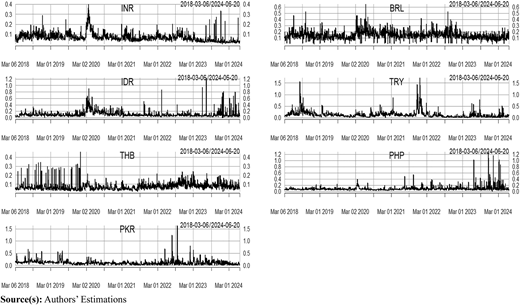
This transformation has appealing properties, including passing through and being symmetric around the origin (Norton, 2022) and is used to control for zero volatility observations (Iyer & Popescu, 2023). Figure 5 presents the EMDEs currency volatilities.
Again, as in the returns, the Turkish Lira and the Pakistani Rupee lead in volatility, at least using the range, while the Indian Rupee and the Thai Baht were the least volatile per the range.
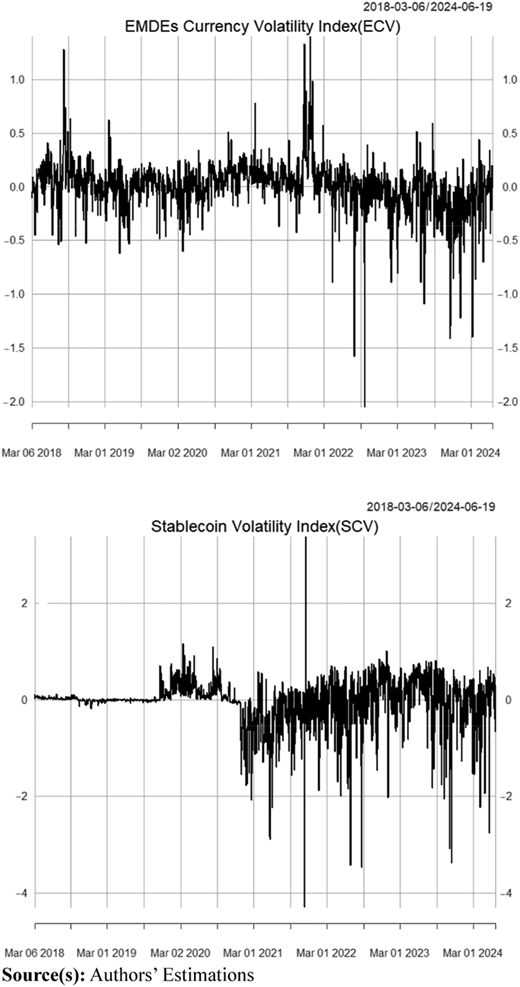
Again, using the PPCA, a stablecoin volatility index (SCV index) and EMDEs currency volatility index (ECV index) are constructed to ascertain the broader picture of volatility in the stablecoin and emerging market currencies. The computed volatility indices are presented in Figure 6.
It must be noted that the volatility indices, as presented in Figure 6, are not volatilities in the literal sense but rather an index of volatility which can fall below 0. Table 1 presents the descriptive statistics of the return series and the return indices, after deleting 42 points as outliers mainly from the SCR index using Rosner’s Test (Rosner, 1975).
As can be found in Table 1, all the variables are found to be stationary using the Augmented Dickey-Fuller Test and the Phillips-Perron Test due to Dickey and Fuller (1979) and Phillips and Perron (1988), respectively. As expected, the Turkish Lira had the highest mean returns with 0.13% returns and a maximum return of 20.54%. For the indices, while the stablecoin index averaged −0.06, the EMDEs ECR index recorded a mean of 0.00 and a maximum return of 22.68 against a maximum of 20.08 for the SCR index. The Turkish Lira also leads as the most volatile EMDE currency over the period with volatility as depicted by the standard deviation being 1.35. For the indices, the SCR index, with a standard deviation of 4.87, belied the stability of the stablecoin market. The standard deviation of the ECR index stood at 2.24, larger than all the EMDE currencies. Except for the Thai Baht, all the currency returns were found to have fat tails with Kurtosis greater than 3.00. Also, all the variables were found to be non-normal using the Jarque Berra test (Jarque & Bera, 1980) and nonlinear using the BDS test (Brock, Dechert, Scheinkman, & LeBaron, 1996).
The descriptive statistics of the volatility series and indices, again after deleting the outliers as found by Rosner’s test, is presented in Table 2.
With a mean volatility of 0.14%, the Brazilian Real led the pack, followed by the Turkish Lira, the Pakistani Rupee and the Indonesian Rupiah with 0.13%, 0.11% and 0.11%, respectively. For the indices, the EMDEs currency and stablecoin volatility index averaged 0.00 and −0.04. Again, all the series are leptokurtic and stationary at 1% significance, as depicted in Table 2. As with the return series, all the volatility series are found to be stationary, non-linear and non-normal, as such, a time-varying analysis was employed.
3.3 Time-varying correlation and connectedness measures
Using the returns and volatility data, the time-dependent correlation between the currencies and the stablecoin index is estimated using the time-varying correlation. Time-varying correlations can capture the dynamic relationship between assets compared to the standard correlation which is static and can often exaggerate the effects of diversification (Ang & Bekaert, 1999). The estimation is done using the time-varying correlation proposed by Choi and Shin (2021) and its implementation in Courtiol and Rousset (2023). Their method modifies the standard Pearson correlation as in equation (5) to observe the relation of variable X and variable Y in the neighbourhood of . This is done using a smoothed mean instead of the ordinary mean (Courtiol & Rousset, 2023).
With and . The time-varying correlation, in large part, yields the same results as the DCC-GARCH-based conditional correlation as proposed by Engle (2002) and widely used in the literature (Choi & Shin, 2021).
Beyond the time-varying correlation analysis of the returns and volatility, we sought to determine the connectedness between the EMDE currencies and the stablecoin market as represented by the computed stablecoin index. This is done using the TVP-VAR approach of Antonakakis et al. (2020), which builds on the dynamic connectedness indices proposed by Diebold and Yilmaz (2009, 2012, 2014).
Diebold and Yilmaz (2009) proposed a connectedness measure that relies on the H-step ahead forecast error variance Cholesky decomposition of a VAR system. In later works (Diebold & Yilmaz, 2012, 2014), Diebold and Yilmaz generalised the index to make it order-independent by utilising the generalised variance decomposition (GVD) framework. The GVD treats each variable as “first in the ordering” not by orthogonalisation but by accounting for correlation in shocks while allowing for observed historical correlation assuming normality (Diebold and Yılmaz, 2014). Nonetheless, this generalisation still required an arbitrary choice of a forecast rolling window which could result in the loss of valuable information (Antonakakis et al., 2020). Antonakakis and Gabauer (2017), Korobilis and Yilmaz (2018) and Antonakakis et al. (2020) employ a TVP-VAR framework to overcome the arbitrariness of the rolling window in the standard generalised VAR formulation.
Antonakakis and Gabauer (2017) and Antonakakis et al. (2020) employ a forgetting factors Kalman filter to estimate time-varying coefficients and time-varying variance-covariance matrices which are used to compute the connectedness measures of Diebold and Yılmaz (2014). Specifically, a generalised forecast error variance decomposition (GFEVD), , is estimated using the time-dependent coefficients and matrices. This GFEVD is used to represent the pairwise directional connectedness measure between asset and asset at time in the forecast horizon .
The total connectedness index is then computed using the pairwise bidirectional connectedness measures as in equation (6)
With being the cumulative spillover effect of all the shocks to the system and the numerator illustrating the shock to variable (Antonakakis et al., 2020).
Aside from the total connectedness index, a net pairwise directional connectedness (NPDC) index can be computed as in Equation (7).
An implies that variable is a net shock transmitter to variable , while implies that variable is a net shock transmitter to variable . The implication is that a positive net shock transmission from an EMDE currency to the stablecoin market implies that turbulence in the currency leads to turbulence in the stablecoin market. This could imply that economic agents resort to swapping their currency for stablecoins during periods of return or volatility shocks to the currency. A negative NPDC, however, will mean that stablecoin shocks result in a reversion to the currency. Thus, the NPDC essentially measures the bilateral spillover between the variables.
4. Results
4.1 Time-varying correlations
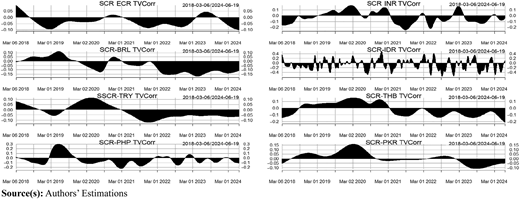
The SCR index time-varying correlations with the EMDE currency returns are presented in Figure 7.
As depicted in Figure 7, the SCR index and the EMDE Currency Returns Index (ECR index), after an initial oscillatory correlation of between −0.2 and 0.15, have since stayed negative with increasing correlation since 14th April 2021. Specifically, the correlation between the SCR index and ECR index before 14th April 2021 averaged 0.036. The correlation since then has been negative, averaging about −0.12. The time-varying correlation between the SCR index and the individual EMDE currency returns is less straightforward. The Indian Rupee showed signs of positive correlation before April 2019. By the end of March 2021, however, the correlation reverted to a positive correlation, peaking at about 0.23. The daily time-varying correlation between the Indian Rupee and the stablecoin market has since stayed positive, only deviating to a negative correlation between December 2022 and April 2023. Like the Indian rupee, the Brazilian real, the Turkish lira, and the Thai baht all show oscillation trends to positive correlation. The currency with the most stable correlational relationship with the stablecoin market is, however, the Indonesian Rupiah. The Rupiah throughout the study period maintained a positive correlation averaging 0.07 for the entire period. However, the mean correlation since December 2020 stands at 0.09. Among the currencies, the Philippine Peso seems to be the currency on a decreasing correlation trend with the stablecoin market. Even so, it seems to have evolved from oscillatory to mostly positive since late 2020. The Pakistani Rupee equally evolved towards an increasing and positive correlation with the stablecoin market, as represented by the SCR index, as depicted in Figure 7.
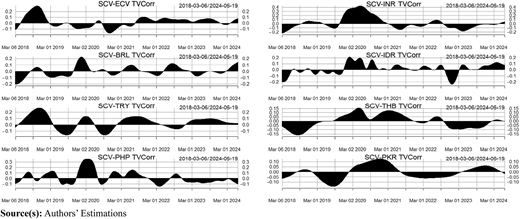
The time-varying correlation of the SCV index and the EMDE currency volatilities are presented in Figure 8.
The volatility correlation is less straightforward than the returns correlation. Nonetheless, a perceptible pattern of decreasing volatility correlation can be observed after 2021. Even so, while the mean volatility correlation between the SCV index and the Turkish Lira averaged an infinitesimal positive correlation of 0.005, all the currency volatilities averaged negative, with the maximum correlation seen between the SCV index and the Indian rupee at −0.079.
From the foregoing, it can be concluded that there is a largely negative time-varying correlation between stablecoin returns and the returns on emerging market currencies as a class. Also, a negative time-varying correlation between the EMDE currency volatilities and the stablecoin market volatility during the COVID-19 pandemic can be deduced. However, prior to and especially after the pandemic, the correlations were and have been positive and negligible. On the other hand, the correlation between the SCV and the volatility of the individual currencies has been oscillatory. These findings conditionally support the hypothesis of negative time-varying correlation and, as such, the flight-to-safety asset role of stablecoins for EMDE fiat currencies in normal times, with this relationship breaking down in periods of uncertainty such as the pandemic. This is similar to the findings of Burniske and White (2017), who found a negative rolling correlation between the pre-eminent cryptocurrency, Bitcoin and emerging market currency returns. These results also corroborate Letho et al. (2022), who found a negative correlation between cryptocurrencies in general and USDT in particular, with South African assets. Jana and Sahu (2023) also document negative conditional relations between cryptocurrencies, including USDT and Indian equities. It was concluded that USDT is a safe-haven asset for Indian equities. This also corroborates the findings of Baur and Hoang (2024), who found the correlation in returns to be higher than the correlation in volatility.
4.2 TVP-VAR connectedness
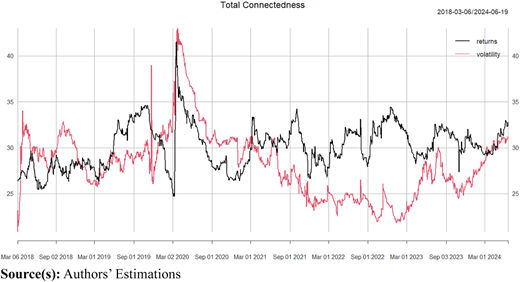
The total returns and volatility connectedness index, as computed per equation (6), is presented in Figure 9.
The total return connectedness index of the system seems stationary, with mean connectedness among the variables ranging from about 25% to 45%. The spillover index until the COVID-19 pandemic was largely below 30% but gained momentum just after the declaration of COVID-19 as a pandemic in March 2020. After that initial spike, the total return connectedness fell to an all-time low, then rose to about 31% and has oscillated around that since. The volatility connectedness also went through the same trend, gaining momentum around March 2020 and has since gone through a falling streak. As in the time-varying correlations, the connectedness measures imply a lower volatility connectedness compared to the returns.
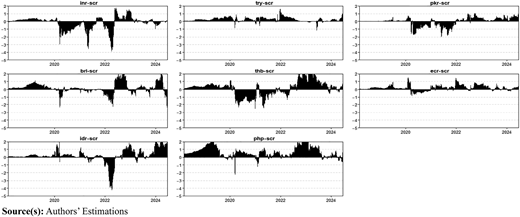
The NPDC between the SCR and the respective EMDE currencies and the ECR index are presented in Figure 10.
As depicted in Figure 10, most of the EMDE currencies have been net transmitters of shocks to the stablecoin market with only pockets of shock reception. The Indian Rupee, for example, was a net transmitter of shocks to the stablecoin market until around the declaration of COVID-19 as a pandemic in 2020. From then, the Indian Rupee lost its dominance becoming a net recipient of shocks from the stablecoin market until after 2022. Since then, the Indian Rupee has been largely a net transmitter, with isolated periods of reception. This trend can also be seen in the Pakistani Rupee and the Thai Baht, with both becoming significant recipients of shocks during the COVID-19 pandemic and have since reverted to shock transmitters. Interestingly, the least return shock transmission and reception between an EMDE currency and the stablecoin market is the Turkish Lira. Over the period, the Turkish Lira has largely been a negligible transmitter of shocks with magnitude often less than a percentage point. The most consistent transmitter of shocks to the stablecoin market, however, is the Philippine Peso. The Peso’s transmission to the stablecoin market has consistently been around 2%. Broadly speaking, the ECR index has also been a net transmitter to the stablecoin index, only briefly becoming a recipient around April 2020.
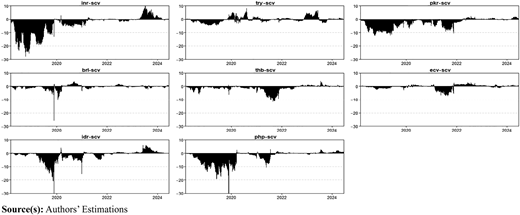
The volatility NPDC between the SCV and the EMDE currencies is presented in Figure 11.
Unlike the returns, the volatility NPDC, as shown in Figure 11, points to stablecoin market volatility shock transmission to be the norm rather than the exception. The Indian Rupee, for example, was largely a volatility shock recipient from the stablecoin market before 2023. A more or less similar pattern can be observed for almost all the EMDE currencies except for the Turkish Lira, which has been more oscillatory but with a much smaller magnitude.
Thus, the EMDE currencies, individually and as a group, have been net transmitters of return shocks to the stablecoin market before and after the COVID-19 pandemic. This supports the working hypothesis of this study. On the other hand, the volatility shock transmission has largely been from the stablecoin market to the EMDE currencies as a group and individually. This implies that periods of return turbulence and uncertainty in the EMDE currencies increase the demand for stablecoins, which puts pressure on the stablecoin peg and, thus, causes turbulence in the stablecoin market returns. On the other hand, increased volatility in the stablecoin market results in liquidation back to EMDE currencies, which results in increased volatility of the EMDE currencies. From the foregoing, it can be concluded that before and after the COVID-19 pandemic, the stablecoin market was/has largely been a flight-to-safety asset for these crypto-penetrated country currencies, at least if the returns are considered. This parallels the findings of Bouri and Jalkh (2024), who found a positive directional spillover from the VIX to cryptocurrencies, which was taken as evidence in support of flight-to-safety from the traditional assets to cryptocurrencies. Yu and Zhang (2022) utilised the exchange rate-adjusted bitcoin price discrepancy between the local market and the United States to represent excess local demand. This excess local demand was then modelled with the local policy uncertainty. It was concluded that policy uncertainty results in excess demand for Bitcoin. This excess demand for Bitcoin was then taken to mean flight to Bitcoin during periods of economic policy uncertainty.
5. Conclusions
Global stablecoins are on a forward match to becoming mainstream. How connected and correlated are these stablecoins and emerging market currencies with significant cryptocurrency penetration? This study sought to answer this question while accounting for variation in time. This is important because the existence of stablecoin shock transmission from and to EMDE currencies will impact the power and effectiveness of monetary policy in these EMDE countries, as well as portfolio diversification and hedging strategies involving these currencies. It is found that before and after the COVID-19 pandemic, the stablecoins have largely served as flight-to-safety assets when the returns are examined. The volatility is, however, less straightforward, with spillover from the stablecoin market to the EMDE currencies largely the norm. This implies that monetary authorities should be wary of this flight from their currencies to these global stablecoins as it could be an overlooked route to currency substitution. Future studies could examine high-frequency and proprietary data, especially on volume traded in these countries, and their exchange rates. Also, future researchers could examine the spillover between the stablecoin market and expanded emerging market currencies in a Quantile regression and/or regime-switching framework to throw more light on their dependencies during extreme market conditions similar to Ozcelebi and Kang (2024).