This study examines the impact of fintech adoption on financial inclusion through digital financial services (DFS) in South Asian countries (SAARC). It assesses how fintech innovations contribute to financial accessibility using cross-country panel data from 2004 to 2023.
A multidimensional Financial Inclusion Index (FII) is constructed based on Sarma's (2012) methodology, evaluating penetration, availability and usage of financial services. The study employs a Random Effects Model (REM) to capture country-specific variations, with data sourced from the IMF, World Bank and SAARC central banks.
Fintech innovations—such as mobile banking, digital wallets and internet-based transactions—positively impact financial inclusion. Key drivers include ATMs, debit cards and mobile/internet banking transactions, while mobile money transaction values show a negative effect, suggesting market saturation. Literacy rates significantly moderate these relationships. Nepal and Maldives have improved due to digital initiatives, while Sri Lanka lags due to economic challenges.
Secondary data may not capture informal transactions. Regulatory differences pose challenges, requiring future research with primary data.
Strengthening digital infrastructure, promoting financial literacy and fostering regional fintech collaboration can enhance financial inclusion, empowering underserved populations and fostering economic resilience.
This research constructs a multidimensional FII tailored to SAARC economies, offering insights for policymakers and stakeholders.
1. Introduction
1.1 Background
Fintech, an abbreviation for “financial technology,” represents the innovative application of technology to deliver financial services and reshape the financial industry (Arner, Barberis, & Buckley, 2015; Schueffel, 2016). Fintech significantly enhances financial inclusion by bridging access gaps and empowering individuals and communities globally (Philippon, 2016). Fintech leverages mobile banking, digital wallets and online platforms to offer affordable, user-friendly solutions for underserved populations, enabling transactions, savings and economic participation (Ozili, 2018; Puschmann, 2017).
Financial inclusion ensures access to financial services for unbanked and underserved groups, promoting economic growth and poverty reduction (Demirgüç-Kunt, Klapper, Singer, Ansar, & Hess, 2018; Sahay, von Allmen, Lahreche, Khera, & Kopp, 2020). Fintech innovations, including mobile banking and digital transactions, have expanded financial access, especially in low-income areas (Bakar & Rosbi, 2017; Thakor, 2020). By reducing costs and improving accessibility, fintech addresses traditional banking challenges, driving global financial inclusion (Demirgüç-Kunt et al., 2018; Philippon, 2016).
1.2 Context
SAARC, comprising eight South Asian nations, has seen varied economic growth, with some countries advancing in financial inclusion and digital transformation. Foreign direct investment has risen, driven by fintech growth (Rahman & Bank, 2020). Home to over 1.8 billion people, SAARC's expanding middle class fuels economic progress. Emerging economies like Bangladesh, India and Nepal have maintained strong GDP growth (Jain & Mukherjee, 2019). The region is witnessing rising intra-regional trade, digital expansion and infrastructure development (Basu, 2021), with China's Belt and Road Initiative enhancing connectivity Christine Lagarde (2018) highlighted SAARC's economic potential and challenges, stressing inclusive reforms. Fintech, especially mobile financial services (MFS), has boosted financial inclusion. Bangladesh's high mobile penetration and 2011 regulations improved access, India's UPI and Jan Dhan Yojana expanded digital payments and banking, Pakistan's Easypaisa and JazzCash, Sri Lanka's LankaPay, and Nepal Rastra Bank's policies enhanced financial services. Bhutan's DrukPay advanced fintech, the Maldives faces geographic challenges, Afghanistan's M-Paisa expanded mobile banking despite instability (Rahman & Bank, 2020; Khan & Khan, 2020). Fintech innovations like MFS, digital wallets, and online payments have improved financial access in SAARC countries. These technologies help bridge gaps in financial inclusion, but challenges such as low digital literacy, poor infrastructure, and regulatory barriers hinder their full potential. Each SAARC country has a distinct financial landscape. In Bangladesh, the financial sector includes state-owned, private, foreign and specialized banks, along with microfinance institutions and mobile financial service providers, contributing to financial inclusion (Parvez, Rahman, & Rahman, 2015). India has a strong fintech ecosystem with over 2,000 startups and a supportive regulatory environment fostering innovation (Reserve Bank of India, 2023). Similarly, Pakistan, Nepal, and Sri Lanka are experiencing growth in mobile banking and fintech-driven services, supported by government initiatives and regulatory frameworks promoting financial inclusion (Basu, 2021).
Fintech in SAARC faces challenges like digital literacy, regulations, cybersecurity and infrastructure gaps. Policy reforms, digital investments, and financial literacy can enhance adoption and financial inclusion (Sarker, 2022; Chowdhury, Rahman, & Hossain, 2023). Access to financial services drives economic growth and poverty reduction (Demirgüç-Kunt et al., 2018). According to the World Bank Global Findex (2017), South Asia has one of the highest unbanked populations, with India (190M), Pakistan (100M), and Bangladesh (77.1M) among the most affected. Strengthening fintech can enhance financial inclusion, secure wage payments and build credit histories. Bangladesh, India, Pakistan and Nepal attract fintech investment due to their large unbanked populations, rising mobile penetration and expanding digital financial ecosystems (Demirgüç-Kunt et al., 2018).
1.3 Purpose of the study
The purpose of this study is to analyze the level of financial inclusion in SAARC countries and evaluate the impact of fintech on financial inclusion through digital financial services (DFS). The key objectives are:
To assess the level of financial inclusion across SAARC countries
To explore how fintech-driven DFS have contributed to improving financial inclusion in SAARC nations.
To compare the effects of fintech adoption on financial inclusion across different SAARC countries, highlighting best practices.
This study examines fintech's role in advancing financial inclusion in South Asia through DFS like mobile banking and digital payments. It analyzes cross-country data on fintech innovations, regulatory frameworks and socio-economic factors while addressing challenges like digital literacy. The findings aim to guide policymakers, financial institutions, and fintech firms in enhancing financial access and economic growth.
2. Literature review
2.1 Theoretical review
his research develops a composite Financial Inclusion Index (FII) tailored to SAARC countries to assess financial service accessibility and usage. The index addresses unique regional challenges, particularly MFS and the rural-urban divide. Unlike existing indices, such as Mishra and Kiran (2020), which focus on traditional banking, this FII incorporates fintech-driven financial inclusion. The study develops a FII that incorporates MFS as a key component, highlighting their role in improving financial access for underserved rural populations. The index combines traditional measures, such as access to bank accounts and ATMs, with MFS metrics, including mobile money usage, penetration and digital payment adoption, providing a comprehensive view of financial inclusion in SAARC countries' growing mobile finance sector (Hasan, Hossain, & Rahman, 2016; Parvez et al., 2015).
The new FII improves on Mishra and Kiran's (2020) index with a multidimensional approach, integrating DFS alongside traditional measures of access, availability and usage. By including mobile money and online banking, it better reflects the evolving financial landscape, where technology is transforming financial inclusion in SAARC economies (Hasan et al., 2016; Sarker, 2022; Mishra & Kiran, 2020). This aligns with Ayayi and Dout (2024), who argue that conventional indices may underestimate inclusion by ignoring fintech adoption, suggesting that integrating digital measures enhances the explanatory power of inclusion indices. Similarly, Nguyen (2021) constructed a composite FII for developing countries, highlighting the contribution of fintech to access, usage and quality dimensions of inclusion. These studies collectively suggest that the current FII not only measures traditional banking penetration but also captures the dynamic role of fintech, bridging gaps identified in prior literature.
2.1.1 Penetration dimension
The penetration aspect of financial inclusion shows how much people are involved in the formal financial system, often measured by the percentage of the population with bank accounts and the number of depositors per 1,000 adults (Sarma, 2012; Cámara & Tuesta, 2014; Rojas-Suarez & Amado, 2014; García-Herrero & Turégano, 2015). Key indicators include bank account ownership, total count of bank branches, ATM availability and financial services reach in rural regions. A higher penetration score reflects broader financial service coverage. Researchers like Demirgüç-Kunt and Klapper (2012) use these indicators to track financial inclusion progress and disparities. The penetration dimension is crucial in calculating the Composite Financial Inclusion Index (CFII) (Sarma, 2012; García-Herrero & Turégano, 2015). Nguyen (2021) suggested that penetration should also capture the reach of digital accounts and mobile wallets, which increasingly represent first-entry points into the financial system. By integrating mobile wallet penetration, this study addresses the critique of Sarma (2012) that traditional measures may overlook digital-first users, thus offering a more nuanced understanding of inclusion patterns in emerging markets.
2.1.2 Availability dimension
The accessibility aspect of financial inclusion focuses on the availability of formal financial services, such as bank branches and ATMs, in various regions. Key indicators like the number of bank branches and ATMs per 100,000 people help assess accessibility, especially in underserved areas (Sarma, 2012; Cámara & Tuesta, 2014; Rojas-Suarez & Amado, 2014). More branches and ATMs per capita indicate better access, enabling targeted efforts to enhance financial inclusion in underserved regions. This dimension is crucial for identifying gaps and planning interventions to improve access to financial services. Ayayi and Dout (2024) indicated that fintech-based access points, such as agent banking and digital kiosks, increasingly substitute for physical branches in developing regions, suggesting a shift in the understanding of “availability” within inclusion frameworks. In line with this, the present study incorporates fintech access points, reflecting how mobile banking innovations complement physical infrastructure, consistent with Sahay et al. (2020) and Manyika et al. (2016).
2.1.3 Usage dimension
This dimension examines the frequency and adequacy of clients' use of various financial services, such as savings, borrowing, payments, remittances and transfers. It reflects the effectiveness of a financial system, as mere access is insufficient for financial inclusion. Due to limited internationally comparable data, the usage dimension uses two indicators: the number of loan accounts per 1,000 adults (Cámara & Tuesta, 2014) and the number of borrowers per 1,000 adults (Amidžić, Massara, & Mialou, 2014). Nguyen (2021) and Ayayi and Dout (2024) further emphasized that digital transaction frequency and mobile payment volumes are key usage proxies, underscoring fintech's growing role in inclusive finance ecosystems. This confirms the argument by Allen et al. (2014) and Aker and Mbiti (2010) that usage, especially digital usage, mediates the link between financial access and economic empowerment.
2.2 Empirical review of the study
Geographic penetration assesses financial inclusion by measuring access to financial institutions (Amidžić et al., 2014), with rural areas in SAARC facing significant barriers. Fintech and digital services help bridge these gaps (Sahay et al., 2020), reducing regional disparities and improving accessibility. MFS play a crucial role, supporting small businesses (Aker & Mbiti, 2010) and linking inclusion to economic growth (Allen et al., 2014). Studies highlight access gaps (Demirgüç-Kunt & Klapper, 2012) and the role of financial growth in development (Beck, Levine, & Loayza, 2004).
Fintech innovations, including AI, data analytics and mobile technology, expand financial access, particularly in SAARC (Manyika et al., 2016). Mobile services enhance rural financial inclusion (Ahmed & Islam, 2018), reaching underserved groups and empowering women. Mobile money boosts rural financial access (Rahman, Islam, & Sultana, 2019), increasing formal financial accounts and reducing the unbanked population. Fintech startups drive inclusion and innovation (Hasan, Islam, & Bank, 2022), while microfinance and peer-to-peer lending lower barriers for marginalized communities.
Key financial inclusion drivers include ATMs, card usage and digital payments as a share of GDP (Demirgüç-Kunt & Klapper, 2012; Manyika et al., 2016; Ahmed & Islam, 2018). Mobile and internet banking further enhance access (Rahman & Bank, 2020). ATMs and literacy rates (LRs), along with debit/credit card usage, influence financial accessibility (Rahman & Bank, 2020), while GDP per capita, literacy and urbanization shape financial inclusion effectiveness.
Regulatory frameworks play a crucial role in fintech adoption for financial inclusion. Studies (Khan & Khan, 2020) show that policies like India's UPI and Bangladesh's MFS guidelines have strengthened DFS, while regulatory hurdles limit fintech growth in Afghanistan and the Maldives. Gupta et al. (2022) emphasize consumer protection and financial literacy for sustainable fintech expansion. A cross-country analysis highlights fintech's impact on financial inclusion, with adoption influenced by economic, technological, and regulatory factors (Basu, 2021). India and Bangladesh lead in MFS, Nepal and Sri Lanka are gradually expanding, while Afghanistan and the Maldives face challenges.
The CFII measures financial inclusion in SAARC nations, focusing on access, usage and quality of services (Sarma & Pais, 2011). Studies validate its role in tracking financial access trends (Hasan et al., 2022; Rahman & Bank, 2020), while higher CFII scores indicate stronger financial infrastructure, though disparities in access, digital literacy and regulation persist. Sarma and Pais (2011) developed the FII, assessing inclusion through penetration, availability and usage. Research confirms fintech innovations enhance financial inclusion, but challenges like digital literacy gaps, regulatory barriers and cybersecurity risks must be addressed (Hasan et al., 2022; Rahman & Bank, 2020). Nguyen (2021) and Ayayi and Dout (2024) further reinforced the importance of updating inclusion indices to reflect the rapid expansion of fintech ecosystems, ensuring the indices remain relevant and credible in capturing financial access dynamics. Nguyen (2021) and Ayayi and Dout (2024) further reinforced the importance of updating inclusion indices to reflect the rapid expansion of fintech ecosystems, ensuring the indices remain relevant and credible in capturing financial access dynamics.
2.3 Research hypothesis
This study examines fintech adoption's impact on financial inclusion in SAARC using a composite FII (Sarma & Pais, 2011). It also explores socio-economic factors moderating this relationship (Hasan et al., 2022; Rahman & Bank, 2020), and the corresponding hypotheses are presented in Table 1.
2.4 Research gap
Although financial inclusion is widely studied, most research focuses on single-country analyses, with limited cross-country evidence from the SAARC region. There is insufficient comparative research examining how DFS and fintech influence financial inclusion across SAARC countries, making it difficult to identify regional patterns, challenges and opportunities. Additionally, the role of regulatory frameworks and socio-economic factors in shaping digital financial inclusion remains underexplored. To address these gaps, this study adopts a cross-country SAARC approach and introduces geographic penetration of financial services (per 1,000 km2) as an alternative measure of accessibility, offering a broader and more region-specific evaluation of financial inclusion.
3. Methodology
This study uses a quantitative, explanatory research design based on the positivist paradigm to examine the relationship between fintech adoption and financial inclusion (FAFI) in SAARC countries. Using panel data from 2004 to 2023, it analyzes both time-series and cross-country variations to ensure reliable and generalizable findings. Secondary data are collected from reputable sources such as the IMF, World Bank Global Findex and central banks.
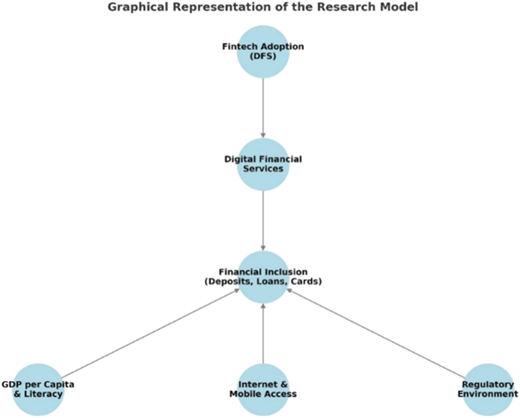
Financial inclusion is measured through a CFII covering penetration, availability and usage dimensions. Fintech adoption is captured through digital financial service indicators such as mobile banking, electronic transactions and digital payment penetration. Control variables include GDP per capita, LR, internet penetration and digital infrastructure, as illustrated in Figure 1.
Panel regression techniques (fixed and random effects) are applied, with diagnostic tests such as the Hausman test to select the appropriate model. Moderation analysis is also used to assess how socio-economic factors influence fintech's impact on inclusion. Overall, the methodology provides a multidimensional and cross-country evaluation of how DFS reshape financial inclusion in SAARC economies and offers policy-relevant insights as presented in Table 2.
3.1 Instruments
This study examines fintech adoption's impact on financial inclusion in SAARC countries using panel data (2004–2023). Data sources include IMF's FAS, World Bank's Findex and SAARC central bank reports. The research analyzes DFS, fintech adoption and financial institutions to assess their role in improving financial accessibility.
3.2 Model selection of the study
This study adopts Sarma's (2012) methodology to construct a multidimensional FII, akin to the United Nations Development Programme (UNDP) indices like the Human Development Index (HDI) and Gender Development Index (GDI). Unlike the UNDP's average-based approach, this index employs a distance-based method, deemed more methodologically advanced (Sarma, 2012). This approach considers variations across dimensions more comprehensively, providing a nuanced evaluation of financial inclusion progress (Sarma, 2012). The index in this study differs from Zeleny's (1974) “method of displaced ideal” by assessing distance from both worst and ideal points, not just ideal positions (Sarma, 2012). This method meets mathematical standards such as boundedness, unit-free measure, homogeneity and monotonicity (Sarma, 2012). In contrast, the UNDP method assumes balance across dimensions, which may not reflect financial inclusion's varied importance (Sarma, 2012). Crucially, unlike the UNDP, this study avoids fixed weights for dimensions, enhancing flexibility and relevance in assessing financial inclusion (Sarma, 2012).
3.2.1 Model for index of financial inclusion
This study uses an experimental approach to calculate the dimensional index by considering the observed minimum and maximum values for each indicator. Since some financial inclusion indicators may lack clear minimum and maximum values, these are determined empirically based on real data. This method ensures a more accurate and data-driven calculation of the dimensional index. The first step in calculating the FII involves creating indices for each aspect of financial inclusion, namely, penetration, availability and usage. The method used for creating these indices is as follows:
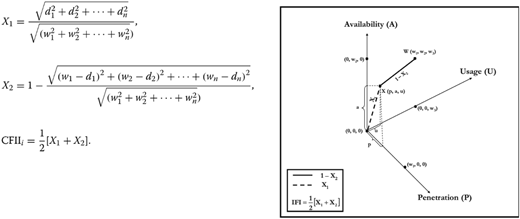
In this formulation, di represents the index or normalized value of dimension i. The weight assigned to a specific indicator within dimension i is denoted as wi. The actual value of an indicator for dimension i in economy k during year t is given by Ai. The upper threshold for a particular indicator, mi, is set at the 90th percentile to prevent extreme values from skewing the index and to ensure a balanced distribution. Meanwhile, the lower threshold, Mi, is set at 0. Using Equation (1), di is computed as the normalized score for an indicator, where a higher di reflects greater progress in that dimension for the given economy. The last stage is to calculate the FII for an economy, using the following equations, which are based on the concepts of the accomplishment point's distance (X = d1, d2, d3) from the worst (O = 0, 0, 0, 0) and best (W = w1, w2, w3) scenarios.
In this context, a larger distance between X and O, and a smaller distance between X and W indicate better financial inclusion, as illustrated in Figure 2. Consequently, the FII ranges from 0 to 1, with higher values denoting greater financial inclusion. The index exhibits a monotonically increasing behavior, meaning that as the index value rises, financial inclusion improves. Moreover, the FII has well-defined boundaries, ensuring it remains within this range, accurately reflecting the extent of financial inclusion achieved in a given country or region.
3.3 Financial inclusion index in SAARC countries
3.3.1 Financial inclusion index by country: weighting rationale
Bangladesh: FII is measured across Penetration (1.00), Availability (0.60) and Usage (0.50). Deposit accounts and active mobile money accounts receive higher weights to reflect actual usage, while bank and MFI branches are emphasized for availability. Usage equally considers commercial bank and MFI borrowers, highlighting the combined role of traditional banking and MFS. India: Similar structure with full weights on deposit accounts and MFI loans for penetration. Availability emphasizes bank branches, while usage includes bank loans, MFI borrowers and mobile money transactions (MMT). Slightly lower weight on usage accounts for data limitations in payments and remittances. Pakistan: Penetration prioritizes deposit accounts and active mobile money accounts. Availability favors bank branches and active mobile money agents. Usage focuses on commercial bank loans and MFI borrowers, reflecting both digital finance adoption and traditional banking. Nepal: Penetration fully weights deposit accounts and MFI loans, with higher weight on active mobile money accounts. Availability emphasizes bank branches and MFI branches in rural areas. Usage considers active financial engagement, balancing traditional and digital services. Afghanistan: Given limited banking infrastructure, penetration emphasizes active mobile money accounts. Availability prioritizes bank branches and mobile money agents. Usage focuses on loan accounts and MMT, reflecting reliance on DFS. Maldives: Financial inclusion is mainly digital, driven by mobile money due to geographic dispersion, with limited reliance on traditional banking. Sri Lanka: Balanced use of traditional banking and digital services, considering deposits, branch access and loan activity. Bhutan: Uses a standard FII approach based on penetration, availability and usage for a balanced view of financial inclusion. Across SAARC countries, the FII combines penetration, availability and usage, with tailored weights reflecting each nation's reliance on traditional banking and DFS, capturing country-specific financial landscapes and service accessibility as presented in Table 3.
3.4 Model specification
The study also applies several diagnostic and statistical tests to ensure data reliability and model validity, including the Levin-Lin-Chu unit root test, skewness and kurtosis statistics, multicollinearity test, endogeneity test and an overview of statistical measures (Table 5). This study employs a dynamic panel model to estimate fintech's impact on financial inclusion in SAARC countries. A lagged dependent variable accounts for financial inclusion's persistence over time. The Hausman test results (p-values: 0.48, 0.94, 0.89) suggest no significant correlation between individual effects and explanatory variables, making the Random Effects Model (REM) appropriate. This model ensures robust and reliable findings by capturing both cross-sectional and time-series variations, offering efficient insights into fintech's role in financial inclusion.
3.4.1 Model 01: fintech adoption and financial inclusion model (FAFI model)
The FAFI Model analyzes the relationship between FAFI in SAARC countries. It considers fintech-related variables such as ATM availability, debit/credit card volume, digital payments as a percentage of GDP (PDG) and MMT. By evaluating these variables, the model assesses how fintech adoption influences financial inclusion across regions.
Mathematically, the model is expressed as:
where FIIit represents the FII, and the independent variables denote different aspects of fintech adoption.
3.4.2 Model 02: digital financial services and financial inclusion model (DFS-FI model)
The DFS-FI Model examines how DFS promote financial inclusion by incorporating key indicators like mobile and internet banking transactions (NMBT), active mobile money accounts (NAMMA) and their transaction value (VMMT). It also includes urban population (UP) and GDP per capita (GPC) as control variables to assess how DFS improves financial access for the underbanked. The model is formulated as:
where FIIit represents financial inclusion, and the independent variables capture the scale and impact of DFS.
3.4.3 Model 03: = fintech adoption and financial inclusion model with moderation (FAFI-M model)
The FAFI-M Model extends the fintech adoption framework by including moderating socio-economic factors – specifically literacy rate (LR) and interest penetration rate (IPR) – to better understand their influence on financial inclusion.
Key interactions:
ATM × LR: Examines if higher literacy improves ATM accessibility and usage.
Debit Card × IPR: Assesses how interest rate penetration affects debit card usage.
Credit Card × IPR: Evaluates the effect of interest rates on credit card transactions.
The model is expressed as:
This model provides a more nuanced understanding of how fintech adoption interacts with socio-economic factors to influence financial inclusion.
4. Results
4.1 Geographic penetration of financial services in South Asian countries (SAARC)
Geographic penetration measures financial inclusion by reflecting access to financial institutions (Amidžić et al., 2014). In SAARC, uneven infrastructure limits access in rural areas. Service distribution analysis reveals regional gaps, while fintech enhances accessibility in underserved areas.
4.2 Financial inclusion index calculation
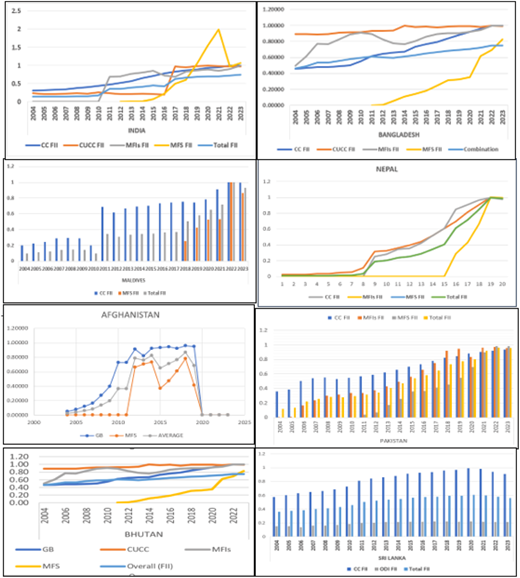
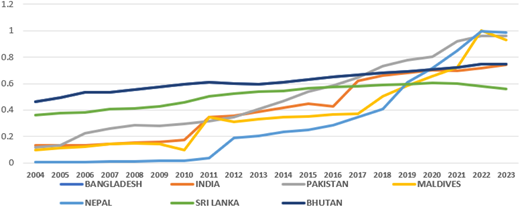
Between 2004 and 2023, financial inclusion in SAARC countries steadily increased, reflecting substantial progress in expanding access to financial services. Nepal led the growth, followed by Pakistan and India, while Bangladesh showed steady improvement driven primarily by private MFS like bKash. India's rapid acceleration after 2016 coincided with Jan Dhan Yojana and UPI adoption, and Pakistan's gains were supported by mobile wallets and digital banking expansion. Maldives achieved near-universal inclusion through government-led digital initiatives, whereas Sri Lanka showed moderate growth with a recent decline, likely due to economic instability, and Bhutan mirrored Bangladesh's steady trend.
Key inflection points in the Trend Analysis of FII in SAARC are illustrated in Figure 3. These include 2011 (mobile banking expansion), 2016–2017 (global fintech boom) and 2020–2021 (COVID-19-driven digital adoption). Cross-country comparisons highlight Maldives and Nepal as leaders, Sri Lanka as lagging and Bangladesh, India, Pakistan and Bhutan performing moderately. Fintech innovations – including bKash, Easypaisa and UPI – combined with policy programs such as India's Aadhaar-linked banking, Nepal's Digital Nepal Framework and Pakistan's National Financial Inclusion Strategy, were instrumental in driving financial inclusion.
However, country-specific contexts matter, as shown in Table 4 (Index Calculation). Nepal's growth reflects both policy support and robust mobile infrastructure, while Bangladesh demonstrates the pivotal role of private fintech providers. Sri Lanka's decline underscores how macroeconomic instability can offset technological gains, highlighting the need to integrate socio-economic, regulatory and policy factors when interpreting trends. The analysis suggests that fintech adoption alone is insufficient; complementary measures – financial literacy, regulatory support and targeted rural outreach – are essential to translate access into meaningful use. Overall, fintech has significantly advanced inclusion, but sustained, coordinated and context-specific efforts are required to ensure equitable financial growth across the SAARC region.
This study investigates the determinants of financial inclusion in SAARC countries using a multidimensional FII. The primary estimation strategy is the Random Effects (RE) panel regression model, which accounts for unobserved heterogeneity across countries while assuming that country-specific effects are uncorrelated with the explanatory variables. The Hausman test results support the suitability of RE for the models considered, providing efficient and consistent estimates.
The RE results (Table 5) reveal that financial infrastructure variables – ATM density, debit card usage and credit card penetration – significantly enhance financial inclusion. DFS, including mobile and internet banking, also contribute positively, while socio-economic factors such as LRs and GDP per capita reinforce these effects. These results indicate that financial inclusion is jointly driven by traditional banking infrastructure, fintech adoption and socio-economic conditions, emphasizing the need for integrated policy and technological strategies.
To address potential endogeneity, the study employs System Generalized Method of Moments (GMM) as a robustness check. Endogeneity may arise from:
Simultaneity, where higher financial inclusion could stimulate fintech adoption;
Omitted variable bias, due to unobserved institutional or cultural factors; and
Dynamic effects, since past financial inclusion may influence current outcomes.
System GMM uses lagged levels and differences of endogenous variables as instruments, yielding consistent and unbiased estimates under these conditions. The GMM results corroborate the RE findings, confirming that ATM density, card usage, mobile financial transactions and LRs have significant positive effects on financial inclusion, thereby reinforcing the robustness and reliability of the empirical conclusions.
In summary, the study employs RE as the primary estimation strategy for interpretability and efficiency, with System GMM serving as a robustness check to account for endogeneity and dynamic panel bias. This approach ensures methodological consistency and strengthens confidence that both fintech adoption and socio-economic factors are critical determinants of financial inclusion across SAARC nations.
Results indicate that ATM density, debit and credit card usage and mobile/internet banking significantly enhance financial inclusion, with LRs and GDP per capita further strengthening these effects. The hypothesis testing results are presented in Table 5: Hypothesis 1, 2 and 3 Examination, while the acceptance and rejection decisions of the hypotheses are summarized in Table 6: Hypothesis Testing Results for FII Models. These findings confirm that financial inclusion is jointly driven by financial infrastructure, fintech adoption and socio-economic development, and remain robust to endogeneity concerns, as verified by the System GMM approach. Some results reveal unexpected patterns. The negative coefficient for mobile money transaction values suggests that high transaction volumes may be concentrated among a few users, limiting broader access, while urbanization negatively affects inclusion due to unequal access in affluent versus under-served urban areas. Additionally, active mobile money accounts are insignificant, indicating that account ownership alone does not ensure meaningful use. These patterns highlight the need for multidimensional measures and complementary interventions, such as financial literacy programs and inclusive infrastructure.
Institutional and regulatory frameworks are critical: countries with coordinated fintech policies and interoperable systems (e.g. India's UPI, Bangladesh's bKash) achieve stronger inclusion, whereas fragmented regulations and infrastructural constraints (e.g. Maldives, Bhutan) hinder progress. Overall, traditional banking infrastructure and DFS jointly drive inclusion, but contextual factors – market structure, regulation and socio-economic disparities – moderate their effectiveness. The study demonstrates that achieving sustained financial inclusion requires a holistic approach combining technology, socio-economic support and effective institutional policies.
Empirical analysis confirms that fintech adoption significantly enhances financial inclusion in SAARC countries. Traditional infrastructure, such as ATMs, debit and credit cards, positively impacts inclusion, while mobile money growth shows mixed effects. DFS, including mobile and internet banking, further drive inclusion, with GDP per capita supporting access and urbanization sometimes limiting it. Interactions reveal that higher LRs strengthen the effect of ATMs, and debit card usage combined with interest penetration improves financial access. System GMM results consistently show that variables like ATM density, digital credit usage, credit card penetration and MMT positively affect the FII, with regulatory measures and socio-economic factors reinforcing these effects. Model diagnostics confirm robustness and reliability.
A deeper interpretation of these findings suggests that fintech adoption enhances not only access but also the quality and frequency of financial transactions, demonstrating a multidimensional impact on inclusion. Mixed effects of MMT may indicate early market saturation or unequal adoption across regions, highlighting the need for complementary interventions such as financial literacy programs. Furthermore, interaction effects reveal that infrastructure and human capital, particularly literacy and education, amplify the benefits of fintech, suggesting that policy design must account for these socio-economic mediators.
Overall, the findings demonstrate that fintech adoption – both traditional and digital – alongside socio-economic and institutional support, plays a critical role in enhancing financial inclusion across SAARC nations, with all tested hypotheses showing significant positive effects. This highlights that achieving sustained financial inclusion requires a holistic approach combining technology, regulation, infrastructure and human capital development.
This study examines the impact of fintech on financial inclusion in SAARC countries, highlighting the transformative role of DFS like MFS, digital payments and online banking in integrating unbanked populations into the formal financial system. The findings show that fintech-driven financial inclusion contributes to economic growth, poverty alleviation and social empowerment.
The study uses a multidimensional FII, which reveals that Nepal has made the most progress, followed by Pakistan, India and Bangladesh. Innovations like India's UPI, Bangladesh's bKash and Pakistan's Easypaisa and JazzCash have expanded financial access. Empirical analysis confirms a positive relationship between FAFI, with factors like mobile and internet banking contributing positively. Importantly, the study connects empirical outcomes to broader socio-economic contexts: countries with supportive policies, digital infrastructure and higher LRs experience stronger fintech-driven inclusion. The results indicate that technology alone is insufficient without institutional and human-capital support, reinforcing the need for integrated policy interventions.
However, challenges remain, including digital literacy gaps, regulatory issues and cybersecurity risks. Policymakers must address these barriers through investments in digital infrastructure, regulatory harmonization and financial literacy programs. The study emphasizes the importance of public-private partnerships and cross-border collaboration within SAARC to accelerate financial inclusion and economic growth. Further research and targeted policies for marginalized communities will be crucial for enhancing fintech's role in financial inclusion and fostering sustainable economic growth in South Asia.
5. Practical implications
The study highlights the need for targeted policies to enhance financial inclusion in SAARC countries. Investing in digital infrastructure and expanding broadband and mobile networks can improve access in rural areas. Financial literacy programs, particularly for women, youth and marginalized groups, are essential to maximize fintech adoption. Regulatory harmonization across countries will facilitate cross-border transactions and support innovation, while public-private partnerships can combine policy support with market-driven fintech solutions. Lagging countries like Sri Lanka and Bhutan require tailored interventions to overcome geographic and structural constraints. Future research should explore the long-term effects of fintech on financial behavior, economic empowerment and poverty reduction. Studies should address trust, adoption barriers and behavioral factors, particularly in rural populations. Micro-level and gender-focused analyses can reveal disparities in inclusion, while cross-regional comparisons can identify scalable best practices. Incorporating socio-economic indicators such as education, income and urbanization will further clarify how context influences fintech-driven inclusion.
Overall, effective financial inclusion requires a combination of technology, policy, regulatory support, human capital development and targeted research to ensure fintech solutions benefit all populations across the SAARC region.
6. Conclusions
This study explores the impact of fintech on financial inclusion in SAARC countries through DFS, offering a cross-country analysis. Fintech innovations, including MFS, digital payments and online banking, have played a crucial role in integrating unbanked populations into formal financial systems and promoting economic growth.
A multidimensional FII was constructed to assess financial accessibility, availability and usage trends across SAARC nations from 2004 to 2023. Nepal exhibited the highest improvement, followed by Pakistan and India, while Bangladesh demonstrated steady growth. Key fintech interventions, such as India's UPI, Bangladesh's bKash and Pakistan's Easypaisa, have significantly expanded financial accessibility and usage.
Empirical analysis validates the positive relationship between FAFI. The results indicate that ATMs significantly enhance financial inclusion, alongside debit and credit cards. However, mobile money transaction values show a negative effect, suggesting possible market saturation. Mobile and internet banking transactions positively influence financial inclusion, while active mobile money accounts show no significant effect. The Hausman test confirms the suitability of the RE estimation, ensuring the robustness of the findings. Additionally, socio-economic factors such as LR significantly enhance financial inclusion, particularly in conjunction with ATM availability. Debit card usage with interest penetration also improves financial inclusion. Hypothesis testing confirms that fintech adoption, DFS usage and socio-economic factors all significantly impact financial inclusion.
By integrating findings with cross-country trends, the study demonstrates that fintech's impact is both context-specific and multidimensional: technology, policy, socio-economic factors and regulatory frameworks interact to shape inclusion outcomes. This reinforces the argument that sustainable financial inclusion strategies must adopt a holistic perspective combining innovation, regulation, infrastructure and human capital development.
The study acknowledges limitations, including data inconsistencies, regulatory differences and the exclusion of behavioral factors like trust in digital services. Future research could explore global financial inclusion trends, cross-regional comparisons and micro-level fintech impacts on marginalized groups. Longitudinal studies are recommended to assess fintech's long-term role in financial inclusion.
Overall, fintech has emerged as a key driver of financial inclusion in SAARC nations, but sustained efforts in policy, innovation and infrastructure are needed to maximize its impact and ensure inclusive economic growth. The study's findings provide actionable insights for policymakers and financial institutions to tailor interventions that strengthen both access and usage of financial services across diverse SAARC contexts.