The purpose of this paper is to discuss a production planning and control model known as the Lean construction management (LCM) model, which applies a number of visual tools in a systematic way to the planning and control process. The application of the visual tools in this way facilitates the flow of information, thus improving transparency between the interfaces of planning, execution and control.
Design Science research is adopted for this investigation, which analyses the original development of the model and reports on its testing and refinement over different types of projects. The research is divided into three parts, each part focussing on a different stage of development and construction project type.
The main findings are related to the benefits of visual management in the construction planning and control process, such as maintaining consistency between different planning levels, so that feasible execution plans are created; control becomes more focussed on prevention rather than correction, and creates opportunities for collaborative problem solving. Moreover, the physical display of the visual tools in a discrete planning area on-site encourages a regular exchange between participants on actual work progress as it unfolds, leading to more timely reaction to the problems at hand.
The problem of a lack of transparency in construction planning and control leads to communication issues on-site, poor process orientation and high levels of waste. LCM improves process transparency by making information related to system-wide processes more readily available to project participants. This enables them to foresee problems in a timely manner and to take necessary measures to resolve them or to adapt the process to current circumstances. The LCM model proposes a new way of applying visual tools and controls systematically to improve transparency in construction planning and control.
Introduction
Whether in the public sector, financial markets, factories or construction sites, one of the key concerns of operations management is creating a work environment in which information flows effectively by increasing process transparency (Murata and Katayama, 2010; Steinfield et al., 2011; Tezel et al., 2015; Bititci et al., 2016; Beynon-Davies and Lederman, 2017). Process transparency can be defined as the ability of a production process (or its parts) to communicate with those involved in it (Formoso et al., 2002), by making the main process flows visible and comprehensible from start to finish, through organisational and physical means, measurements and public displays of information (Koskela, 2000; Sacks et al., 2009; Bititci et al., 2016; Tezel et al., 2016; Beynon-Davies and Lederman, 2017).
In practice, many of the Lean Production techniques possess close-range, sensory communication attributes that help increase process transparency. Such techniques include the 5S (a systematic housekeeping methodology) (Gapp et al., 2008), the A3 (a summary of the continuous improvement process on an A3 sized sheet) (Sobek and Smalley, 2011), the kanban (card-based) production control system (Junior and Godinho Filho, 2010), standard operating sheets (operational instructions) (Lyons et al., 2013) or the andon process status monitoring (Kattman et al., 2012).
The problem of a lack of process transparency in construction projects often leads to poor communication and co-ordination (Koskela and Howell, 2002c), poor process orientation, ineffective decision making (Jang and Kim, 2007), unsafe working conditions, worker dissatisfaction and stress (Hewage et al., 2008) and high levels of waste and variability in the construction process (Dainty and Brooke, 2004; Picchi and Granja, 2004; Alarcón, 2005). This lack of transparency stems from deficiencies in the traditional approach to project management which limit the role of planning and control systems in terms of managing construction (Koskela and Howell, 2002c). For example, it is assumed that tasks can be carried out as planned (Johnston and Brennan, 1996), leading to delays and re-scheduling in execution with little feedback on feasibility (Koskela and Howell, 2002c).
Increasing process transparency is one of the primary concerns of a management strategy called visual management (VM) (Alves et al., 2012; Tezel et al., 2016; Verbano et al., 2017). VM is a strategy for organisational control, measurement and improvement, which uses visual devices to externalise information and improve communication in the workplace, making information easily accessible to support process participants acting in a purposeful way (Parry et al., 2010; Ortiz and Park, 2011; Jaca et al., 2014; Bateman et al., 2016; Tezel et al., 2016; Beynon-Davies and Lederman, 2017; Steenkamp et al., 2017). According to Tezel et al. (2015), VM attempts to improve organisational performance through connecting and aligning organisational vision, core values, goals and culture with other management systems, work processes, workplace elements and stakeholders, by means of sensory stimuli (information), which directly address one or more of the human sensory modalities (visual, auditory, tactile, olfactory and gustatory).
VM has an important role to play in providing clarity and availability of information, especially in face of the complexity of construction projects (Tezel et al., 2015; Walker, 2015), both in terms of structural complexity and uncertainty (Williams, 2002; Tjell and Bosch-Sijtsema, 2015). VM can be used to support the co-ordination of a large number of stakeholders and the execution of highly interdependent tasks (Viana et al., 2014; Tjell and Bosch-Sijtsema, 2015). VM supports continuous work flow by enhancing workers’ and managers’ ability to detect problems and correct them before they halt the system. Moreover, VM can help to facilitate the flexibility needed to adapt to short-term changes in product specification, workload balancing and personnel assignments (Formoso et al., 2002; Viana et al., 2014). Therefore, VM systems hold the potential to facilitate information flow and process transparency in planning and control activities in construction.
However, most current VM applications in construction are largely unsystematic in nature and tend to focus on the application of individual tools borrowed from manufacturing and applied in isolation to discrete parts of the construction process (Picchi and Granja, 2004; Kemmer et al., 2006; Jang and Kim, 2007; Tommelein, 2008; Tezel, 2011; Ko and Kuo, 2015). The use of isolated applications only partially supports the achievement of a high level of transparency for the overall process. A systematic application of VM covering construction planning and control is necessary to improve consistency between hierarchal planning levels by better connecting and aligning objectives at these levels.
The Lean construction management (LCM) model, presented in this paper, uses VM to improve process transparency in planning and control in construction. A previous publication on the implementation of this model to refurbishment (Bryde and Schulmeister, 2013) focussed on investigating the effects of adopting Lean Construction on the refurbishment of a municipal building in Germany. While that study pointed out some difficulties in applying some core Lean ideas to refurbishment projects, such as pull scheduling (scheduling from a target completion date backward to define and sequence tasks so that their completion releases work) (Kenley and Seppänen, 2010) and the Just in Time (receiving construction goods and tasks only as they are needed in the production process to optimise work in progress) (Pheng and Chuan, 2001), it suggested that the use of the visual elements of the model contributed to collaborative teamwork and worker empowerment (Bryde and Schulmeister, 2013). This paper presents the LCM as a production planning and control model aiming to discuss the model’s underlying ideas and to make a contribution towards more effective construction planning and control systems through increased process transparency.
Challenges in production planning and control
In planning and control, different hierarchical planning levels are necessary because production management decisions differ greatly with regard to the length of time over which their consequences persist (Vargas et al., 2015). Long-term planning is mostly related to strategic decisions, concerned with setting objectives (Kerzner, 2013). Middle-term planning is concerned with the means for achieving those objectives, involving tactical decisions within the constraints established by long-range decisions (Harris and McCaffer, 2013). Finally, at the operational level, short-term decisions address control, by moving materials and workers, adjusting processes and equipment and taking the actions required to ensure that the system continues to function towards its goal (Lee et al., 2006). Different planning horizons imply distinct planning frequencies, modelling assumptions and levels of detail. A major challenge in any planning and control system is to maintain consistency between different decision-making levels (Harris and McCaffer, 2013; Kerzner, 2013). In construction, the traditional functions of planning, execution and control tend to be disconnected and unbalanced (Ballard et al., 2009; El-Sabek and McCabe, 2017). Scheduling tends to be overemphasised and sometimes perceived as being synonymous with project management as a whole (Kerzner, 2013).
In traditional project management, an approach named “management-as-planning” is often adopted, in which the creation, revision and implementation of plans dominate the management activity (Cooke and Williams, 2013). The planning process and its outputs are not questioned and it is assumed that what is planned can be carried out. This assumption has been widely criticised in the literature (Johnston and Brennan, 1996; El-Sabek and McCabe, 2017) since it is not usually possible to foresee emergent circumstances, or to maintain a comprehensive representation of them. Uncertainty is often neglected and the necessary actions to minimise it or eliminate its effects are often not undertaken (Ballard et al., 2009).
In traditional project management, execution focusses on the co-ordination of people and resources and the integration and implementation of activities to complete work defined in the master plan (PMI, 2008). Plans are delivered as work authorisation from higher level management to operational crews, assuming that tasks are fully understood (Koskela and Howell, 2002c; Ballard et al., 2009; El-Sabek and McCabe, 2017).
In execution, activities cannot be carried out as planned since uncertainty and interdependence between tasks are not properly recognised (Koskela et al., 2010; Kenley and Seppänen, 2010). This causes a type of waste in construction called “making-do”, since tasks are often started without all of the necessary inputs (such as machinery, tools, personnel, instructions, etc.) (Koskela, 2004; Fireman et al., 2013). This leads to re-scheduling and delays in daily operations (Johnston and Brennan 1996), work in progress, longer lead times and more operating expense (Koskela, 2004).
In addition, there is little feedback on the feasibility of work in execution and issues that arise daily in the construction process are discovered too late to prevent interruptions in processes (Koskela and Howell, 2002b).
The Project Management Body of Knowledge (PMI, 2008) defines control as measuring and evaluating performance and taking corrective action when performance diverges from plan, corresponding to what has been called the “thermostat model” (Howell and Ballard, 1996; Koskela et al., 2002). This means that variances between the standard and the measured values are used for correction, so that the standard can be reached (Koskela and Howell, 2002b). This approach does not emphasise the need for a root cause analysis of problems that arise (Laufer and Tucker, 1987) or an effort to understand the sources of problems. Consequently, there is little encouragement to learning.
The Last Planner System® (LPS) of production planning and control is an example of a planning and control system that addresses the problems outlined above and it is based on the idea that commitments need to be managed. Planning and control is divided into a hierarchically organised set of meetings involving crew leaders and lower level management, making it possible to communicate objectives and define responsibilities consistently (Hamzeh et al., 2015). Evidence suggests that LPS has been successfully adopted in a large number of projects in different countries (AlSehaimi et al., 2009; Viana et al., 2010). It is believed that the implementation of LPS could benefit further from strategies supporting an improved process transparency and communication during implementation, to avoid inadequate use of information needed for effective collaboration and decision making (Alarcón, 2005; AlSehaimi et al., 2009; Kalsaas et al., 2009).
The need for more systematic applications of VM
The systematic application of VM in production planning and control is necessary for the following reasons:
To facilitate collaboration and hierarchical planning: a high capacity for handling and exchanging information is required (Shingo, 1989; Pasquire, 2012), in order to effectively direct, co-ordinate and communicate between all parties involved in the realisation of a construction project. In execution, transparent, lower level plans are needed, to facilitate this exchange of information in real time.
To support continuous improvement: it is necessary to make process and information flows between the different functions transparent, in order to fully understand the sources of errors, to identify improvements, to correct them and to facilitate communication between the interfaces during implementation (Laufer and Tucker, 1987; Koskela and Howell, 2002a).
To develop trust and motivate process participants: construction sites usually have few visual mechanisms to inspire, instruct or motivate workers to carry out their jobs more effectively, efficiently and safely (Tezel et al., 2015). Process transparency can enhance clarity of information on the task at hand and encourages further communication between participants (Crumpton, 2011).
Table I highlights the key findings from the literature review.
Research method
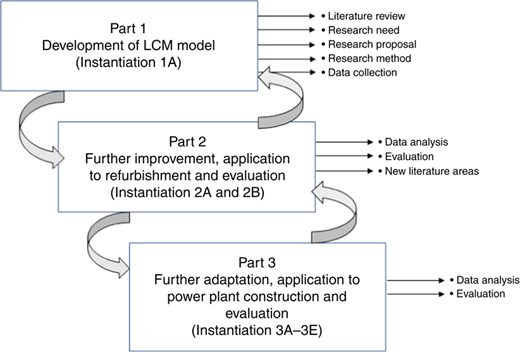
The main author had the opportunity to develop the first version of the LCM model on-site to resolve issues experienced in daily planning and control. This client-context situation led to further study and development within the context of a doctoral research project to understand the underlying ideas of LCM and to access its utility. This research adopted a design science approach to the analysis, evaluation and improvement of an artefact (Figure 1). A key outcome of this type of research is an artefact which satisfies the criteria of: solving a problem, and delivering value and/or utility.
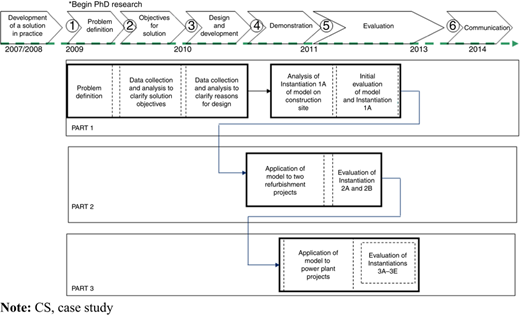
Design science artefacts can be of four types (March and Smith, 1995): constructs, models, methods and instantiations. A model, such as LCM, is a set of propositions or statements expressing relationships among constructs. The research followed the six steps proposed by Peffers et al.’s (2007): (1) problem identification; (2) definition of objectives; (3) design and development; (4) demonstration; (5) evaluation; and (6) communication. The present paper is focussed on step (5) evaluation, a key element in the process (Vaishnavi and Kuechler, 2007). LCM was evaluated based on its implementation in three types of construction projects: one newly built residential project (instantiation 1A); two commercial refurbishment projects (instantiation 2A and 2B); and five power plant construction projects (instantiations 3A−E). In each of the three project scenarios a different, improved version of the model was used. These projects were selected primarily for the availability of a project management team willing and able to implement the model. Also, it was deemed important to apply the model in different project conditions to further justify the model design and to obtain insights on the model’s functioning and generalisability. An important element of the research was to determine whether the model was applicable to these different scenarios and to what extent it improved planning and control. The research process, depicting the three different parts of the research, is shown in Figure 2.
The framework adopted to evaluate LCM is based on the aims and objectives if the model and is shown in Table II. A design science solution must meet the headline criteria of usefulness and applicability (Lukka, 2003; Vaishnavi and Kuechler, 2007; Peffers et al., 2007). Five aims of the model were identified under the criterion of usefulness, each providing a distinct sub-criterion: improving daily planning; removing constraints to the planned work; removal of waste; improving transparency; and delivering measurable improvement. Given that the model had already been applied on a project at the commencement of the research, the applicability criterion focussed on its adaptability for different types of projects. Each aim was translated into an answerable research question.
In Part 1, the construction project involved a block of 32 residential apartments (5,000 sqm) in Germany. Part 1 focussed on the initial development and instantiation (1A) of the LCM model. Five main sub-contractors were responsible for the majority of the construction work. Data were gathered from notes on informal discussions with sub-contractors and the site foreman and from reports provided by the project manager, who had documented issues experienced in the construction process over a time period of several weeks (prior to the main authors involvement in the project). Other data included photos, presentations, pie charts and other illustrations (Table III).
In Part 2, the model and its implementation method were further developed and applied to two refurbishment projects (instantiation 2A and 2B). The main focus of part 2 was to show how LCM could be adapted to suit refurbishment and to carry out an evaluation of the applicability and usefulness of the model on that context. The project for instantiation 2A was the refurbishment of a building with five floors; three levels of offices and two technical levels (2,870 sqm). Data for the evaluation was gathered based on semi-structured interviews carried out with the client and foreman. In addition, KPI data on on-time performance and quality were used to evaluate the utility of the model (Table IV).
In Part 3, the LCM model was adapted and applied to five power plant construction projects (instantiations 3A–E), 3 of which took place in Germany, 1 in the Czech Republic and 1 in the Netherlands. Power plant construction differs to other types of construction mainly in the complexity of the material used and high level of detail needed for the day-to-day assembly process. Data gathered consisted of documentation such as photos, descriptions of the application process, examples of visual tools used, templates for visual tools, presentations and reports on application, as well as semi-structured interviews (Table V). To evaluate the usefulness of the model, KPI data were gathered on crane utility and on-time performance of sub-contractors, including reasons for low performance from four further instantiations (3B–E).
The LCM model
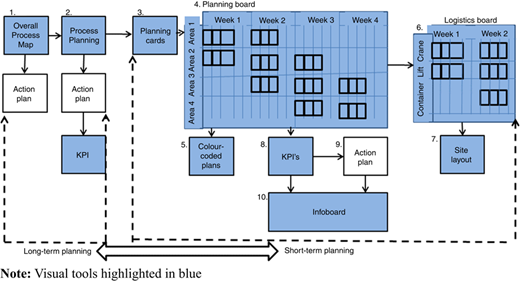
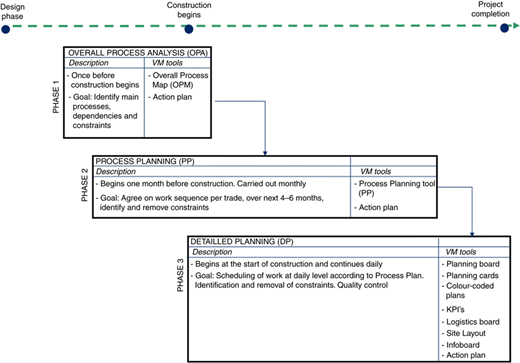
Figure 3 presents an overview of the LCM model and illustrates how the flow of information in the production planning process is facilitated by the systematic application of a number of visual tools. The model divides production planning and control into three sub processes (Figure 4): the overall process analysis (OPA) phase; the process planning (PP) phase; and the detailed planning (DP) phase, providing a visual link of information between them.
Visual tools provide physical aids to the flow of information on the project, with the aim of making both plans and actual work in progress transparent to participants. The main visual elements of the model are the overall process map (OPM) (Phase 1), PP tool (Phase 2) and the planning board (Phase 3).
These are designed to render the planned work transparent and allow the feasibility of plans to be more readily questioned. In this way, constraints are made explicit and can be resolved as early as possible.
In the execution phase, the tools are situated in a discrete planning area on the construction site, called the LCM area, where daily and weekly meetings take place and information is gathered and retrieved.
Phase 1: OPA
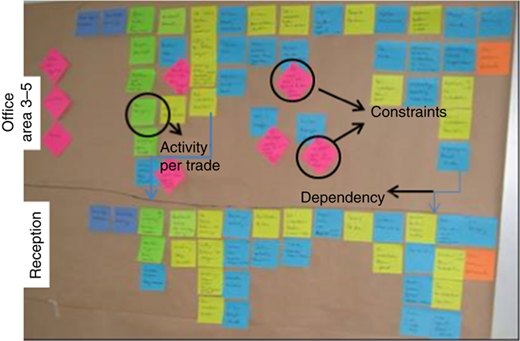
The OPA is carried out two to three months before construction work begins (Figure 4). It consists of two to five workshops during which an analysis of the overall project process is carried out. Participants include key planners, the site manager, client representatives and the LCM manager (who prepares and facilitates the workshops). The goal of the OPA is to produce the first visual element of the model, the OPM (No. 1, Figure 3; Figure 5).
The OPM uses post-it notes on brown paper to visualise: the main construction processes; their interdependencies and interfaces; and any identified constraints. Each of the post-it notes shown in Figure 5 represents an activity. Each trade is represented by a different colour, while the pink diamond post-it notes describe perceived constraints. The post-it notes are arranged along two axes, the x-axis representing location and the y-axis representing time. Once the OPM is completed, discussion centres around solutions for the removal of constraints. These are documented in an action plan monitored by the site manager. For each constraint and action, a person responsible is defined and a target completion date set.
Phase 2: PP
The PP phase begins at least one month before construction commences and continues throughout the execution phase (Figure 4). Monthly PP workshops, involving the same participants as in the OPA, and, in addition, the construction companies, focus on agreement to the sequence of work activities and constraints to be removed within a four-to-six-month timeframe.
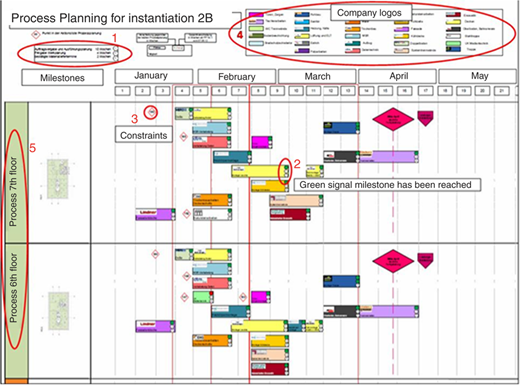
The PP tool (No. 2, Figure 3; Figure 6) is a visual representation of this agreement. It is structured according to the locations and processes (No. 5, Figure 6) identified on the OPM. Each trade has its own colour and the construction activity blocks on the PP reflect these colours (No. 4, Figure 6). Each activity is checked against defined milestones such as material delivery dates and approval dates; and against availability of resources (Nos 1 and 2, Figure 6). Milestones are agreed by the participants in the PP workshop. The LCM manager or the site manager facilitates the discussion and ensures that the sequence of work is in accordance with the process represented on the OPM and that solutions to constraints (see e.g. No. 3 in Figure 6) have been identified and documented in the action plan (No. 9, Figure 3).
Phase 3: DP phase
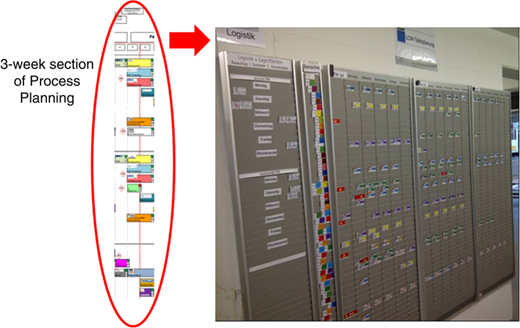
DP begins when execution commences. A three-to-four-week timeframe section from the PP tool is the focus for the DP meetings, which take place on both a daily and weekly basis and are attended by the same participants as in the PP. In preparation for the weekly meetings (lasting 10–20 mins), daily work packages to be completed are documented on planning cards (No. 3, Figure 3) and distributed on the planning board (No. 4, Figure 3; Figure 7) in the LCM area.
Constraints to be resolved are identified and entered in the action plan (No. 9, Figure 3). In addition, the needed resources, such as cranes, lifts and containers, are identified and visualised on a logistics board (No. 6, Figure 3). An adjacent site layout board (No. 7, Figure 3) displays areas allocated for material and equipment storage, keeping the site tidy and resolving conflicting demands for space.
Daily meetings (lasting 5–10 minutes) focus on work completion, quality and improvement actions from the previous day.
The planning board is the central tool in LCM (No. 4, Figure 3), displaying the planning cards and linking these and the other visual tools (Nos 1–10, Figure 3) to provide a comprehensive overview of the current state of the construction process. It thus facilitates co-ordination of work crews at operational level.
The colour-coded plans highlight different areas of the structure on a layout. At the start of their shift, leaders of work crews take their planning cards from the planning board and place it on the colour-coded plans to indicate to all where work is taking place (No. 5, Figure 3). When work is completed, the work-crew leader turns the planning card around, displaying the green reverse side. This initiates a quality check by indicating to the foreman that the task has been completed.
If the quality of the work is good, the card is placed back on the planning board by the site manager. If the work has not been properly completed, an action is defined and the card remains on the plan until that action has been completed. KPI data, such as on-time performance and results from quality inspections, are gathered and discussed during the daily meetings, in order to facilitate continuous improvement. The on-time performance KPI is a measure of total number of cards completed compared to those planned and the quality KPI measures the number of quality issues per completed card.
The KPIs are displayed, along with OPA, PP and DP, role descriptions and safety information, on an Infoboard (No. 10, Figure 3).
Model design basis
Each phase of LCM was designed to tackle construction planning, execution and control challenges by using specific visual tools. The OPA (strategic objectives) facilitates early stakeholder involvement, identification of optimal work flow and interdependency control. The PP (medium-term planning) is primarily concerned with identifying and removing constraints. The DP (short-term planning) is used for day-to-day work co-ordination and resolving short-term issues. Table VI displays a summary of how the design of each phase in LCM addresses those challenges.
LCM evaluation
Instantiation 1A: application to a newly built residential building
One goal of the research was to review the problem definition, LCM objectives and its initial development, aiming to achieve conceptual understanding. This was done through a synthesis of the literature and application of the insights gained to an analysis of its first instantiation.
The first instantiation was on a newly built residential building. Quality issues and lack of continuous improvement were evident on this project, which presented poor communication between work teams.
Feedback from the site foreman indicated that the introduction of the LCM visual devices supported him in identifying problems earlier and working with sub-contractors to resolve them more quickly.
Through instantiation 1A, the researcher identified the need for an implementation method as a guide for future implementations, leading to the clarification of three distinct phases, with a specific definition of tasks and purposes for each. An improvement to the model was an extension of the logistics board to better control resources on-site.
Instantiations 2A and 2B: application to commercial refurbishments
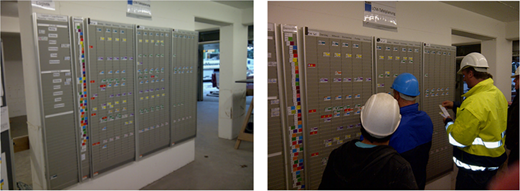
The revised model was then applied to two refurbishment projects (Plate 1), which often involves a higher level of uncertainty and a large number of small independent tasks.
The implementation of LCM instantiations 2A and 2B and feedback from the participants interviewed provided evidence that this model could be adapted and applied to this context. Some new visual tools were developed: the PP tool was developed to provide a better link between the OPA and DP; the addition of a KPI to measure the stability of the PP (monitoring the number of changes to planned activities from month to month); the addition of colour-coded plans to visualise work in process; and a more detailed logistics board to improve material and resource planning.
With regard to usefulness, the interviewees (Table IV) reported that the model helped improve daily planning on-site. The visualisation of the PP (long-term), followed by a more detailed visualisation on a daily level using the planning board (short-term), meant that problems could be detected earlier. The visual tools applied therefore made information transparent at the most suitable frequency and level of detail needed for that phase.
According to the client, this meant that the nature of the type of problem could be dealt with more precisely, leading to more feasible assignments and better quality levels. In addition, the proximity of the planning board to the area of work also encouraged timely feedback on progress and emergent constraints between participants. KPI data were gathered on: on-time performance of the sub-contractors and quality of work (2A and 2B); and process stability (2B). Table VII presents an overview of the main KPI data gathered and the average percentages achieved during the observation periods.
However, during instantiation 2B, not all problems could be resolved. Six months, after construction commenced, stability declined since the roof supplier could not meet delivery dates, which affected progress in other areas. This highlights one of the challenges in LCM application, when supply chain members are not involved.
During instantiation 2A, a positive effect of more accurate planning and timely constraint removal was a reduction in time buffers between tasks. This contributed to a reduction in the overall completion time of the project by two months. Similarly, in instantiation 2B, a further extension of the completion date of the project by six weeks (due to unforeseen extra brick work) was avoided by being able to better utilise time buffers between activities.
Instantiations 3A–3E: application to power plant construction
Finally, LCM was adapted and applied to five power plant construction projects (instantiations 3A–3E). The goal of LCM on all the power plants was to optimise buffer times, crane utilisation and in turn reduce overall lead time for execution. The first instantiation (3A) involved adapting the model to suit power plant construction, and the four further instantiations (3B–3E) permitted the gathering of evidence for evaluating its usefulness.
The successful adaptation of LCM to power plant construction during instantiation 3A and its roll out to four further sites provided evidence on LCM’s applicability to different contexts. Some visual elements were adapted to better suit the nature of power plant construction and some visual elements were found to be less effective: the OPA was not used as a more detailed description of the assembly process was needed; the PP was created in Primavera to simplify training as this programme was already in use; and additional visual planning tools were added to support the need for more detail on the assembly process and material requirements. For example, an “Excel Part List” and “Detailed Planning Form” were introduced to document and visualise the higher level of information needed for DP. According to the interviewees, LCM could be adapted and applied to the specific nature of power plant projects. Feedback indicated that the PP helped to identify and reach milestones. Transparency of these milestones was important since a large amount of documentation was needed for work to be carried out.
Regarding utility, interviews with LCM managers indicate that a notable improvement in transparency, communication and daily planning was achieved and that, as a result, material requirements were better defined and cranes better utilised. A key issue before LCM application was poor communication on material requirements between engineering and construction (the detail on requirements was often delivered much too late). The visualisation of the PP helped to clearly identify when information on material requirements should be delivered and what constraints were anticipated a number of weeks in advance. It also helped to improve the understanding of a highly complex process and in turn the reaction time to change and on-time performance (the early recognition of constraints improved work feasibility). More accurate planning led to a reduction in lead time in some areas of the power plants (main steel, secondary steel) – in some cases by up to two months.
KPI data were gathered in four power plant construction projects, and appear (during certain periods) to support the client’s view that the daily planning, crane utility and OTP were improved. Table VIII presents an overview of the KPIs and average percentages achieved during the observation periods. Table IX summarises the key findings from each project.
Discussion and conclusions
This paper presented a construction planning and control model which uses a set of visual tools that has contributed to increase process transparency and improve the performance of different types of construction projects. Traditional project management in construction presents challenges that have been addressed by the model, such as maintaining consistency between long- medium- and short-term planning so that feasible execution plans are created and that control is more focussed on prevention rather than correction. The systematic application of visual tools at different planning levels helps to better connect the objectives at each level and facilities more focussed communication on problem solving and prevention.
The model demonstrates this in particular with the OPA (long-term), the PP (medium-term) and the DP (short- and medium-term) where the order of work is visualised at these different levels of detail. These visual tools provide a physical way to make the information flow on planned work transparent so that communication is facilitated between planning and control team members at different tasks. Several benefits have been identified in different planning and control tasks, such as better management of commitments (by using planning cards), effective identification of constraints before they occur and sound improvement action plans for problems that have occurred. The physical display of the visual tools of LCM in the discrete planning area on-site also encourages a regular exchange between participants on actual work progress as it unfolds, leading to more timely reaction to the problems at hand.
The benefits of improved transparency through LCM were analysed in the instantiations discussed in this paper. In some cases, improvements in the lead time were identified (instantiations 2A and 3A–3E). Further examples of benefits were a more accurate and timely communication on material requirements, reducing delays and improving crane utilisation during power plant construction (instantiations 1A, 2A, 2B, 3A–3E).
With regard to theoretical relevance, the instantiations of the model tend to confirm the critique of traditional project management, providing evidence from a number of projects that work could not be carried out as planned leading to uncertainty and re-scheduling and that control was correction focussed rather than on prevention, prior to the application of the model (instantiations 1A, 2A and 2B). The application of the model contributed to overcoming those planning and control challenges by integrating different planning and control tasks, and increased process transparency to improve work feasibility, commitment and problem prevention.
There were some limitations in the assessment of LCM, such as limited availability of KPI baseline data. Although the data are not conclusive, it can form a basis for future comparisons. Another limitation is that while LCM can improve daily planning through increased transparency, it cannot remove obstacles caused as result of non-compliance. However, increased knowledge on LCM application through training can help to improve active participation during implementation.
Further research is needed to investigate the wider application of the model, particularly to the design phase and how LCM could be combined with existing BIM tools to extend their application to planning and execution processes. Furthermore, the model could be extended to further improve the visualisation of work on-site, the management of materials in working areas, health and safety provisions; and the integration of additional methods such as 5S to achieve a cleaner and better organised site.