


This study investigates how industrial agglomeration (IA) affects green total factor productivity (GTFP) in the construction sector, whether construction consulting services (CCS) moderates this relationship, and how environmental regulation influences these mechanisms. A unified framework is developed to offer theoretical and empirical insights for green transformation in the sector.
Using data from China’s construction industry (2008–2022), GTFP is measured with the Slacks–Based Data Envelopment Analysis model. IA is quantified by the location quotient, and CCS is assessed across provinces. Multiple regression models examine the non-linear IA–GTFP relationship and CCS’s moderating role. Capital efficiency, labor efficiency, energy efficiency, and carbon emission efficiency are measured, and formal and informal environmental regulations are examined as contextual factors.
IA shows an inverted U–shaped relationship with GTFP, promoting productivity at moderate levels but restraining it when excessive. CCS directly enhance GTFP and weaken the curvature of the IA–GTFP link. IA improves labor efficiency but exhibits inverted U–shaped effects on capital, energy, and carbon efficiencies, while CCS mainly strengthen energy and carbon efficiencies. Particularly, informal environmental regulation amplifies these positive effects.
The study relies on inter-provincial data, limiting insights into individual units’ performance. Findings are specific to China’s construction industry, and cross-national generalization requires further verification. Recommendations have not been fully validated in practice. Future research should explore different types of CS, their roles in green technologies, enterprise innovation, and the diffusion mechanisms of CS networks across regions.
Policymakers can develop region-specific industrial agglomeration strategies and enhance CS support to optimize GTFP. Promoting green technologies, environmentally friendly construction, and consulting service systems can strengthen labor, energy, and carbon efficiency. Combining formal policies with public-driven informal regulation helps achieve sustainable development and high-performance industrial ecosystems.
Informal environmental regulation, driven by public awareness and green economic development, enhances IA and CS effectiveness, promoting socially responsible growth in the construction industry. Strengthening public participation and environmental consciousness contributes to sustainable urbanization and climate-friendly practices.
The first study to integrate IA, CCS, and GTFP into a unified empirical framework, revealing the mechanisms linking IA, CCS, and environmental regulation to green productivity in construction industry.
1. Introduction
With increasing global environmental concerns and the advancement of sustainable development goals, improving green total factor productivity (GTFP) (A comprehensive list of abbreviations is provided in Appendix 1) has become an essential pathway for achieving high-quality economic growth (Ahmad and Wu, 2022; Javeed et al., 2023). As a principal result of economic growth, industrial agglomeration (IA) profoundly influences production efficiency and resource allocation. Nevertheless, the precise mechanisms through which IA influences GTFP remain debated (Qiu et al., 2021; Zhu et al., 2019). IA can enhance GTFP through resource sharing, knowledge spillovers, and economies of scale, yet excessive IA may intensify resource and environmental pressures, leading to declining efficiency (Taylor and Ömer, 2019; Tian et al., 2023). Identifying the optimal agglomeration threshold thus offers a pathway for balancing economic expansion with environmental sustainability in the construction sector (Wu et al., 2022; Zhu et al., 2019).
The construction industry, given its substantial resource consumption and environmental footprint, has attracted growing scholarly attention to GTFP enhancement (Li et al., 2023). Unlike traditional total factor productivity (TFP), which neglects environmental externalities, GTFP provides a more comprehensive evaluation by incorporating energy consumption as an input and carbon emissions as an undesirable output (Hu et al., 2024; Sun et al., 2025).In recent years, a limited number of studies have begun to explore the relationship between IA and GTFP in the construction industry. For example, Zhao et al. (2021) analyzed the spatial agglomeration characteristics of China’s construction industry, while Wang et al. (2023) identified a positive effect of IA on TFP. However, these studies did not adequately account for the environmental constraints inherent in green development. In particular, empirical measurements and investigations of the underlying mechanisms linking IA to GTFP in the construction sector remain insufficient.Table A1
Within the construction industry, construction consulting services (CCS) integrate multidisciplinary expertise throughout the project lifecycle, spanning architectural design, engineering consulting, project supervision, cost estimation, and allied activities that optimize production through technological innovation and specialized coordination (Hu et al., 2022). CCS constitutes a distinctive endogenous driver within the industry. Under the IA mechanism, CCS mitigates the “crowding effect” of excessive agglomeration by converting concentrated resources into GTFP gains through knowledge coordination, resource optimization, competitive regulation, and policy adaptation. By integrating IA, CCS, and GTFP into a single empirical framework, this study opens an analytical perspective that neither strand of the existing literature can offer alone.
This study focuses on investigating the impact of IA on GTFP and the moderating role of CCS in the construction industry, including three questions: (1) how IA influences GTFP; (2) whether CCS moderates the relationship between IA and GTFP; and (3) what mechanisms underpin these effects, especially the role of environmental regulation. Therefore, it will develop and empirically examine a comprehensive framework that integrates IA, CCS, and GTFP. The findings will provide policy implications for advancing the green transformation of the construction industry, while contributing new theoretical insights to the literature on industrial economics and green development.
2. Theoretical analysis and research hypotheses
2.1 GTFP in the construction industry
As a resource-intensive, high-emission sector, the construction industry’s productivity evaluation must incorporate energy consumption and environmental performance to capture industry sustainability accurately. GTFP extends neoclassical growth theory by treating energy as an input and pollution as an undesirable output, correcting the core limitation of traditional TFP measures that neglect environmental externalities (Wang et al., 2023). Improving construction-sector GTFP is therefore essential for optimizing energy utilization and advancing long-term green development (Xu et al., 2019).
GTFP in the construction industry is shaped by four interrelated dimensions. Technological innovation—green building design, prefabrication, and BIM—reduces resource waste while raising efficiency (Li et al., 2023). Market dynamics shape firms’ green incentives: moderate competition spurs resource allocation and innovation, whereas excessive rivalry fosters short-termism, and heterogeneous consumer preferences raise the cost of sustainable product development (Wang et al., 2021). Firm-level characteristics—resource allocation efficiency, financing capacity, and R&D investment—determine internal capability to adopt green technologies (Johnstone, 2020; Sandra Marcelline et al., 2022). Institutional factors—emission trading schemes, green certification systems, and tax incentives—provide the external governance framework for technological upgrading and low-carbon development, though effectiveness depends on appropriate policy design and regulatory intensity (Chen and Zheng, 2023; Wang and Yan, 2022). These dimensions operate systemically: technology provides foundational tools, market forces generate incentives, firm characteristics determine absorptive capacity, and institutions set regulatory boundaries. Their integration within a unified framework underpins the approach developed in this study.
2.2 IA on GTFP in the construction industry
IA refers to the geographic clustering of firms within the same industry, generating Marshallian externalities through labor specialization, shared knowledge, and the supply of intermediate goods. Among available measurement indicators, the location quotient (LQ) is most widely used, enabling regional assessment without firm-level data by comparing a region’s economic or employment proportion to the national average (Kim et al., 2021; Wang et al., 2023).
The IA–GTFP relationship varies with clustering intensity. At moderate agglomeration levels, positive externalities dominate: integrated production networks facilitate knowledge spillovers, technological exchange, and information sharing among firms (Cao et al., 2017). Construction professionals can adopt advanced technologies, accelerating energy-efficient diffusion (Wu et al., 2019), while shared access to skilled labor and materials enhances procurement efficiency and resource allocation (Jain et al., 2022). These scale and spillover effects collectively improve GTFP.
Beyond a threshold, however, negative externalities accumulate. Excessive clustering generates infrastructure congestion, resource crowding, and input scarcity, raising operational costs and carbon emissions (Mao et al., 2023). Knowledge homogenization crowds out heterogeneous innovation (Zhang et al., 2019), while intensified competition triggers “race-to-the-bottom” dynamics that suppress long-term R&D investment (Taylor and Ömer, 2019). Entrenched interest groups in concentrated regions may further weaken environmental enforcement. These dynamics point to diminishing marginal returns and an optimal agglomeration range within which scale economies and knowledge sharing outweigh congestion costs. Based on this reasoning, Hypothesis 1 is proposed.
IA affects GTFP in the construction industry in an inverted U–shaped manner: it contributes positively at lower levels but results in diminishing productivity gains under excessive clustering.
2.3 CCS on GTFP in the construction industry
Prior research has identified several factors moderating the IA–GTFP relationship. For instance, environmental regulation reshapes the agglomeration–productivity nexus by raising compliance costs while inducing compensatory green innovation, with net effects varying non-linearly with regulatory intensity (Chen and Zheng, 2023; Wang and Yan, 2022). Digital infrastructure enables clustered firms to recombine distributed knowledge, amplifying co-location productivity gains (Hu et al., 2024). FDI inflows and industrial upgrading alter cluster factor composition, shifting the GTFP efficiency frontier (Tian et al., 2023). However, what these studies share is an external orientation—regulatory mandates, capital inflows, digital policy—while the sector’s internal service capacity has received little attention. This gap is consequential in construction, where project-based organization and subcontracting fragmentation create coordination demands that agglomeration externalities alone cannot resolve. CCS addresses precisely these demands, integrating multidisciplinary knowledge and technology across the project life cycle—from planning and design to operation (Li et al., 2020), serving as a catalyst for green technology diffusion and management innovation (Adesi et al., 2018; Hu et al., 2022), and directly contributing to GTFP improvement. Accordingly, this study proposes Hypothesis 2.
The development of CCS in the construction industry promotes improvements in GTFP.
CCS conditions the impact of IA on GTFP through four distinct mechanisms. The first is knowledge diffusion. Drawing on KIBS theory, CCS serves as intermediary nodes through which tacit knowledge—green building standards, energy compliance protocols, project management innovations—circulates across otherwise isolated firms (Adesi et al., 2018). At moderate clustering levels, this intermediation accelerates energy-efficient diffusion. As agglomeration deepens, dense relational embeddedness can erode the incentive to share expertise, such as through reducing labor efficiency (LE). The second is resource allocation. CCS provides procurement coordination and cost optimization expertise that substitute for dysfunctional market mechanisms under resource scarcity in congested agglomerations (White, 2020), with energy efficiency (EE) as the main pathway. The third is competitive ordering. Without professional intermediation, intense competition compresses planning horizons and crowds out green innovation (Lee, 2023). CCS mitigates this issue by providing standardized solutions and benchmarks that separate green performance from competitive rivalry (Chathuranga et al., 2023), with implications mainly for capital efficiency (KE). The fourth is institutional-policy transmission. CCS firms are embedded in the sector’s regulatory framework, interpreting policy requirements and translating compliance obligations into operational decisions (Li and Ning, 2022). As agglomeration expands, pressures of regulatory capture will weaken enforcement effectiveness, with likely impacts on carbon emission efficiency (CE). Therefore, the study proposes Hypothesis 3.
CCS influence the inverted U–shaped relationship between IA and GTFP. Specifically, advanced CCS promote an optimal level of IA while moderating the steepness of the curve.
3. Research design
3.1 Research design overview
Figure 1 illustrates the research roadmap, which comprises five sequential phases.
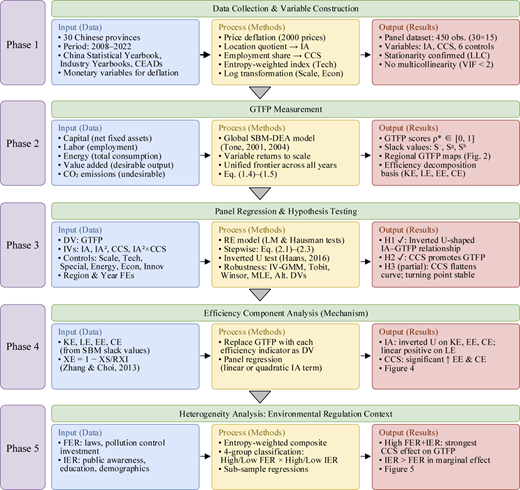
Phase 1 establishes the empirical foundation through data collection and variable construction for a panel of 30 Chinese provincial DMUs over the period 2008–2022. Phase 2 specifies the measurement approach for GTFP. Phase 3 empirically tests H1–H3 using three panel regression models with progressively increasing complexity. Phase 4 decomposes GTFP into four factor-specific efficiency components, KE, LE, EE, and CE. Phase 5 re-estimates the baseline relationships across four regulatory subgroups to assess the moderating role of environmental regulation.
3.2 Data collection and variable construction
This study examines the construction industry across 30 Chinese provinces, municipalities, and autonomous regions, excluding Xizang, Hong Kong, Macao, and Taiwan province due to data limitations. Each province–year observation is treated as an independent decision-making unit (DMU), resulting in a balanced panel of 450 DMUs (30 provinces over 15 years, 2008–2022). To capture regional heterogeneity, the sample is classified into three groups: Eastern (Beijing, Tianjin, Liaoning, Hebei, Shanghai, Jiangsu, Zhejiang, Fujian, Shandong, Guangdong, and Hainan), Central (Shanxi, Anhui, Jiangxi, Jilin, Heilongjiang, Henan, Hubei, and Hunan), and Western (Inner Mongolia, Guangxi, Chongqing, Sichuan, Guizhou, Yunnan, Shaanxi, Gansu, Qinghai, Ningxia, and Xinjiang).
Economic and employment data are primarily retrieved from the China Statistical Yearbook and relevant industry yearbooks. To ensure inter-temporal comparability, all monetary variables are adjusted to 2000 constant prices using local GDP deflators. Carbon emission and energy consumption data are sourced from the China Emission Accounts and Datasets (CEADs). All statistical analyses are performed using Stata 17.0.
3.3 GTFP measurement
This study employs a global Slacks-Based Measure Data Envelopment Analysis (SBM–DEA) model to evaluate GTFP. In contrast to conventional radial DEA models, the SBM–DEA framework explicitly incorporates input and output slacks into the objective function, thereby eliminating radial bias and allowing for the simultaneous consideration of both desirable and undesirable outputs (Tone, 2001, 2004). The adoption of a “global” production technology further enhances the robustness of the analysis by constructing a unified production possibility set that encompasses all DMUs across the entire study period. This specification ensures intertemporal comparability and mitigates the risk of spurious efficiency improvements arising from shifts in annual production frontiers.
Formally, consider a set of DMUs, each characterized by three vectors: inputs , desirable outputs , and undesirable outputs , where , , and denote the number of inputs, desirable output, and undesirable output variables, respectively. Define matrices , , and as:
According to Tone (2004), the SBM–DEA is modeled as follows:
In this model, the objective function value represents GTFP. The slack values of inputs, desirable outputs, and undesirable outputs are , , and , respectively. When , the slack values , , and are all zero, indicating that the DMU is efficient. When , the DMU is inefficient, and improvements are necessary. The subscript “0” denotes the DMU whose efficiency is being estimated. is the weight vector, and the technical setting with variable returns to scale is defined as . The specific operationalization of each variable, including deflation procedures and data sources, is described in Appendix 2 for reference.
3.4 Panel regression model and variables
Three regression equations are specified to test the hypotheses developed in Section 2, each building on the last. Eq. (2.1) estimates the baseline main effects of IA and CCS on GTFP—the foundation against which H2 (direct CCS effect) is evaluated. Eq. (2.2) introduces a squared IA term; a significant negative coefficient on this term, combined with the inverted U-shape tests described in Section 3.5, would constitute evidence for H1. Eq. (2.3) incorporates both first- and second-order IA×CCS interaction terms, allowing the curvature of the IA–GTFP relationship to vary with CCS levels—the empirical expression of H3. The incremental structure of this specification strategy reflects the theoretical logic of Section 2: each layer of the model corresponds to a distinct hypothesis and builds on the patterns established by the preceding layer.
In these equations, is the dependent variable for in year t, while and are independent variables. “Control” represents a vector of multiple control variables, is the residual, α is the constant, and β and γ are coefficient vectors.
Following Haans et al. (2016), this study adopts a four-step procedure to validate the presence of a U-shaped relationship. First, the coefficient on the squared IA term is required to exhibit the theoretically expected sign and to be statistically significant. Second, the estimated slope at the lower bound of the IA distribution must be significantly positive. Third, the slope at the upper bound must be significantly negative. Fourth, the implied turning point must lie within the observed range of the data. In addition, cubic specifications are estimated to exclude the possibility of higher-order functional forms. The moderating effect of CCS on the turning point of IA* is analytically derived as . A t-test is then employed to assess whether CCS significantly shifts the turning point, while supplementary tests are conducted to evaluate whether CCS influences the curvature of the relationship. All estimations are implemented using the utest routine in Stata 17.0.
GTFP, the dependent variable, is measured using Eqs. (1.1)–(1.5). IA, the core independent variable, is calculated via the location quotient (LQ) as:
where Cit and GDPit are value added and total production of DMUi, respectively. IA represents the share of value added in the total GDP of DMUi, relative to the corresponding share across all DMUs.
The moderating variable CCS is defined as:
Following the convention of using sectoral employment share as a proxy for service input (Cheng et al., 2023; Du and Zhang, 2023; Hu et al., 2022), this study operationalizes CCS as the proportion of building supervisors and survey/design staff () in total construction employment ()—categories explicitly reported in China’s Statistical Yearbook of the Construction Industry. These roles constitute the core human capital of consulting activities, capturing both the depth and density of knowledge-intensive service delivery within a provincial construction cluster.
Similar to Chen and Zheng (2023), and Wang et al. (2024), control variables are grouped into three categories: (1) Construction industry characteristics: specialization (Special) as the ratio of general to specialized contractors, technology (Tech) as an entropy-weighted index of machinery and equipment, firm scale (Scale) as log of total assets, and energy structure (Energy) as electricity share of total energy; (2) this study uses the logarithms of the regional GDP and the number of patent applications as proxies for economic development (Econ) and technological innovation (Innov); (3) region (Region) and year (Year) to account for spatial and temporal effects.
Six robustness checks address threats to internal validity. Reverse causality is addressed via two-stage GMM using one-period lags of IA and CCS as instruments. A panel Tobit accounts for the censored GTFP distribution; Winsorization at 1% tails guards against outlier influence; MLE replaces the random-effects estimator; and two alternative GTFP measures—CRS sequential technology and a radial directional distance function (DDF)—assess measurement sensitivity. Consistent patterns across all six specifications lend confidence to the reported findings (Section 4.3).
3.5 Efficiency decomposition methods
The aggregate GTFP score produced by the SBM–DEA model compresses information across all input and output dimensions into a single index, which limits the ability to determine through which factor channel agglomeration or consulting service effects primarily operate. To recover this channel-level information, this study decomposes GTFP into four component efficiency indicators following Zhang et al. (2019): capital efficiency (KE), labor efficiency (LE), energy efficiency (EE), and carbon emission efficiency (CE). Using the slack values from Eqs. (1.4)–(1.5), each component is defined as:
Higher scores indicate proximity to the efficiency frontier for that specific input or output. Replacing the composite GTFP with each component indicator as the dependent variable—in regressions structured as Scenario (3) or (5) from Table 2, depending on whether the IA squared term proves significant—allows the analysis in Section 5.1 to locate where in the production process the effects of IA and CCS are concentrated, and thereby to test, ex post, whether the empirical patterns correspond to the mechanism-efficiency predictions.
3.6 Environmental regulation: measurement and classification
Environmental regulation enters the analysis as a contextual moderator, captured along two conceptually distinct dimensions. Formal environmental regulation (FER) reflects mandatory policy-based constraints: enforcement intensity, pollution control investment, and emission standards—the types of instruments that operate through legal obligation and government oversight. Informal environmental regulation (IER), by contrast, captures the societal pressure that operates outside statutory channels, proxied through indicators of public environmental awareness, media attention to pollution events, and community participation in environmental governance.
The two dimensions are measured separately, with composite indices for each province constructed via the entropy weight method to avoid arbitrary assignment of sub-indicator weights. Provinces are then sorted into four regulatory environments based on their relative FER and IER standings—High FER–High IER, High FER–Low IER, Low FER–High IER, and Low FER–Low IER—and the IA–GTFP and CCS–GTFP relationships are re-estimated within each group (Section 5.2).
4. Results
4.1 Regional disparities in GTFP of the Chinese construction industry
GTFP is measured across 30 provincial-level regions from 2008 to 2022. Based on provincial averages, maps generated using ArcGIS 10.8.1 for 2008–2012, 2013–2017, 2018–2022, and the overall period are shown in Figure 2. Provinces in the top 50% were distributed as follows: Eastern region (overall share of 47%), Central region (13%), and Western region (40%), indicating a notable decline in the Central region. Eastern coastal provinces consistently exhibit higher GTFP, and regional disparities have widened over time.
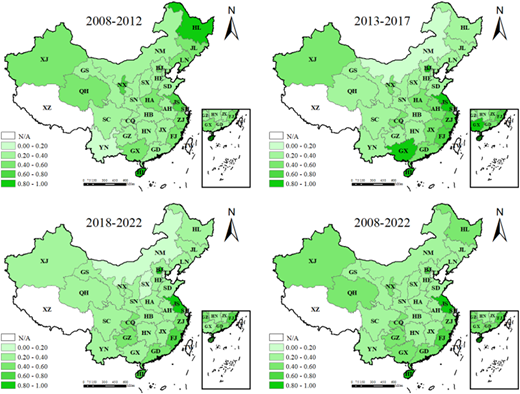
Spatial Distribution of GTFP in China’s Construction Industry (2008–2022). Source: Authors’ own work
Spatial Distribution of GTFP in China’s Construction Industry (2008–2022). Source: Authors’ own work
4.2 Empirical results and analysis
4.2.1 Descriptive statistics and regression results
Panel regression results are reported with descriptive statistics in Table 1. All variables are centralized to ensure coefficient comparability and enable interaction construction. Multicollinearity is assessed using VIF (average VIF: 1.96 for Pooled OLS and 1.67 for Within estimation), both well below 10. The LLC panel unit root test rejects non-stationarity at the 10% level for all variables, confirming suitability for panel analysis.
Descriptive statistics for variables
| Variable | N | Mean | Std. dev. | Min | Max |
|---|---|---|---|---|---|
| GTFP | 450 | 0.4240 | 0.2162 | 0.0992 | 1.0000 |
| IA | 450 | 1.1388 | 0.3622 | 0.2476 | 2.2755 |
| CCS | 450 | 0.1209 | 0.1328 | 0.0175 | 1.0754 |
| Scale | 450 | 8.0990 | 0.4339 | 7.1600 | 10.0510 |
| Tech | 450 | 0.1379 | 0.0897 | 0.0055 | 0.5678 |
| Special | 450 | 2.4051 | 1.4582 | 0.2988 | 7.5950 |
| Energy | 450 | 0.4489 | 0.1634 | 0.0841 | 0.9615 |
| Econ | 450 | −0.0297 | 0.3877 | −0.8695 | 1.1191 |
| Innov | 450 | 10.5379 | 1.5213 | 6.0661 | 13.8090 |
A panel-data random effects model was estimated, and Table 2 reports the stepwise regression across eight scenarios examining IA and CCS effects on GTFP. First, the LM test yields a chi–square of 487.87 (p < 0.01), rejecting the null of no random effects. Second, the Hausman test reports a chi–square of 11.28 (p > 0.10), confirming that the random effects model is more efficient than the fixed effects model.
Regression results
| Scenario | (1) | (2) | (3) | (4) | (5) | (6) | (7) | (8) |
|---|---|---|---|---|---|---|---|---|
| Variable | GTFP | GTFP | GTFP | GTFP | GTFP | GTFP | GTFP | GTFP |
| IA | 0.1054*** | 0.1191*** | 0.1222*** | 0.1882*** | 0.1118*** | 0.1826*** | 0.2217*** | |
| (0.0363) | (0.0366) | (0.0373) | (0.0401) | (0.0370) | (0.0411) | (0.0435) | ||
| CCS | 0.1877* | 0.2455** | 0.2406 | 0.2987*** | 0.0800 | 0.2138 | 0.0181 | |
| (0.1101) | (0.1100) | (0.1519) | (0.1089) | (0.1780) | (0.1793) | (0.1682) | ||
| IA × CCS | −0.0216 | −0.0623 | ||||||
| (0.2895) | (0.3380) | |||||||
| IA × IA | −0.2173*** | −0.2110*** | −0.2359*** | |||||
| (0.0577) | (0.0587) | (0.0602) | ||||||
| CCS × CCS | 0.2447 | 0.1235 | ||||||
| (0.2075) | (0.2078) | |||||||
| IA × IA × CCS | 1.1315** | |||||||
| (0.5751) | ||||||||
| Scale | 0.0786** | 0.0371 | 0.0439 | 0.0388 | 0.0509 | 0.0456 | 0.0517 | 0.0345 |
| (0.0355) | (0.0391) | (0.0385) | (0.0383) | (0.0378) | (0.0385) | (0.0378) | (0.0378) | |
| Tech | 0.4093*** | 0.3616*** | 0.4007*** | 0.4121*** | 0.4134*** | 0.3980*** | 0.4111*** | 0.4535*** |
| (0.1362) | (0.1375) | (0.1355) | (0.1359) | (0.1331) | (0.1356) | (0.1333) | (0.1332) | |
| Special | −0.0014 | −0.0040 | 0.0023 | 0.0032 | −0.0018 | 0.0017 | −0.0020 | −0.0013 |
| (0.0098) | (0.0100) | (0.0099) | (0.0098) | (0.0097) | (0.0099) | (0.0098) | (0.0097) | |
| Energy | 0.5377*** | 0.5282*** | 0.5303*** | 0.5341*** | 0.5266*** | 0.5249*** | 0.5238*** | 0.5199*** |
| (0.0729) | (0.0742) | (0.0725) | (0.0718) | (0.0709) | (0.0727) | (0.0712) | (0.0702) | |
| Econ | 0.0941 | 0.0978 | 0.0870 | 0.0857 | 0.1243** | 0.0813 | 0.1204* | 0.1141* |
| (0.0625) | (0.0642) | (0.0620) | (0.0620) | (0.0611) | (0.0625) | (0.0617) | (0.0608) | |
| Innov | −0.0355** | −0.0335* | −0.0295* | −0.0293* | −0.0408** | −0.0311* | −0.0414** | −0.0381** |
| (0.0166) | (0.0174) | (0.0166) | (0.0161) | (0.0163) | (0.0168) | (0.0165) | (0.0162) | |
| Constant | 0.0853* | 0.0544 | 0.0814 | 0.0832* | 0.1051** | 0.0853* | 0.1065** | 0.1117** |
| (0.0516) | (0.0542) | (0.0509) | (0.0486) | (0.0491) | (0.0516) | (0.0496) | (0.0478) | |
| Region | Y | Y | Y | Y | Y | Y | Y | Y |
| Year | Y | Y | Y | Y | Y | Y | Y | Y |
| N | 450 | 450 | 450 | 450 | 450 | 450 | 450 | 450 |
| Wald χ2 | 97.29*** | 87.78*** | 103.85*** | 108.08*** | 123.72*** | 104.51*** | 123.15*** | 133.68*** |
Note(s): Standard errors are in parentheses. *p < 0.1, **p < 0.05, ***p < 0.01
In Scenarios (1) and (2), the linear terms of IA and CCS positively affect GTFP at the 1% and 10% levels. Scenario (3) includes both terms, and their effects remain, indicating no multicollinearity. Scenario (4) adds the IA–CCS interaction, which is insignificant, showing no linear interaction. Scenario (5) adds the IA squared term, which is significantly negative at 1%, implying a potential inverted U–shape that requires further validation. Scenario (6) adds the CCS squared term, but it is insignificant, suggesting no nonlinear CCS effect. Scenario (7) includes both squared terms, but their coefficients and significance change. Scenario (8) adds the IA2×CCS interaction, which is significantly positive at 5%, indicating that CCS moderates the IA–GTFP relationship.
4.2.2 The impact of industrial agglomeration on green total factor productivity
To test H1, this study adopts Haans et al. (2016)’s procedure for detecting U–shaped or inverted U–shaped relationships. Scenarios (5), (6), and (7) include four steps: (1) test the sign and significance of the squared term; (2) examine slope significance at the lower and upper bounds; (3) check whether the turning point falls within the observed range; and (4) test for higher-order nonlinear forms.
This study conducts the test by running the “utest” command in Stata. In Scenario 5, the coefficient of IA×IA is significantly negative (b = −0.2173, p < 1%). The slope at the upper bound is significantly positive (slope = 0.5461, p < 1%), and the slope at the lower bound is significantly negative (slope = −0.2696, p < 1%), with a turning point of 0.4332, which lies within the centered range of [−0.82, 1.05]. The overall inverted U–test yields a t–value of 2.45 (p < 1%). In Scenario 7, after including the CCS squared term, IA×IA remains significantly negative (b = −0.2110, p < 1%). The slopes at both bounds show the same sign pattern, and the turning point (0.4327) again lies within the valid range, with an inverted U–test t–value of 2.37 (p < 1%). Adding a cubic IA term yields an insignificant coefficient (b = −0.1049, p > 10%), excluding higher-order nonlinearity.
These results confirm an inverted U-shaped relationship between IA and GTFP, supporting H1. When IA is below approximately 0.433, increases in agglomeration improve GTFP. Beyond this threshold, further agglomeration reduces GTFP. Moderate agglomeration enhances knowledge spillovers, specialization, and scale economies, whereas excessive agglomeration leads to knowledge homogeneity, resource congestion, and rising costs, which reduce innovation efficiency (Zhang et al., 2019). Intense competition may also reduce R&D investment and induce “race-to-the-bottom” behavior. As clusters expand, policy implementation efficiency may decline and risks of regulatory capture increase, weakening green transformation efforts (Bredemeier et al., 2023).
These findings indicate that IA should be maintained within an optimal range. Under-agglomerated regions may adopt targeted incentives and infrastructure investment to attract firms; over-agglomerated regions should shift priorities toward industrial upgrading, technological innovation, and green construction to mitigate congestion externalities. The non-linearity observed here is consistent with the turning-point logic in Section 2.2: agglomeration generates green productivity gains up to a threshold, beyond which resource crowding and regulatory complexity impose net costs—a boundary that provincial governments can influence through targeted industrial policy.
4.2.3 The roles of construction consulting services in green total factor productivity
H2 is supported. In Table 2, CCS exhibits a significant positive linear effect on GTFP. (b = 0.2455, p < 5%), while the quadratic term is insignificant, indicating a purely linear promotion effect. CCS facilitates green building development by offering expert knowledge, technical support, and decision assistance. Examples include consulting evaluations by China International Engineering Consulting Corporation for Sinochem International and design services by China Railway Design Corporation for urban rail projects. The main effect relationships between IA, CCS, and GTFP (H1 and H2) are illustrated in Figure 3(a).
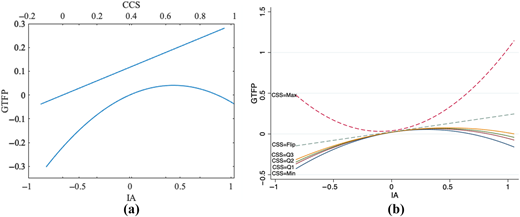
Main effects of IA and CCS on GTFP and the moderating effect of CCS. Source: Authors’ own work
Main effects of IA and CCS on GTFP and the moderating effect of CCS. Source: Authors’ own work
To test H3, Scenario (8) incorporates the quadratic IA term and linear CCS term. The non-linear statistic is 0.2362 (p = 0.248), suggesting CCS shifts the IA turning point slightly rightward, though insignificantly.
This study further examines whether CCS alters the curvature of the inverted U–shaped IA–GTFP relationship. In Scenario (8), the three-way interaction IA×IA×CCS is significantly positive (b = 1.1315, p < 5%), indicating that higher CCS flattens the curve. When CCS is low, the IA–GTFP curve shows a clear inverted U–shape; as CCS rises, the curve becomes flatter and may statistically appear as a positive U–shape. From Table 2, the coefficient ratio of IA×IA to IA×IA×CCS is about 1:5.2, implying CCS rapidly weakens IA’s non-linear effect. Moreover, Figure 3(b) reports IA’s marginal effects on GTFP at different CCS levels (Min, Q1, Q2, Q3), all significantly negative. As CCS increases, the marginal effect decreases. When CCS reaches the theoretical “shape–flip” value (−β2/β4), the curve reduces to a straight line, though insignificantly (dy/dx = 0.0000, p > 10%). Beyond this point (e.g. CCS = Max), a positive U–shape appears but lacks significance. Thus, statistically, CCS cannot reverse the inverted U–shaped IA–GTFP relationship.
Therefore, H3 is partially supported. CCS negatively moderates the inverted U–shaped relationship between IA and GTFP by flattening the curve without shifting the turning point, and it cannot reverse the overall pattern. This effect is evident in large integrated construction projects. For instance, the Shenzhen International Low-carbon City features strong agglomeration and extensive CCS activities, including design, supervision, and green certification. These services enhance industry efficiency and promote green technologies and sustainable construction practices. In summary, a well-developed CCS system improves energy and carbon efficiencies, and when combined with moderate IA, generates synergy that significantly increases GTFP.
4.3 Robustness
Table 3 presents six robustness checks. First, reverse causality is addressed via two-stage GMM IV estimation using lagged IA, CCS, and their interactions as instruments (M1); identification tests all meet statistical requirements. Second, a panel Tobit accounts for the censored GTFP distribution (M2). Third, Winsorization at 1% tails guards against outlier influence (M3). Fourth, MLE replaces the random-effects estimator (M4). Fifth and sixth, GTFP is reconstructed under CRS sequential technology (M5) and a radial directional distance function (M6). Across all specifications, CCS remains significantly positive, IA×IA significantly negative, and IA×IA×CCS significantly positive, confirming the robustness of the baseline findings.
Robustness test
| Method | M1: IV (two-stage GMM) | M2: Xttobit | M3: Winsor | ||||||
|---|---|---|---|---|---|---|---|---|---|
| Variable | GTFP | GTFP | GTFP | GTFP | GTFP | GTFP | GTFP | GTFP | GTFP |
| IA | 0.2411*** | 0.2858*** | 0.3377*** | 0.1200*** | 0.1897*** | 0.2222*** | 0.1224*** | 0.1931*** | 0.2245*** |
| (0.0319) | (0.0313) | (0.0343) | (0.0361) | (0.0393) | (0.0428) | (0.0371) | (0.0408) | (0.0437) | |
| CCS | 0.5246*** | 0.5493*** | 0.3353* | 0.2462** | 0.2999*** | 0.0185 | 0.2982** | 0.3554*** | 0.0212 |
| (0.1113) | (0.1068) | (0.1796) | (0.1069) | (0.1056) | (0.1629) | (0.1191) | (0.1179) | (0.1791) | |
| IA×IA | −0.3075*** | −0.3021*** | −0.2184*** | −0.2361*** | −0.2271*** | −0.2397*** | |||
| (0.0551) | (0.0556) | (0.0562) | (0.0584) | (0.0609) | (0.0634) | ||||
| IA×CCS | 0.8540** | −0.0597 | −0.1002 | ||||||
| (0.3713) | (0.3300) | (0.3489) | |||||||
| IA×IA×CCS | 2.0218*** | 1.1360** | 1.3139** | ||||||
| (0.6570) | (0.5613) | (0.6327) | |||||||
| Control | Y | Y | Y | Y | Y | Y | Y | Y | Y |
| Region | Y | Y | Y | Y | Y | Y | Y | Y | Y |
| Year | Y | Y | Y | Y | Y | Y | Y | Y | Y |
| Constant | Y | Y | Y | Y | Y | Y | Y | Y | Y |
| N | 420 | 420 | 420 | 450 | 450 | 450 | 450 | 450 | 450 |
| Method | M4: MLE | M5: DV metrics (CRS + SEQ) | M6: DV metrics (DDF) | ||||||
|---|---|---|---|---|---|---|---|---|---|
| Variable | GTFP | GTFP | GTFP | GTFP | GTFP | GTFP | GTFP | GTFP | GTFP |
| IA | 0.1200*** | 0.1897*** | 0.2222*** | 0.1191*** | 0.1882*** | 0.2217*** | 0.1677*** | 0.2235*** | 0.2533*** |
| (0.0361) | (0.0393) | (0.0428) | (0.0366) | (0.0401) | (0.0435) | (0.0291) | (0.0317) | (0.0347) | |
| CCS | 0.2462** | 0.2999*** | 0.0185 | 0.2455** | 0.2987*** | 0.0181 | 0.2319*** | 0.2698*** | 0.2183 |
| (0.1069) | (0.1056) | (0.1629) | (0.1100) | (0.1089) | (0.1682) | (0.0873) | (0.0862) | (0.1337) | |
| IA × IA | −0.2184*** | −0.2361*** | −0.2173*** | −0.2359*** | −0.1803*** | −0.1621*** | |||
| (0.0562) | (0.0584) | (0.0577) | (0.0602) | (0.0457) | (0.0479) | ||||
| IA × CCS | −0.0597 | −0.0623 | 0.4592* | ||||||
| (0.3300) | (0.3380) | (0.2684) | |||||||
| IA × IA × CCS | 1.1360** | 1.1315** | 0.9225** | ||||||
| (0.5613) | (0.5751) | (0.4568) | |||||||
| Control | Y | Y | Y | Y | Y | Y | Y | Y | Y |
| Region | Y | Y | Y | Y | Y | Y | Y | Y | Y |
| Year | Y | Y | Y | Y | Y | Y | Y | Y | Y |
| Constant | Y | Y | Y | Y | Y | Y | Y | Y | Y |
| N | 450 | 450 | 450 | 450 | 450 | 450 | 450 | 450 | 450 |
Taken together, the findings reported in Sections 4.1–4.3 provide a coherent and robust account of the joint effects of IA and CCS on construction-sector GTFP. H1 is supported. The squared term of IA exhibits a statistically significant negative coefficient (β = −0.2173, p < 0.01), and the presence of an inverted U-shaped relationship is corroborated by slope tests at both the lower and upper bounds of the IA distribution. The estimated turning point (0.4332, in centred units) lies well within the observed data range. This non-linear specification is not driven by model misspecification, as the inclusion of a cubic term yields an insignificant coefficient, and the observed pattern remains stable across alternative model specifications in Scenarios (5) and (7). Moreover, H2 is also supported. CCS demonstrates a statistically significant positive linear effect on GTFP (β = 0.2455, p < 0.05), while the quadratic term of CCS remains consistently insignificant. This suggests that the productivity-enhancing effect of consulting services follows a monotonic pattern, rather than exhibiting diminishing marginal returns. Finally, H3 receives partial support. Although CCS does not significantly shift the turning point of the inverted U-shaped IA–GTFP relationship (∂IA*/∂CCS = 0.2362, p = 0.248), it exerts a moderating influence on the curvature. Specifically, the three-way interaction term (IA2 × CCS) is positive and statistically significant (β = 1.1315, p < 0.05), indicating that higher levels of CCS attenuate the curvature of the relationship, effectively flattening the IA–GTFP curve without altering its overall inverted U-shape. In summary, these findings remain robust across six alternative specifications, including IV-GMM, Tobit, Winsorization, MLE, CRS sequential technology, and the DDF approach. This consistency provides strong evidence that the results are not driven by endogeneity, censoring, outliers, or measurement-related issues.
5. Discussions
5.1 Efficiency component analysis: empirical results
While Section 4 demonstrates that IA and CCS jointly influence GTFP in line with the proposed hypotheses, the aggregate nature of the GTFP index precludes identification of the specific channels through which these effects operate. As a composite indicator, GTFP encapsulates capital utilisation, labour productivity, energy efficiency, and carbon performance within a single scalar measure. Although analytically tractable, such aggregation obscures the underlying mechanisms driving the observed relationships. To address this limitation, the present section disaggregates GTFP by sequentially substituting each of its four component indicators—KE, LE, EE, and CE—as the dependent variable. This approach enables a more granular examination of the factor-specific responsiveness to IA and CCS. It provides an ex post empirical test of the mechanism-based efficiency predictions articulated in Section 2.3. Particularly, it assesses whether the effects of IA are primarily concentrated in LE, consistent with a knowledge diffusion mechanism, and whether the effects of CCS are more pronounced in EE and CE, reflecting improved resource allocation and policy transmission.
For capital efficiency (KE, Figure 4(a)), IA×IA is significantly negative (b = −0.3840, p < 1%), confirming an inverted U–shaped relationship, while CCS is positive but not significant. Moderate agglomeration improves KE via economies of scale, but excessive clustering causes congestion and resource competition (Hou et al., 2022; Hu and Li, 2024). That CCS exerts no significant influence on KE—despite its theoretical role in competitive ordering—suggests standardization effects operate slowly in capital-intensive domains where incumbent investment commitments constrain asset reallocation.
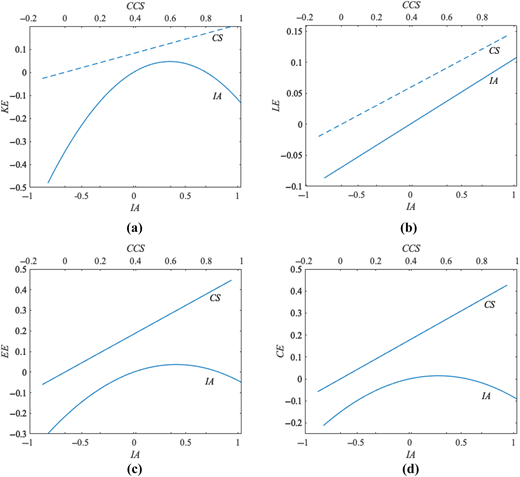
Relationship between IA, CCS, and Various Factor Efficiencies. Source: Authors’ own work
Relationship between IA, CCS, and Various Factor Efficiencies. Source: Authors’ own work
For labor efficiency (LE, Figure 4(b)), IA has a significant positive main effect (b = 0.1052, p < 1%), with IA×IA insignificant, indicating LE benefits monotonically from specialization, knowledge spillovers, and technological innovation. CCS shows no significant effect (b = 0.1521, p > 10%). This suggests that CCS-mediated knowledge transfer operates more indirectly than the human capital spillovers generated by labor mobility within agglomerated clusters, and labor productivity benefits of clustering appear less contingent on professional service intermediation than on simple co-location.
Energy efficiency (EE) and carbon emission efficiency (CE), in Figure 4(c)–(d)), show similar inverted U–shaped patterns with IA (EE: b = −0.2209, p < 1%; CE: b = −0.1868, p < 5%), with U–tests rejecting the null at 5%. Agglomeration improves EE and CE by facilitating resource sharing, specialization, and technological innovation. Excessive agglomeration can cause congestion, energy shortages, and inefficiencies, reducing EE and increasing emissions. CCS significantly boosts EE (b = 0.4735, p < 1%) and CE (b = 0.4529, p < 1%), slightly stronger for EE. CCS enhance efficiency by ensuring energy compliance, optimizing construction, and applying energy-saving designs and low-carbon technologies (Iqbal et al., 2021). This indicates that integrating CCS into early-stage project design and on-site supervision can effectively translate agglomeration advantages into measurable energy and carbon efficiency gains. The strong effects of CCS on EE and CE, alongside the null results for KE and LE, suggest that the productivity value of CCS is realized primarily at the energy-environment interface, which is consistent with the resource allocation and policy transmission mechanisms theorized in Section 2.3, where the CCS influence was predicted to be most visible precisely in these dimensions.
5.2 Heterogeneity analysis: environmental regulation effects
The construction sector, as a major consumer of energy and emitter of carbon, is significantly influenced by environmental regulation (Ambec et al., 2013). Building on the Porter Hypothesis (Porter and Linde, 1995), this section examines how IA and CCS influence GTFP across the four regulatory regimes constructed in Section 3.6 (High/Low FER × High/Low IER).
Figure 5(a) presents the moderating effects of CCS on GTFP. The high FER–high IER group exhibits the strongest impact, followed by the low FER–high IER, high FER–low IER, and low FER–low IER groups. Overall, CCS contribute more significantly to GTFP under stronger regulatory environments, with informal regulation demonstrating greater marginal effects than formal regulation. For firms operating in highly regulated regions, engaging professional consulting services becomes a strategic mechanism for transforming regulatory pressure into competitive advantage at both the enterprise and project levels.
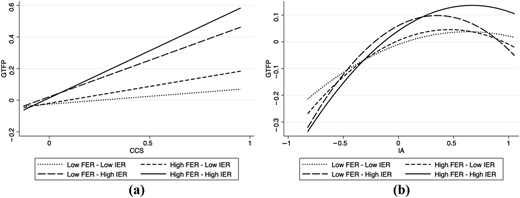
Impact of IA, CCS on GTFP under Different Environmental Regulation Levels. Source: Authors’ own work
Impact of IA, CCS on GTFP under Different Environmental Regulation Levels. Source: Authors’ own work
Figure 5(b) shows that the IA–GTFP curve is flatter under low dual regulation, while the high FER–high IER group exhibits a higher turning-point GTFP, indicating GTFP is most sensitive under strong informal regulation. Formal regulation alone cannot sustain improvement; informal regulation, driven by public awareness, generates stronger long-term effects. Where formal regulation is strong but informal oversight is weak, CCS plays a transactional compliance role; where informal regulation is active, CCS serves a broader legitimacy function, signaling green commitment to communities and civil society actors. Policymakers in high-IER provinces may therefore generate additional productivity returns by integrating CCS into public disclosure frameworks rather than limiting it to compliance-oriented consulting.
6. Conclusions and recommendations
Three principal findings are derived from this study. First, the relationship between IA and GTFP in China’s construction sector exhibits a pronounced non-linear pattern. Specifically, spatial concentration enhances green productivity up to a critical threshold, beyond which the adverse effects of congestion and competitive distortion outweigh the benefits of clustering. This inverted-U dynamic carries important implications for the design and temporal calibration of agglomeration policies. Second, CCS exert a dual influence on this relationship. On the one hand, they directly promote GTFP by enhancing resource coordination and strengthening compliance with regulatory requirements throughout the project lifecycle. On the other hand, they moderate the non-linear IA–GTFP relationship by attenuating its curvature, thereby mitigating the productivity losses associated with excessive agglomeration. Third, the effects of CCS are most prominently manifested through improvements in EE and CE, rather than through conventional capital or labour productivity gains. This finding highlights the distinctive contribution of knowledge-intensive services in facilitating environmentally oriented productivity improvements within a sector facing increasing regulatory and sustainability pressures. The importance of such services is further amplified in contexts where formal environmental regulations are complemented by informal mechanisms of public oversight.
This study makes three contributions. First, it integrates IA, CCS, and GTFP into a unified analytical framework, providing empirical evidence of an inverted U-shaped IA–GTFP relationship that extends agglomeration theory to the service-intensive, project-based construction sector. Second, it identifies CCS as a structural moderator of the IA–GTFP relationship, conceptualizing professional consulting services as an endogenous institutional capacity that reshapes the productivity outcomes of spatial clustering. Third, by decomposing GTFP into factor-level efficiency channels and distinguishing FER from IER, the study reveals the mechanisms and institutional conditions under which agglomeration generates green productivity. The efficiency decomposition approach also demonstrates a broadly applicable strategy for unpacking mechanism heterogeneity in agglomeration–productivity research.
Although the evidence is drawn from China, the findings carry transferable implications. The inverted U-shaped IA–GTFP relationship is grounded in universal agglomeration economics and likely applies to construction industries in rapidly urbanizing emerging economies—India, Vietnam, and Brazil—where clustering dynamics and environmental pressures follow comparable trajectories (Qin et al., 2024; Wang et al., 2024). Countries with underdeveloped consulting infrastructures should prioritize strengthening professional service capacity, while the stronger marginal influence of informal relative to formal regulation suggests that public environmental awareness and third-party oversight can effectively complement statutory frameworks across diverse institutional contexts (Bai et al., 2024).
Several limitations should be acknowledged. First, the reliance on inter-provincial panel data may mask heterogeneity at the firm or project level; micro-level datasets and cross-country comparisons would test the generalizability of the IA–CCS–GTFP framework. Second, the CCS measure captures the density of knowledge-intensive service labor but does not differentiate by type or quality; more granular proxies—certified green building consultant ratios or BIM adoption intensity—could yield finer-grained insights. Third, the analysis treats the regulatory and industrial environment as structurally stable; structural break tests or time-varying parameter models may better capture how the IA–CCS–GTFP relationship has evolved under major policy shifts such as China’s dual-carbon commitment. Future research could also evaluate the effectiveness of specific policy instruments—green consulting incentives, service integration mechanisms, or public environmental participation programs—and explore the differentiated roles of CCS types across regions.
Appendix 1
Abbreviations list
| Abbreviation | Full term | Brief description |
|---|---|---|
| CCS | Construction Consulting Services | Knowledge-intensive services providing specialized |
| DEA | Data Envelopment Analysis | A non-parametric method used to evaluate the relative efficiency of decision-making units (DMUs) |
| DMUs | Decision-Making Units | The organizational or regional units (e.g. provinces) whose efficiency is being evaluated in the study |
| ER | Environmental Regulation | Policy instruments and standards implemented to mitigate pollution and promote sustainable industrial practices |
| GTFP | Green Total Factor Productivity | A productivity measure that accounts for environmental constraints by incorporating energy input and undesirable outputs. |
| IA | Industrial Agglomeration | The spatial concentration of construction enterprises and related activities within a specific region |
| SBM | Slacks-Based Measure | A non-radial DEA model used to measure efficiency while accounting for input and output slacks |
| TFP | Total Factor Productivity | Conventional measure of output growth not accounted for by traditional inputs (capital/labor), excluding environmental factors |
Appendix 2 Specific operationalization of SBM–DEA model
In the context of the Chinese construction industry, three inputs are specified: capital (), labor (), and energy (). Capital is proxied by net fixed assets, deflated to constant 2000 prices using the fixed-asset investment price index. Labor is measured as total year-end employment in the construction sector. Energy input is quantified as total energy consumption, converted into standard coal equivalents based on data from the China Energy Statistical Yearbook. The production process yields one desirable output and one undesirable output. The desirable output is real value added (), deflated using the construction output price index (2008 = 100). The undesirable output is carbon dioxide emissions (), obtained from the China Emission Accounts and Datasets (CEADs). These emissions are estimated using the apparent energy consumption approach, covering 17 categories of fossil fuels as well as emissions from cement production (Shan et al., 2016; Xu et al., 2024). Under these specifications, the global SBM–DEA model with variable returns to scale (VRS) is formulated as follows:
subject to:
In this formulation, denotes the GTFP score for each DMU. The variables , , and represent the input slack values associated with capital, labor, and energy, respectively. The term captures the shortfall in desirable output (value added), while denotes the excess in undesirable output ( emissions). The vector represents the intensity weights used to construct the reference frontier. A value of indicates that all slack variables are equal to zero, implying that the DMU operates on the efficient frontier with no input redundancy, no output shortfall, and no excess undesirable output. In contrast, suggests that inefficiencies exist in at least one dimension, indicating potential for GTFP improvement. A general formulation of the SBM–DEA model, expressed in standard notation, is presented in Section 3.3.

