1-20 of 20358
Keywords: ORDIT
Close
Follow your search
Access your saved searches in your account
Would you like to receive an alert when new items match your search?
Journal

Seeks to advance integrated design and construction practices project lifecycle management and sustainable construction.
Journal Articles
Challenges and opportunities in international joint ventures between architecture/engineering consultants: the case study of Kuwait
Available to Purchase
Engineering, Construction and Architectural Management 1–21.
Published: 15 June 2026
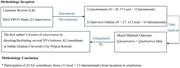
Research methodology diagram. Source: Authors' own work
Available to Purchase
in Challenges and opportunities in international joint ventures between architecture/engineering consultants: the case study of Kuwait
> Engineering, Construction and Architectural Management
Published: 15 June 2026
Figure 1 Research methodology diagram. Source: Authors' own work More about this image found in Research methodology diagram. Source: Authors' own work
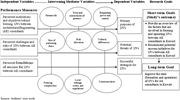
Research variables framework. Source: Authors' own work
Available to Purchase
in Challenges and opportunities in international joint ventures between architecture/engineering consultants: the case study of Kuwait
> Engineering, Construction and Architectural Management
Published: 15 June 2026
Figure 2 Research variables framework. Source: Authors' own work More about this image found in Research variables framework. Source: Authors' own work
Journal Articles
Risk identification and prioritization of railway construction project under complex terrain
Available to Purchase
Engineering, Construction and Architectural Management 1–27.
Published: 15 June 2026
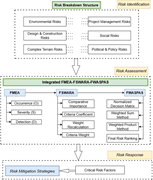
Research framework. Source(s) : Authors’ own work A flowchart illustrat...
Available to Purchase
in Risk identification and prioritization of railway construction project under complex terrain
> Engineering, Construction and Architectural Management
Published: 15 June 2026
Figure 1 Research framework. Source(s) : Authors’ own work A flowchart illustrating a research framework for risk assessment and management. A flowchart illustrating a research framework for risk assessment and management. The flowchart is divided into three main sections: Risk Identification... More about this image found in Research framework. Source(s) : Authors’ own work A flowchart illustrat...
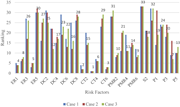
Sensitivity analysis. Source(s) : Authors’ own work A bar graph showing...
Available to Purchase
in Risk identification and prioritization of railway construction project under complex terrain
> Engineering, Construction and Architectural Management
Published: 15 June 2026
Figure 2 Sensitivity analysis. Source(s) : Authors’ own work A bar graph showing sensitivity analysis of risk factors for three cases. More about this image found in Sensitivity analysis. Source(s) : Authors’ own work A bar graph showing...
Journal Articles
Data-driven analysis of key factors in building fire risk
Available to Purchase
Engineering, Construction and Architectural Management 1–29.
Published: 15 June 2026
Methodology. Source(s): Authors’ own work A flowchart illustrating the...
Available to Purchase
in Data-driven analysis of key factors in building fire risk
> Engineering, Construction and Architectural Management
Published: 15 June 2026
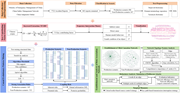
Figure 1 Methodology. Source(s): Authors’ own work A flowchart illustrating the methodology for analyzing risk factors in accident reports. A flowchart illustrating the methodology for analyzing risk factors in accident reports. The flowchart is divided into several sections: Data Collection... More about this image found in Methodology. Source(s): Authors’ own work A flowchart illustrating the...
Fire cause word cloud. Source(s): Authors’ own work A word cloud highl...
Available to Purchase
in Data-driven analysis of key factors in building fire risk
> Engineering, Construction and Architectural Management
Published: 15 June 2026
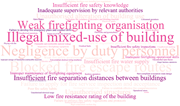
Figure 2 Fire cause word cloud. Source(s): Authors’ own work A word cloud highlighting various causes of fires. A word cloud in pink and purple text highlighting various causes of fires, including weak firefighting organization, illegal mixed-use of buildings, negligence by duty personnel, b... More about this image found in Fire cause word cloud. Source(s): Authors’ own work A word cloud highl...
Parameter sensitivity analysis and threshold determination for association ...
Available to Purchase
in Data-driven analysis of key factors in building fire risk
> Engineering, Construction and Architectural Management
Published: 15 June 2026
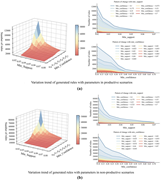
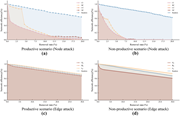
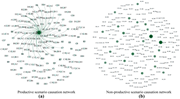
Figure 3 Parameter sensitivity analysis and threshold determination for association rule mining. Source(s): Authors’ own work Graphs showing variation trends of generated rules with parameters in productive and non-productive scenarios. The image contains two sets of graphs. The first set, l... More about this image found in Parameter sensitivity analysis and threshold determination for association ...
Ranking of nodes by comprehensive importance in fire accident risk associat...
Available to Purchase
in Data-driven analysis of key factors in building fire risk
> Engineering, Construction and Architectural Management
Published: 15 June 2026
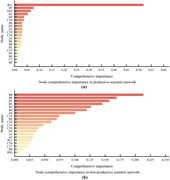
Figure 4 Ranking of nodes by comprehensive importance in fire accident risk association networks across different scenarios (top 20). Source(s): Authors’ own work Two bar graphs showing the ranking of nodes by comprehensive importance in fire accident risk association networks across differen... More about this image found in Ranking of nodes by comprehensive importance in fire accident risk associat...
Network efficiency degradation under sequential node and edge attack strate...
Available to Purchase
in Data-driven analysis of key factors in building fire risk
> Engineering, Construction and Architectural Management
Published: 15 June 2026
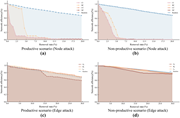
Figure 5 Network efficiency degradation under sequential node and edge attack strategies. Source(s): Authors’ own work Four line graphs showing network efficiency degradation under different attack strategies. The image contains four line graphs. The first graph shows network efficiency degr... More about this image found in Network efficiency degradation under sequential node and edge attack strate...
Largest connected component degradation under sequential node and edge atta...
Available to Purchase
in Data-driven analysis of key factors in building fire risk
> Engineering, Construction and Architectural Management
Published: 15 June 2026
Figure 6 Largest connected component degradation under sequential node and edge attack strategies. Source(s): Authors’ own work Four line graphs depict network efficiency under different attack strategies in productive and non-productive scenarios. The image contains four line graphs analyzi... More about this image found in Largest connected component degradation under sequential node and edge atta...
Topological mapping of building fire risk evolutionary patterns across diff...
Available to Purchase
in Data-driven analysis of key factors in building fire risk
> Engineering, Construction and Architectural Management
Published: 15 June 2026
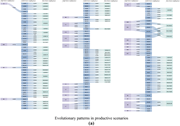
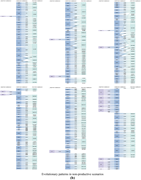
Figure 7 Topological mapping of building fire risk evolutionary patterns across different scenarios. Source(s): Authors’ own work A table showing topological mapping of building fire risk evolutionary patterns across different scenarios. The table presents a topological mapping of building f... More about this image found in Topological mapping of building fire risk evolutionary patterns across diff...
Topological mapping of building fire risk evolutionary patterns across diff...
Available to Purchase
in Data-driven analysis of key factors in building fire risk
> Engineering, Construction and Architectural Management
Published: 15 June 2026
Figure 7 Topological mapping of building fire risk evolutionary patterns across different scenarios. Source(s): Authors’ own work A table showing topological mapping of building fire risk evolutionary patterns across different scenarios. The table presents a topological mapping of building f... More about this image found in Topological mapping of building fire risk evolutionary patterns across diff...
Comparison of the global topological structures of building fire risk assoc...
Available to Purchase
in Data-driven analysis of key factors in building fire risk
> Engineering, Construction and Architectural Management
Published: 15 June 2026
Figure 8 Comparison of the global topological structures of building fire risk association networks. Source(s): Authors’ own work A diagram comparing two fire risk association networks. The diagram compares the global topological structures of two building fire risk association networks. On ... More about this image found in Comparison of the global topological structures of building fire risk assoc...
Journal Articles
Governing cross-regional collaborative innovation in construction: evolutionary game insights from complex adaptive systems
Available to Purchase
Engineering, Construction and Architectural Management 1–27.
Published: 12 June 2026
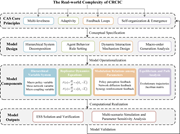
Model development framework based on CAS theory. Source(s): Authors’ own ...
Available to Purchase
in Governing cross-regional collaborative innovation in construction: evolutionary game insights from complex adaptive systems
> Engineering, Construction and Architectural Management
Published: 12 June 2026
Figure 1 Model development framework based on CAS theory. Source(s): Authors’ own work More about this image found in Model development framework based on CAS theory. Source(s): Authors’ own ...
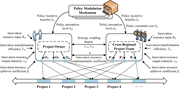
Interaction relationships of game players. Source(s): Authors’ own work
Available to Purchase
in Governing cross-regional collaborative innovation in construction: evolutionary game insights from complex adaptive systems
> Engineering, Construction and Architectural Management
Published: 12 June 2026
Figure 2 Interaction relationships of game players. Source(s): Authors’ own work More about this image found in Interaction relationships of game players. Source(s): Authors’ own work
