In this paper, the authors show that ecological restoration potential through natural regeneration of degraded tropical rainforest is possible. This is significant because at present most of the tropical forest of the world, including of Bangladesh, are degraded.
Regeneration status of Chunati Wildlife Sanctuary (CWS) was assessed through stratified random sampling method using sample plots of 5 × 5 m in size covering 269 sample plots.
A total of 3,256 regenerating seedlings/saplings of 105 species belonging to 35 families were recorded from CWS. From regenerating tree species, maximum (37.83) family importance value (FIV) index was found for Euphorbiaceae followed by Myrtaceae (18.03). Maximum importance value index (IVI) was found for Aporosa wallichii (21.62) followed by Grewia nervosa (16.41). Distribution of seedlings into different height classes of regenerating tree species was also calculated.
Forest scientists are working to find out the best nature-based solution for ecological restoration of tropical rainforests to attain climate resilient ecosystem in a sustainable way. Tropical rain forest has huge plant diversity, and we find that ecological restoration is possible through natural regeneration from its rich soil seed bank. Natural regeneration is the best nature-based solution for sustainable management of the forest.
The authors believe that the findings presented in our paper will appeal to the forest and environmental scientists. The findings will allow readers to understand degraded tropical hill forest ecosystem and its management strategy.
The authors believe that this manuscript will give a clear picture about degraded tropical hill forest ecosystem and its genetic composition, diversity and soil seed bank status to apply appropriate management strategy.
Introduction
Natural regeneration is essential for preservation and maintenance of biodiversity in natural forests (Hossain et al., 2004; Rahman et al., 2011). Knowledge about the pattern of natural regeneration is important to answer the basic question of forest management (Hossain et al., 1999). It is an important indicator to assess overall condition of forest ecosystem (Rahman et al., 2011). Wyatt-Smith (1987) mentioned information on species composition of a forest is essential for its wise management in terms of economic value and natural regeneration potential. Plants maintain and expand their populations in time and space by the process of regeneration. Regeneration is a complex ecosystem process involving asexual and sexual reproduction, dispersal and establishment in relation to environmental factors (Barnes et al., 1998). The strategies by which plants regenerate are soil seed banks, seedling banks and vegetative parts (Grime, 1979; Garwood, 1989; Barnes et al., 1998). The pattern of population structure of woody plants can show the regeneration profile, which is used to determine their regeneration status (Bekele, 2000; Teketay, 1996). Assessment of soil seed banks and population structure has practical importance in forest conservation and management. Database of the regeneration status of the plant species is important for developing management strategies and setting priorities for the wise management of the wildlife sanctuary.
The Chunati Wildlife Sanctuary (CWS), formerly a part of the Reserve Forests of Chittagong Forest Division, was designated a Protected Area on March 8, 1986. Primary objectives to establish a wildlife sanctuary are to dedicate an area as undisturbed breeding ground primarily for the protection of wildlife inclusive of all natural resources such as vegetation, soil and water. Basic information of the sanctuary is essential to achieve the objectives of the wildlife sanctuary establishment. This natural forest is important not only as renewable resources but also as an essential in the conservation of wildlife and environment. Khan (1990) and Khan and Huq (2001) prepared annotated checklist for flora of the CWS. Rahman and Hossain (2003) assessed fodder and non-fodder plant species of the CWS. Regeneration study is still absent. Again, biodiversity monitoring and evaluation is essential for taking effective conservation measures.
Therefore, natural regeneration status of tree species was assessed to identify a sustainable management strategy for the purposes of ecological restoration and biodiversity conservation in CWS.
Materials and methods
Study site
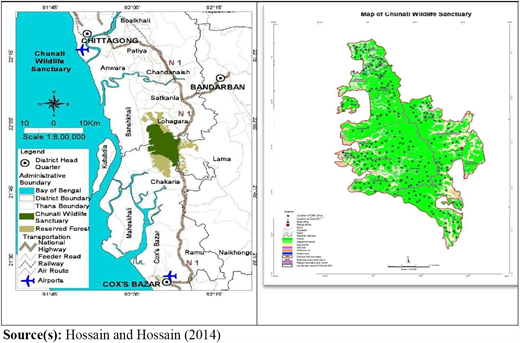
The CWS is located about 70 km south of Chattogram city and to the west of the Chattogram–Cox's Bazar highway at 21°48´N to 22°05´ latitude and 91°57´E to 92°07 east longitude (Figure 1). Chunati forest is composed of hills and hillocks with shallow to deep gullies and gentle to steep slopes. The soils on the alluvial plains and valleys in the Chunati are mainly silty to clay loam. The annual rainfall of the area is 2,000–2,500 mm (BBS, 2012). Temperature ranges from 24° (average minimum) to 32.5° during monsoon and from 14.2° to 29.5° during winter season. Humidity in the sanctuary is classified into three climatic seasons. Low relative humidity occurs during spring season and ranges from 28.6% to 98.2% (BBS, 2012).
Methods of the field study
To have an idea of the topography, vegetation composition, accessibility of the whole study area prior to selection of sampling procedure, field visits as well as formal discussion with respective Forest Department staff of CWS. Stratified random sample method was used for the study. A total of 269 sample plots (5 m × 5 m) were laid within the study area for the assessment of regeneration. Regenerated trees having <5 cm diameter at breast height (DBH) were considered as seedlings (Figure 1). Seedlings of all species in each plot were identified and recorded by local and scientific names. The common tree species were identified directly in the field, while the suitable samples of the unknown tree species were collected for the preparation of herbarium specimens.
Collected plant specimens were dried in the sun following standard scientific method. Identification of unknown specimen was done through verification with published journals and reference books (e.g. Prain, 1903; Uddin and Hassan, 2012; Rahman and Hossain, 2003) and Encyclopedia of Flora and Fauna of Bangladesh (Ahmed, 2008).
Analysis of collected field data
Identified plant samples were arranged taxonomically and categorized according to their habit form. The relative density, relative frequency, relative abundance and important value index (IVI) were calculated following Shukla and Chandel (2000). IVI of regeneration was calculated following Shukla and Chandel (2000) (Table 1).
Seven diversity and richness indices were analyzed following Kent and Coker (1992), Margalef (1958), Michael (1990), Odum (1971), Pielou (1966), Shannon and Wiener (1963) and Simpson (1949), to get a picture of regeneration status of different tree species in CWS (Table 2). Family relative density (Fd) and family relative diversity (Fr) were calculated following Rahman et al. (2011) (Table 1). Species diversity index (SDi) starts from 1 when there is only one individuals of one species, the value reach to maximum with the increase of species number (Odum, 1971).
Margalef's index (R) is high in communities that include a greater number of species and in which the number of individuals of each species decreases relatively slowly on passing from more abundant to less abundant ones (Margalef, 1958).
Shannon-Wiener diversity index value is maximum when the number of individuals of all species is equal; value is zero if there is only one species (Shannon and Wiener, 1963).
With Simpson's diversity index (D), 0 represents infinite diversity, and 1 represents no diversity. Simpson's diversity index is neither intuitive nor logical, so to get over the problem, d is often subtracted from 1 to give dominance of Simpson's index (D'). The value of this index also ranges between 0 and almost 1, but now, the greater the value, the greater the sample diversity.
Species evenness index (E), also known as Shannon's equitable index, assumes a value between 0 and 1, with 1 being complete evenness (Pielou, 1966).
Results and discussion
Natural regeneration status in Chunati Wildlife Sanctuary (CWS)
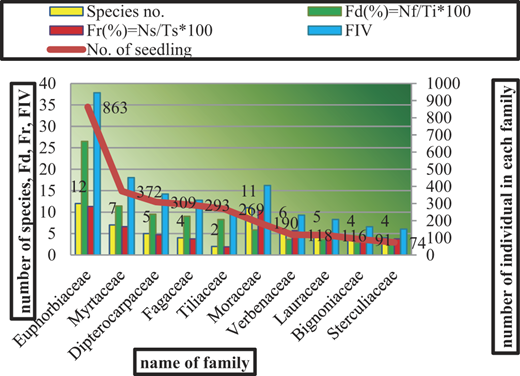
A total of 3,256 seedlings (4,842 seedling ha-1) of 105 species representing 35 families were recorded from CWS (Table 3). About 34% (12) families were represented by only one species and 45% (16) by more than two species. Maximum (12 species) was found for Euphorbiaceae family followed by Moraceae (11), Myrtaceae (7) family (Figure 2). Highest (26.50%) family relative density (Fd) was represented by Euphorbiaceae family followed by Myrtaceae (11.43%) family (Figure 2). Family relative diversity index (Fr) was also found maximum (11.32%) for Euphorbiaceae family followed by Moraceae (10.38%) family. Maximum (37.83) family importance value (FIV) index was found for Euphorbiaceae followed by Myrtaceae (18.03), Moraceae (16.21), Dipterocarpaceae (14.21) and Fagaceae (12.77) (Table 3).
Quantitative characters of naturally regenerating tree species of Chunati Wildlife Sanctuary
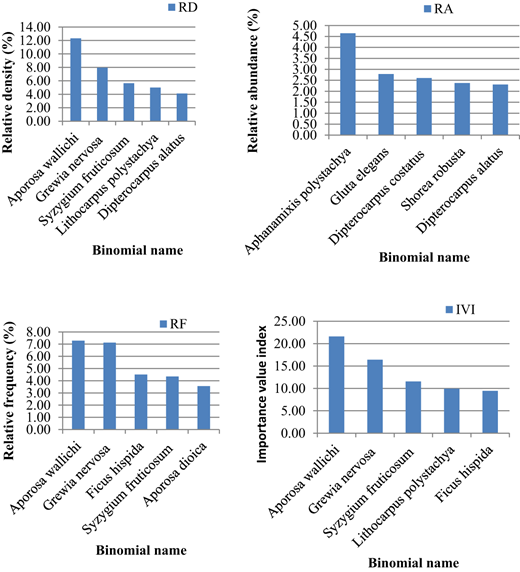
The quantitative structure of naturally regenerating tree species in the CWS was studied on the basis of conservation status, density, relative density, relative frequency, relative abundance and IVI. The highest number of seedlings per hectare was accounted for Aporosa wallichii (596) followed by Grewia nervosa (385), Syzygium fruticosum (274), Lithocarpus polystachia (242) and Dipterocarpus alatus (199) (Table 4). Lowest number of seedlings per hectare was (3), Albizia odoratissima (4) (Table 4). Maximum relative density (12.32%) recorded for Cassia fistula (1), Chukrasia tabularis (1) followed by Bhesa robusta (3), Eurya acuminata was recorded for A. wallichi followed by G. nervosa (7.96%), S. fruticosum (5.66%), L. polystachia (5%), D. alatus (4.11%) (Figure 3). Maximum relative frequency (7.28%) was recorded for A. wallichi followed by G. nervosa (7.12%), Ficus hispida (4.50%) and S. fruticosum (4.35%). The highest (4.64%) relative abundance was calculated for Aphanamixis polystachya followed by Gluta elegans (2.79%), Dipterocarpus costatus (2.60%), Shorea robusta (2.38%) and D. alatus (2.30%). The maximum IVI was found for A. wallichi (21.62) followed by G. nervosa (16.41), S. fruticosum (11.56), Lithocarpus polystachya (9.9), F. hispida (9.45) and D. alatus (8.56) (Table 4).
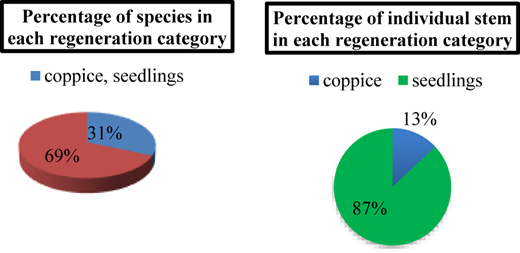
It has been found that regeneration of tree species is originated either from soil seed banks or from the coppices. The study shows that 13% (423 individuals) of the regeneration is coppice origin and the rest 87% (2,823 individuals) regeneration is seed origin (Figure 4). Again, it has been found that 33 species (31%) were both coppice and seed originated and 72 species (69%) were seed originated regeneration (Figure 4). The study reveals that both L. polystachya and Lithocarpus elegans has maximum (11) Shoot-growing capabilities followed by Quercus gomeziana (10) and D. alatus (9) (Table 5). Regeneration potential of 8 keystone tree species has been analyzed (Table 5) on the basis of their individual number and coppicing capability. G. nervosa showed maximum (35 stem ha-1out of 259 stem ha-1) regeneration from coppice followed by L. polystachya (45 stem ha-1out of 163 stem ha-1) and D. alatus (20 stem ha-1out of 134 stem ha-1) (Table 5).
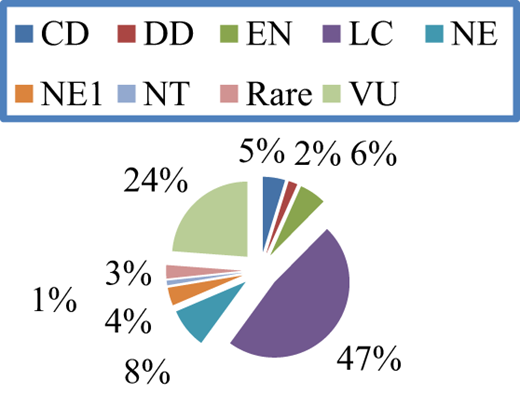
In addition, all the recorded plants/tree species were found to be represented by seven conservation categories, namely, conservation-dependent (CD), data-deficient (DD), endangered (EN), least concern (LC), not evaluated (NE), not evaluated but seems to be rare (NE1), not threatened (NT) and endangered (EN).
A total of 47% plant species (50 species out of 105) were found as LC which represents maximum plant species among all the categories (Figure 5).
Distribution of seedlings into different height classes
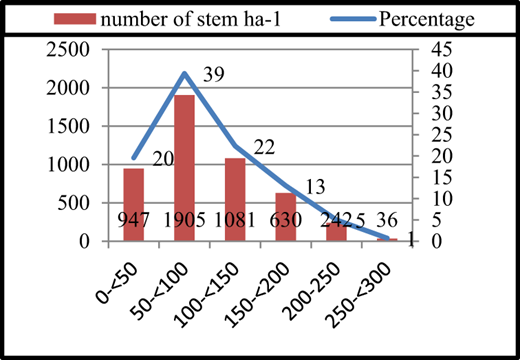
The percentage (%) distribution of all the seedlings of all species into six height (cm) classes is shown in (Figure 6). It was found that maximum (39%) seedlings were within a height range of 50 to <100 cm, whereas 1% seedlings were found only in 250 to <300 cm height range (Figure 6). It indicates disturbance in early stage of regeneration. It may be due to environmental and anthropogenic factors.
Biological diversity indices of regeneration species
Functional diversity is the structural heterogeneity and for variation in the special arrangements of the tree population (Huston, 1994). As per environmental heterogeneity hypothesis, increased heterogeneity should increase diversity (Levin, 1974). Different biological diversity indices, that is, species diversity index (SDi), species richness index (R), Shannon–Winner index (H), Shannon's maximum diversity index (Hmax), species evenness index (E), Simpson index (D) and dominance of Simpson index (D') were studied for Chunati Wildlife Sanctuary to depict natural regeneration status of recorded tree species (Table 6).
Discussions
Information on regeneration helps to conserve plant species diversity of a forest (Verma et al., 1999). It is an important and reliable tool for evaluating overall condition of forest ecosystem (Rahman et al., 2011). In CWS, the number of naturally regenerating species (105) and family (35) was higher than that of similar natural forests of Bangladesh. Rahman et al. (2019) enumerated 56 naturally regenerating species from Durgapur hill forest. Hossain et al. (2004) reported 64 naturally regenerating tree species from natural forests of Chittagong (South) Forest Division. Motaleb and Hossain (2007) recorded 29 regenerating tree species under 16 families from a semi-evergreen forest of Chittagong (South) Forest Division. Rahman et al. (2011) reported 55 regenerating tree species from Khadimnagar National Park and Tilagar Eco Park. However, the present study found that the number of regenerating tree species in initial stage (0–<50 cm) is lower than second stage (50–<100), similar to Misbahuzzaman and Alam’s (2006) reported highest (617) seedlings in height class 1 to <2 m, followed by 529 seedlings in height class 0 to <1 m from natural forest of Sitakunda, Chittagong. It may be due to field data collection after 4 months of regeneration or high rate of mortality of seedling in dry soil condition or human disturbances. Moraceae, Mimosaceae, Verbenaceae, Dipterocarpceae and Fagaceae were found as dominant families probably because of higher regeneration potential and the seed dispersal capability of their species and favorable conditions for regenerating in CWS.
A. wallichi, G. nervosa, S. fruticosum, L. polystachya and D. alatus were found as dominant regeneration species because of their profuse seed production.
The diversity indices of the present study indicates better generation in CWS in comparison to species diversity index (0.01), species richness index (4.92), Shannon–Winner index (3.62), Shannon's maximum diversity index (3.69), species evenness index (2.26), Simpson index (0.03) and dominance of Simpson index (0.97) reported by Rahman et al. (2011) from biodiversity conservation areas of Northeastern Bangladesh.
Conclusion
The present investigation provides authentic information on natural regeneration status of CWS. Values of diversity indices indicate rich plant species diversity and existence of complex ecosystem functions in the Sanctuary. The IVI values reveal ecologically the most important tree species in the forest and those to be prioritized for conservation. The height class distribution and coppice regeneration indicate occurrences of illegal removal of trees from the forest. Although their natural regeneration was coming up, seedling cutting particularly by fuel wood collectors and betel leaf cultivators imposes threats on new recruitments. Finally, it can be concluded that although the condition of the forest is poor, there is still some hope as shown by the rich number of regeneration. If it is possible to protect the sanctuary in the current state with effective measures of diverting the forest-dependent people toward non-forest-related livelihood alternatives or reducing dependency on the forest, there is a greater possibility of this forest to develop into a better-quality forest in future.
Funding: This research was funded by the Arannayk Foundation, Dhaka, Bangladesh.