


The purpose of this paper is to examine the effect on price of different cruise industry characteristics from the point of view of actual prices. The analysis is carried out from the supply side but taking into account the real prices paid by customers.
This paper uses the hedonic price methodology. To develop this research, a database of more than 36,000 prices paid by cruise passengers and different characteristics of ships in 2013 was built. To obtain the results, ten models have been developed with significant adjusted R2 of between 0.85 and 0.93 making the models and results robust.
The results show that the main attributes affecting prices are the number of nights of the itinerary, the departure date, the number of days before departure the booking is made, the accommodation type and some facilities, such as casinos, cinemas and swimming pools. The results also yield a ranking of ship companies based on price and quality dimensions. Finally, the authors suggest some implications for management and new research.
This paper offers a new approach in the academic literature of the cruise industry in two respects. First, in its use of a broad database of actual prices paid by passengers – more than 36,000 observations. Second, in the application of the hedonic pricing methodology, widely used in the tourism sector (see the Methodology and Database section) but until now not in the cruising segment.
Introduction
Cruises form one of the niches of the tourism industry that has expanded most in the last few years despite the economic recession around the world. According to the Cruise Lines International Association (2016) global cruise travel is continuing to grow steadily and, in the ten years from 2007 to 2017, the number of passengers will have grown by 62 per cent from 15.9 to an expected 25.8 million passengers.
This sector is characterised by the high level of business concentration, as three management groups accounted for 81.6 per cent of passengers in 2015: Carnival Corporation & plc (48.1 per cent of share and ten cruise companies); Royal Caribbean (23.1 per cent of share and five cruise companies); and NCL (10.4 per cent of share and three cruise companies). Kwortnik (2006) highlights the competitiveness of the cruise industry and the increasing price wars as a result of new and more efficient vessels attracting price-sensitive cruisers. Price wars go on not only between ship brands, but also in the distribution channel, which sometimes offers better prices than the company.
Cruise ships have sometimes been considered as “floating hotels” although exists relevant differences between ships and hotels such as the room-inventory management (Toh et al., 2005), wave booking period, large numbers of cabin categories, trip extensions, airfare packages and onboard spending (Biehn, 2006).
The cruise product includes the ship and its itineraries. Rodrigue and Notteboom (2013) insist that the cruise industry sells itineraries – ports of call – not destinations, which is much more complex in terms of commercial potential and operational developments.
The aim of this paper is to identify features and characteristics that affect the price of a cruise using the hedonic pricing methodology. This study adapts some of the further research suggested for Ji and Mazzarella (2007) and Sun, Jiao and Tian (2011).
This paper offers a new approach in the academic literature of the cruise industry in two respects. First, in its use of a broad database of actual prices paid by passengers – more than 36,000 observations. Second, in the application of the hedonic pricing methodology, widely used in the tourism sector but until now not in the cruising segment.
The paper is organised as follows. Initially we offer an overview of the academic literature on cruising from the point of view of methodologies and sources used and pricing and revenue management. We then give a lengthy explanation of the database and methodology and show the results obtained. Finally, we present our conclusions, management considerations and suggestions for new research.
An overview of academic literature on cruising
In recent years there has been an increasing number of academic papers about the cruise industry. Papathanassis and Beckmann (2011) analyse 145 cruise-related academic publications from between 1983 and 2009 and their research focus is divided equally between conceptual/discussion papers, qualitative and quantitative research. Most are related to business and management (39 per cent) and economics (17 per cent). Cusano et al. (2017) review literature about cruising classifying it into cruise supply, demand for cruising, economic impacts, fleet and ship characteristics, and environmental concerns. London et al. (2017) analyse 103 publications from 2008 until early 2016 from the point of view of ports and cruise infrastructure and the developments made and new needs as a result of the increase in the market and the size of new ships.
From the point of view of professional publications, CLIA is the main source of reference, as 95 per cent of cruise companies belong to this association. There are other sources, most of which are from private companies, so it is usually necessary to pay for this information.
Methodology and sources in cruising research
The analysis of more than 150 articles related to cruising allow us to conclude that those including empirical research are based mainly on surveys and questionnaires, despite their disadvantages (Papathanassis, 2012) and the fact that they can have different results depending on the mood of consumers when they evaluate a cruise experience (Sirakaya et al., 2004). Most of them are also local in scope, making it difficult to extrapolate conclusions (Hung and Petrick, 2011a). Qualitative research, such as observation (Yarnal and Kerstetter, 2005) and the Delphi method (Dawson et al., 2016), is also used.
Recently, more useful and sophisticated techniques, such as GPS tracking technologies (De Cantis et al., 2016; Ferrante et al., 2016), and other new technologies, allow the use of qualitative information obtained from customers’ opinions – word of mouth (Brejla and Gilbert, 2014; Zhang et al., 2015).
Obviously, data from secondary sources and websites is also used increasingly often (Lee and Brezina, 2016). In some cases, multi-method research is used (Hung and Petrick, 2011b use in-depth interviews, a panel of experts, a pilot test and an online panel survey and Rocha et al., 2017 use participant observation, individual in-depth interviews and group in-depth interviews).
However, it is difficult to get other information from companies because of the confidentiality required, and very few publications did (Coleman et al., 2003; Langenfeld and Li, 2008; Sun, Gauri and Webster, 2011).
Revenue management and pricing in cruising research
Revenue management and pricing has rarely been used in the cruise industry (Sun, Gauri and Webster, 2011) and references are scarce. There may be various reasons for this, such as the difficulty of the subject and the problems in getting reliable and useful information, as mentioned above. In a review of the main cruise research of the last 20 years, no pricing database was found, and the references to prices were more conceptual.
The final price paid by a cruise passenger includes boarding fees and tips, which, although they are officially voluntary, after often charged automatically. Although tips are a small part of the cost of a cruise, they must be considered as part of the overall cost of the holiday. Lynn and Kwortnik (2015) concluded that tipping policies can affect customer satisfaction and that guests gave more positive ratings when tips were voluntary, although this may differ depending on the customer segment. Sometimes the itinerary includes some excursions, which makes it more difficult to compare strategies.
Coleman et al. (2003) analyse the effect on prices of mergers in cruise industry. The information set out is extensive, so this research can be considered a reference for pricing strategies in this sector.
Ladany and Arbel (1991) have pioneered theoretical models demonstrating the choice of multiple priced cabins (price discrimination) in cruise tourism and its advantages, despite the fact that it is not fool proof in some segments and some multiple-price optimisation strategies could cause customer dissatisfaction. Ji and Mazzarella (2007) analyse the application of modified nested and dynamic class allocations for cruise line companies and propose a model for cruise line revenue management. Langenfeld and Li (2008) develop a broad model based on price discrimination, highlighting the importance of price discrimination, mainly third-degree as a result of market segmentation, unlike the results of Coleman et al. (2003). Moreover, these authors point out that, in the cruise industry, price discrimination can be based on certain customer characteristics – i.e. customer age, customer willingness to be flexible, geographic location – that usually do not affect airlines or hotels. Vogel (2009) develops a model based on five main assumptions about the two leading markets considering that these companies act under identical conditions and concludes that dynamic pricing, different local competitive situations and different objectives for different markets can have an effect. The same author (Vogel, 2011) suggests a cruise line model related to the impact of onboard sales emphasising pricing, profits and capacity choice. Sun, Gauri and Webster (2011) develop different forecasting models and their effects on revenue management, while, more recently, Li (2014) proposes a cruise line dynamic overbooking model with multiple cabin types.
Price is seen as one of the determinants of cruise demand (Petrick, 2004a, b, 2005) but not the only factor (Smallman and Moore, 2010). Juan and Chen (2012) conclude that price influences tourists’ decisions during the anticipation phase for planning the trip, and that price influences total tourist satisfaction and repurchase intention during the recollection phase only slightly. Conversely, Zhang et al. (2015) indicate that prices can affect satisfaction and dissatisfaction, suspecting that high prices are associated with high quality. Chua et al. (2015) conclude that if cruise vacationers perceive that the cruise fare is expensive, this perception might adversely affect the perceived value of their cruise holiday. Thus, cruise line operators should consider enhancing value perception by balancing price perception and cruise benefits. Li and Kwortnik (2016) identify price as a choice determinant but its importance varies depending on the class of the ship (55 per cent for cruisers with standard cruise lines, 48 per cent for the premium market and 40 per cent for the extraordinary segment).
Price sensitivity is one of the most topics analysed from the point of view of revenue management, mainly as a result of cruise companies’ strategy of emphasising discount prices, affecting consumers’ decision-making tendencies (Petrick, 2005). Petrick (2004a) considers price sensitivity as one of the measures to indicate whether loyal cruisers are a desirable target market and concludes that first-timers and less loyal cruisers tend to be less price sensitive and to spend more, and that the keener loyal cruisers are, the more price sensitive they are. This means loyal cruisers are desirable customers, but they are more likely to search for lower prices than their counterparts. Petrick (2005) points out some expected results, such as the fact that passengers who are less price sensitive have higher household incomes, spend more money per day on their cruise, and are more likely to purchase a more expensive cabin than passengers who are more price sensitive. “Moderates” and “highly sensitives” were found to be more attached, perceive the price more favourably, be more satisfied overall, rate the quality of services/activities higher, perceive the value to be higher and be more likely to repurchase in the future. Chua et al. (2015) attempts to incorporate price sensitivity as the moderator in the structural model to evaluate how price sensitivity influences the strength of relationships and conclude that perceived price is a significant and negative predictor of perceived value and that segmenting cruise holidaymakers based on price sensitivity levels could help cruiser line operators identify their specific needs. Chua et al. (2017) make an extensive analysis of price perception and results show that repeat cruise customers showed significantly lower perceived price and higher effective satisfaction, perceived value and behavioural loyalty than first-time cruise travellers. Very few research works have been done on price elasticity among cruise passengers. We found results in Coleman et al. (2003), who estimated the values at around −2 or higher, and in Langenfeld and Li (2008), who estimate the elasticity of price-insensitive customers (−1.2), and price-sensitive customers (−5) who are tempted by discounts, such as senior citizens or other segments.
Cruise passenger willingness to pay is also analysed. Neuts et al. (2016) and Chen, Neuts, Nijkamp and Liu (2016), Chen, Zhang and Nijkamp (2016) analyse customer value in segmented cruise markets in Japan and Taiwan and conclude that customer value increases with age, income, repeat times and escaping, so that these circumstances increase willingness to pay.
Ship companies obtain revenue from the ticket price but also from onboard revenues and commissions and from agreements with stakeholders, such as those involving shore excursions, restaurants, shops or airline companies (Weaver, 2005; Vogel, 2011). This leads to ship companies offering lower prices in order to have higher occupancy rates, as a large proportion of revenues come from onboard spending (Toh et al., 2005). They also want to achieve customer loyalty. Vogel (2011) points out that the cruise industry is currently undergoing three important trends: net onboard revenues are outgrowing ticket revenues; ticket prices barely cover costs; and ticket prices are falling. Chua et al. (2015) shares this opinion, highlighting the fact that the focus of cruise companies on making an effort to get people onboard (e.g. selling tickets at lower prices) as a result of their high fixed costs.
Finally, in a very competitive market (Kwortnik, 2006) most articles suggest management strategies. Kwortnik (2006), Ji and Mazzarella (2007), Chua et al. (2015) and Sun, Jiao and Tian (2011) summarise pricing strategies and suggest new research.
Database, methodology and model
Database
One of the main strengths of this research is the database that supports it, which was created specifically, including itineraries, the main attributes and features of vessels and the prices paid for these itineraries.
The itineraries include all those lasting more than two nights, embarking and disembarking from northern Europe (Southampton) and making their way through northern Europe during 2013. The sample uses all the cruise lines belonging to the CLIA, accounting for 95 per cent of the market, so it can be considered as highly representative. Itineraries were obtained from the cruise companies’ brochures and websites. In the database we included the ship, the ship company, the date of departure and the number of nights of the itinerary. The total number of departures is 749, corresponding to 376 different itineraries.
The attributes and characteristics of vessels were obtained from the website of the cruise company and the Berlitz guide, a leading publication in the sector (Ward, 2013). The following were taken into account for all ships: the type of cabin (the types defined are the same as in Langenfeld and Li, 2008), ship size, category according to Ward (2013), year of construction/refitting, food system, number of outdoor swimming pools, number of indoor swimming pools and the availability of casinos, laundrettes, cinemas and libraries.
For any itinerary and departure day, the fares analysed were obtained from company websites and brochures. Three prices were obtained from the websites: the official online price, the online price and the best online price, which can be different depending on the date they are consulted depending on revenue management strategies. From the brochures published, two prices were collected, the official brochure price and the minimum brochure price, which cannot change during the year as the brochure is printed. In fact, with the development of more sophisticated revenue practices and pricing strategies, most brochures nowadays include little information about prices. The prices include boarding fees and tips, although in some cases these can be considered optional (Lynn and Kwortnik 2015).
Prices collected include boarding fees and tips but not cruise passenger onboard spending, which could affect the price decisions, as passengers’ onboard elasticity is low (Vogel, 2011). Prices were collected very carefully once a month from 1 December 2012 to 30 November 2013, so another useful variable is the number of days until departure, providing interesting information for analysing revenue management strategies. In order to obtain homogeneous information, we exclude prices if airfare taxes or holiday extensions are included, although some cruise lines offer these options (Biehn, 2006). As a result, 36,634 prices were collected and included in the database. Apart from Coleman et al. (2003), this could be the most extensive database used in cruise studies.
Methodology and model
The effect of characteristics and attributes on prices can be measured in different ways. This paper presents a novel approach in the case of the cruise industry. In this case we use the hedonic pricing methodology developed from the supply perspective, assuming monopolistic competition where managers can offer a differentiated value proposition.
The use of the hedonic price methodology implies some assumptions, such as the product being a vector of objectively measured different characteristics and the effect of every attribute being separable from the rest, although they are not marketed separately in any market. In other words, the market price of a cruise can be split into the implicit prices of its different components and, as a result, total price can be defined as the sum of the price of every compound. The use of the real prices paid by the tourist, as it is the case of this research, facilitates to predict better results allowing the interaction between supply and demand.
More formally, the product, in this case a given ship, can be regarded as a set of attributes which can be related to ship features or services (see Table I) but also to its itinerary. As Biehn (2006, p. 138) points out: “The cruise product can contain several attributes including the ship, destination, cabin category, deck, fare class, number of guests, trip extensions, shore excursions”:
where i=1, …, n represents the ship and qik (k=1, …, m) each of its attributes. All these have impact on cost and consequently in prices so that the hedonic price function for each cruise is represented as:
where the functional form of P is assumed to be constant in time and across ships, though the weight or contribution of each attribute may change (Espinet et al., 2003).
Variables included in the estimated regressions
| Type of variable | Variable | Model 1A | Model 1B.1 | Model 1B.2 | Model 1B.3 | Model 1B.4 | Model 2A | Model 2B.1 | Model 2B.2 | Model 2B.3 | Model 2B.4 |
|---|---|---|---|---|---|---|---|---|---|---|---|
| Dependent variable | Total price (logarithms) | X | X | X | X | X | X | X | X | X | X |
| Independent variable | Ship | X | X | ||||||||
| Ship company | X | X | X | X | X | X | X | X | |||
| Departure month | X | X | X | X | X | X | X | X | X | X | |
| Days up to the departure | X | X | X | X | X | X | X | X | X | X | |
| Type of cabin | X | X | X | X | X | X | X | X | X | X | |
| Size of the ship | X | X | X | X | X | X | X | X | |||
| Berlitz rating | X | X | X | X | X | X | X | X | |||
| Number of nights of the itinerary | X | X | X | X | X | X | X | X | X | X | |
| Price type | X | X | X | X | |||||||
| Years of service | X | X | X | X | |||||||
| Casino | X | X | X | X | |||||||
| Outdoor swimming pools | X | X | X | X | |||||||
| Indoor swimming pools | X | X | X | X | |||||||
| Laundrette | X | X | X | X | |||||||
| Cinema | X | X | X | X | |||||||
| Library | X | X | X | X | X | ||||||
| Food system | X | X | X | X | X | ||||||
| Price type | Online price | X | X | X | X | X | X | ||||
| Official online price | X | X | X | X | |||||||
| Best online price | X | X | X | X | |||||||
| Brochure price | X | X | X | X | X | X | |||||
| Minimum brochure price | X | X | X | X | X | X |
The first studies of this methodology come from Rosen (1974). From a theoretical perspective the developments of Halvorsen and Pollakowski (1981) and Cassel and Mendelsohn (1985) are also relevant. In the tourism sector, the empirical research initially focussed on hotels in different segments such as luxury (Hartman, 1989), sun and beach hotels (Coenders and Espinet, 2003; Cox and Vieth, 2003; Espinet et al., 2003, 2012) and city hotels (Chen and Rothschild, 2010). Other studies involve holiday packages (Sinclair et al., 1990; Clewer et al., 1992; Aguiló et al., 2001; Thrane, 2005; Alegre et al., 2013), apartments (Saló and Garriga, 2011) and campsites (García-Pozo et al., 2011). The hedonic pricing methodology is also used for other types of studies, such as identifying variables or price-quality ratio, and also for other sectors (Fluvià et al., 2005; Urtasun and Gutierrez, 2006; Rigall-I-Torrent and Fluvià, 2007, 2011; Falk, 2008; Abrate et al., 2011; Rigall-I-Torrent et al., 2011; Saló et al., 2014; Balaguer and Pernías, 2013).
If the study of tourism prices is complex (Espinet et al., 2003) it becomes even more so when considering the particular characteristics of cruise industry mentioned throughout this paper, which could be the reason why this methodology has not yet been used in this market niche.
In this paper, we apply this hedonic pricing framework using econometric models. In these, the price depends on different attributes and characteristics that can be presented as a regression in a semi-logarithmic specification:
where P is the price, xn are each of the n variables incorporated in the model, βn are each of the parameters that indicate the effect on the price and εj is the standard error of the regression.
In quantitative variables, βn×100 is interpreted as the percentage change in the price when xn changes by one per cent. For qualitative variables expressed in dummy values, the value is calculated as the percentage effect on the price of the category to which the variable xn refers in the reference category.
Before presenting the definitive model, we grouped some quantitative variables in order to facilitate interpretation and to avoid multicollinearity problems. We also performed an exploratory analysis of the data where it has been verified that, a priori, the assumptions of the linear regression model are fulfilled (e.g. linearity, multicollinearity and homoscedasticity). The use of this model also implies the definition of dummy variables for every attribute or characteristic, and finally 179 dummy variables were defined. In addition, some values seemed incoherent and other were incomplete, so they were eliminated. The resulting model consisted of 35,506 prices belonging to 67 ships and 25 cruise companies.
After integrating the information, one of the preliminary results found was that the variables ship and cruise company are perfectly correlated due to the similarity in the characteristics of the ships belonging to the same company. We therefore developed ten different semi-logarithmic regressions, two using ship (models A) and eight using ship company (models B). The 1B models were developed without considering ship attributes but making divisions according the type of price. 2B models consider different explanatory variables. B.1 regressions consider all types of prices, B.2 online price only, B.3 brochure price only and B.4 minimum brochure price only. The programme used to get the results was SPSS. The final variables included and the models developed are summarised in Table I.
Results
The regressions taking the ship into account (models 1A and 2A) result in an adjusted R2 of 0.863 – a high value – but, as mentioned before, the analysis brings little value to the model as companies focus mainly on brand strategies not on ship strategies. That is why the analysis that follows is made with ship companies. The results are shown in Table II (results directly from SPSS) and Table III (percentage results related to the reference variable) which will be the main sources for interpretation.
Results
| Dependent variable: total price (logarithms) | Model 1B.1 | Model 1B.2 | Model 1B.3 | Model 1B.4 | Model 2B.1 | Model 2B.2 | Model 2B.3 | Model 2B.4 |
|---|---|---|---|---|---|---|---|---|
| Ship company (reference: Fred Olsen) | ||||||||
| Aida | 0.1922*** | 0.4445*** | −0.0227** | – | – | – | – | – |
| (0.0078) | (0.0117) | (0.0089) | ||||||
| Azamara | 0.5298*** | 0.7158*** | – | 0.5215*** | 0.3705*** | 0.2866*** | – | 0.3252*** |
| (0.0175) | (0.0244) | (0.0177) | (0.0182) | (0.0252) | (0.0211) | |||
| Carnival | −0.5134*** | −0.445*** | – | – | −0.4504*** | −0.4822*** | – | – |
| (0.0195) | (0.0201) | (0.0221) | (0.0256) | |||||
| Celebrity | 0.055*** | 0.1634*** | – | 0.1697*** | 0.0989*** | 0.2112*** | – | 0.1749*** |
| (0.0112) | (0.016) | (0.0142) | (0.0173) | (0.0242) | (0.0175) | |||
| Costa Cruceros | 0.0834*** | 0.2129*** | 0.1084*** | 0.0228* | 0.127*** | 0.26*** | 0.6615*** | 0.0006 |
| (0.0087) | (0.0137) | (0.0104) | (0.0119) | (0.014) | (0.0199) | (0.0317) | (0.0139) | |
| Crystal Cruises | 1.2934*** | 1.2594*** | – | – | 1.0725*** | 0.8334*** | – | – |
| (0.0166) | (0.0226) | (0.02) | (0.0286) | |||||
| Cunard | 0.2379*** | 0.3469*** | – | – | 0.2853*** | 0.3329*** | – | – |
| (0.0131) | (0.018) | (0.0158) | (0.0218) | |||||
| Hapag Lloyd | 0.5779*** | 0.9929*** | – | – | 0.4238*** | 0.5616*** | – | – |
| (0.018) | (0.0274) | (0.0192) | (0.0293) | |||||
| Holland American Line | 0.464*** | 0.1482*** | – | 0.8866*** | 0.4789*** | 0.1677*** | – | 0.8782*** |
| (0.0084) | (0.012) | (0.009) | (0.0113) | (0.0168) | (0.0123) | |||
| Iberocruceros | 0.2862*** | 0.3369*** | – | – | 0.0399 | −0.0093 | – | – |
| (0.0285) | (0.0268) | (0.0338) | (0.0371) | |||||
| MSC | 0.1853*** | 0.1778*** | 0.2405*** | −0.0346** | 0.2149*** | 0.2344*** | 0.7986*** | −0.0575** |
| (0.0089) | (0.0132) | (0.0121) | (0.0136) | (0.0154) | (0.0215) | (0.0381) | (0.0173) | |
| NCL | 0.0367*** | 0.147*** | – | 0.1047*** | 0.0776*** | 0.1874*** | – | 0.1047*** |
| (0.0119) | (0.0167) | (0.0141) | (0.0172) | (0.0238) | (0.0171) | |||
| Oceania Cruises | 0.4121*** | 0.5249*** | 0.4058*** | 0.4602*** | 0.1886*** | 0.1047*** | 0.2914*** | 0.3836*** |
| (0.0117) | (0.0179) | (0.0168) | (0.0134) | (0.0137) | (0.0215) | (0.0188) | (0.0198) | |
| P&O Cruises | −0.0622*** | −0.0434*** | −0.0923*** | 0.1481*** | −0.0374*** | −0.0497*** | 0.3798*** | 0.2159*** |
| (0.0086) | (0.0136) | (0.0109) | (0.0118) | (0.0109) | (0.0164) | (0.0328) | (0.0175) | |
| Phoenix | 0.165*** | 0.3468*** | – | 0.1278*** | −0.0537*** | −0.0818*** | – | |
| (0.0097) | (0.0132) | (0.0097) | (0.0151) | (0.0216) | ||||
| Princess | 0.1118*** | 0.2551*** | – | – | 0.1343*** | 0.2653*** | – | – |
| (0.011) | (0.0147) | (0.0124) | (0.0165) | |||||
| Pullmantur | 0.5062*** | 0.544*** | – | – | – | – | – | – |
| (0.0195) | (0.0202) | |||||||
| Regent | 0.8737*** | 1.0869*** | – | 0.9123*** | 0.6577*** | 0.6577*** | – | 0.886*** |
| (0.0188) | (0.027) | (0.0195) | (0.0191) | (0.0279) | (0.0267) | |||
| Royal Caribbean | −0.0556*** | 0.1982*** | – | −0.1179*** | −0.0122 | 0.2344*** | – | −0.0957*** |
| (0.0101) | (0.0144) | (0.0127) | (0.016) | (0.0221) | (0.016) | |||
| Saga | 0.3561*** | 0.5411*** | – | 0.2098*** | 0.426*** | 0.5194*** | – | 0.1223*** |
| (0.0175) | (0.02) | (0.0215) | (0.02) | (0.0236) | (0.0348) | |||
| Silversea | 1.109*** | 1.2296*** | – | – | 0.8929*** | 0.7981*** | – | – |
| (0.0217) | (0.0248) | (0.0224) | (0.0272) | |||||
| The Yacht of Seabourn | 0.96*** | 1.0793*** | – | – | 0.7313*** | 0.6796*** | – | – |
| (0.023) | (0.0262) | (0.0234) | (0.0283) | |||||
| Thomson | −0.2512*** | −0.218*** | −0.4098*** | −0.1987*** | −0.4889*** | −0.6659*** | −0.948*** | −0.3195*** |
| (0.0096) | (0.0176) | (0.0112) | (0.0104) | (0.0151) | (0.0234) | (0.0424) | (0.0163) | |
| TUI | 0.3452*** | 0.442*** | – | 0.4485*** | 0.3706*** | 0.4832*** | – | 0.4687*** |
| (0.0141) | (0.0247) | (0.0148) | (0.02) | (0.0315) | (0.019) | |||
| Month of departure (reference: July) | ||||||||
| January | −0.8031*** | −0.8586*** | −0.8145*** | −0.8969*** | −0.7973*** | −0.8487*** | −0.794*** | −0.9177*** |
| (0.084) | (0.2303) | (0.0843) | (0.0826) | (0.084) | (0.2302) | (0.0802) | (0.0818) | |
| February | −0.0983*** | 0.0328 | −0.1701*** | −0.0893** | −0.0891*** | 0.0206 | −0.1455*** | −0.0489 |
| (0.034) | (0.0582) | (0.0424) | (0.0416) | (0.0343) | (0.0585) | (0.0409) | (0.0415) | |
| March | −0.0186 | −0.08 | – | – | −0.0228 | −0.0836 | – | – |
| (0.0434) | (0.0533) | (0.0434) | (0.0533) | |||||
| April | −0.3156*** | −0.2986*** | −0.316*** | −0.2698*** | −0.3119*** | −0.2976*** | −0.2935*** | −0.272*** |
| (0.0098) | (0.0147) | (0.0134) | (0.0191) | (0.0098) | (0.0147) | (0.0128) | (0.0189) | |
| May | −0.1206*** | −0.1472*** | −0.1071*** | −0.0862*** | −0.1188*** | −0.1471*** | −0.094*** | −0.0853*** |
| (0.0047) | (0.007) | (0.0069) | (0.006) | (0.0047) | (0.0071) | (0.0066) | (0.006) | |
| June | −0.0608*** | −0.0723*** | −0.0386*** | −0.0509*** | −0.0605*** | −0.0717*** | −0.039*** | −0.052*** |
| (0.004) | (0.0059) | (0.006) | (0.005) | (0.004) | (0.0059) | (0.0057) | (0.0049) | |
| August | −0.0198*** | −0.0218*** | −0.0237*** | −0.03*** | −0.0202*** | −0.0206*** | −0.0221*** | −0.0314*** |
| (0.004) | (0.0059) | (0.0059) | (0.0049) | (0.004) | (0.0059) | (0.0056) | (0.0049) | |
| September | −0.1008*** | −0.1477*** | −0.0637*** | −0.0376*** | −0.1017*** | −0.1455*** | −0.065*** | −0.0455*** |
| (0.0054) | (0.0079) | (0.0075) | (0.0074) | (0.0054) | (0.0079) | (0.0072) | (0.0073) | |
| October | −0.2269*** | −0.2593*** | −0.1641*** | −0.2682*** | −0.2309*** | −0.2546*** | −0.1719*** | −0.2812*** |
| (0.0126) | (0.0208) | (0.0138) | (0.0304) | (0.0126) | (0.0208) | (0.0132) | (0.0304) | |
| November | −0.4098*** | −0.464*** | −0.316*** | −0.2629*** | −0.412*** | −0.4669*** | −0.3144*** | −0.2339*** |
| (0.0114) | (0.0174) | (0.0133) | (0.0235) | (0.0115) | (0.0175) | (0.0127) | (0.0235) | |
| December | −0.2571*** | −0.3098*** | −0.1925*** | −0.1762*** | −0.256*** | −0.3135*** | −0.1836*** | −0.1662*** |
| (0.0106) | (0.0172) | (0.0131) | (0.0137) | (0.0106) | (0.0173) | (0.0126) | (0.0137) | |
| Days up to departure: reference + 180 days | ||||||||
| 1-15 days | −0.0786*** | −0.1791*** | −0.0028 | 0.006 | −0.0791*** | −0.18*** | −0.0037 | 0.006 |
| (0.007) | (0.0108) | (0.0094) | (0.0085) | (0.007) | (0.0108) | (0.0089) | (0.0084) | |
| 16-30 days | −0.0772*** | −0.1789*** | 0.0176* | 0.004 | −0.0773*** | −0.1788*** | 0.0183** | 0.0033 |
| (0.0067) | (0.0099) | (0.0093) | (0.0084) | (0.0067) | (0.0099) | (0.0089) | (0.0083) | |
| 31-45 days | −0.075*** | −0.146*** | −0.0042 | 0.0021 | −0.0752*** | −0.1465*** | −0.0064 | 0.0018 |
| (0.0064) | (0.0093) | (0.0092) | (0.0083) | (0.0064) | (0.0093) | (0.0088) | (0.0082) | |
| 46-60 days | −0.0611*** | −0.1389*** | 0.0171* | 0.0037 | −0.0609*** | −0.1396*** | 0.0182** | 0.0029 |
| (0.0065) | (0.0093) | (0.0093) | (0.0084) | (0.0065) | (0.0093) | (0.0088) | (0.0083) | |
| 61-75 days | −0.0515*** | −0.0996*** | −0.0042 | 0.0046 | −0.0516*** | −0.1002*** | −0.0063 | 0.0046 |
| (0.0065) | (0.0093) | (0.0094) | (0.0084) | (0.0065) | (0.0093) | (0.0089) | (0.0083) | |
| 76-90 days | −0.0355*** | −0.0735*** | 0.0159* | 0.0015 | −0.0354*** | −0.0739*** | 0.0177** | 0.0009 |
| (0.0064) | (0.0093) | (0.0092) | (0.0083) | (0.0064) | (0.0093) | (0.0087) | (0.0082) | |
| 91-105 days | −0.0377*** | −0.0608*** | 0.0004 | 0.0078 | −0.0377*** | −0.0611*** | −0.003 | 0.0072 |
| (0.0064) | (0.0093) | (0.0093) | (0.0084) | (0.0064) | (0.0093) | (0.0089) | (0.0083) | |
| 106-120 days | −0.0264*** | −0.0468*** | 0.0127 | 0.0006 | −0.0265*** | −0.047*** | 0.0131 | −0.0008 |
| (0.0065) | (0.0094) | (0.0093) | (0.0084) | (0.0065) | (0.0093) | (0.0088) | (0.0083) | |
| 121-135 days | −0.0299*** | −0.0376*** | −0.0059 | −0.0005 | −0.0298*** | −0.0383*** | −0.0067 | 0.0001 |
| (0.0064) | (0.0093) | (0.0093) | (0.0084) | (0.0064) | (0.0093) | (0.0088) | (0.0083) | |
| 136-150 days | −0.0096 | −0.018* | 0.0158* | 0.0062 | −0.0098 | −0.0179* | 0.0162* | 0.0061 |
| (0.0065) | (0.0094) | (0.0094) | (0.0084) | (0.0065) | (0.0094) | (0.0089) | (0.0083) | |
| 151-165 days | −0.013* | −0.021** | 0.0012 | 0.0013 | −0.0132* | −0.0208** | −0.0033 | −0.0002 |
| (0.0067) | (0.0096) | (0.0098) | (0.0086) | (0.0067) | (0.0096) | (0.0093) | (0.0086) | |
| 166-180 days | 0.0031 | −0.0031 | 0.0166 | 0.0031 | 0.003 | −0.0028 | 0.0184* | 0.0019 |
| (0.0071) | (0.01) | (0.0101) | (0.0091) | (0.0071) | (0.01) | (0.0096) | (0.009) | |
| Cabin type (reference: external) | ||||||||
| Balcony | 0.2368*** | 0.2468*** | 0.2258*** | 0.27*** | 0.2369*** | 0.2462*** | 0.2258*** | 0.2711*** |
| (0.0037) | (0.0055) | (0.0054) | (0.0048) | (0.0037) | (0.0055) | (0.0051) | (0.0048) | |
| Inside | −0.1794*** | −0.1786*** | −0.195*** | −0.1534*** | −0.1796*** | −0.1784*** | −0.195*** | −0.1542*** |
| (0.0037) | (0.0056) | (0.0054) | (0.0049) | (0.0037) | (0.0056) | (0.0051) | (0.0048) | |
| Suite | 0.58*** | 0.5878*** | 0.6319*** | 0.5347*** | 0.5802*** | 0.5872*** | 0.6319*** | 0.5358*** |
| (0.0038) | (0.0056) | (0.0054) | (0.0049) | (0.0038) | (0.0056) | (0.0051) | (0.0048) | |
| Ship size (reference: large resort ship) | ||||||||
| Boutique ship | 0.0366 | 0.0598* | – | – | 0.1** | −0.046 | – | – |
| (0.034) | (0.0328) | (0.0399) | (0.0451) | |||||
| Middle-sized ship | −0.0046 | −0.0355*** | −0.0072 | 0.0726*** | 0.047*** | −0.0981*** | 0.5633*** | 0.2471*** |
| (0.0066) | (0.0098) | (0.0086) | (0.0097) | (0.0129) | (0.0192) | (0.0336) | (0.0193) | |
| Small ship | 0.0679*** | 0.0653*** | 0.0286** | 0.1169*** | 0.1096*** | 0.01 | 0.3568*** | 0.23*** |
| (0.0069) | (0.0111) | (0.0099) | (0.0096) | (0.0137) | (0.0208) | (0.0253) | (0.017) | |
| Berlitz guide ship rating (numerical) | 0.3053*** | −0.055 | −0.1077 | 0.0915 | 0.2939*** | −0.105 | −1.5615*** | −0.1987** |
| (0.0543) | (0.0787) | (0.093) | (0.0606) | (0.0722) | (0.1075) | (0.1512) | (0.0784) | |
| Number of nights on cruise (numerical) | 0.1125*** | 0.1085*** | 0.1232*** | 0.1102*** | 0.1123*** | 0.1086*** | 0.1249*** | 0.1097*** |
| (0.0004) | (0.0007) | (0.0006) | (0.0006) | (0.0005) | (0.0007) | (0.0006) | (0.0006) | |
| Price type (reference: online price) | ||||||||
| Official online price | 0.3542*** | – | – | – | 0.3542*** | – | – | – |
| (0.0053) | (0.0053) | |||||||
| Best online price | −0.1854*** | – | – | – | −0.1867*** | – | – | – |
| (0.0078) | (0.0078) | |||||||
| Brochure price | 0.3151*** | – | – | – | 0.3151*** | – | – | – |
| (0.0039) | (0.0039) | |||||||
| Minimum brochure price | 0.1271*** | – | – | – | 0.127*** | – | – | – |
| (0.0037) | (0.0037) | |||||||
| Ship’s years of service (numerical) | – | – | – | – | −0.0005 | 0.0016*** | −0.0034*** | −0.004*** |
| (0.0004) | (0.0006) | (0.0005) | (0.0004) | |||||
| Casino (reference: no casino) | ||||||||
| The ship has a casino | – | – | – | – | 0.0555*** | 0.0073 | 0.4235*** | −0.1684*** |
| (0.0099) | (0.0139) | (0.0301) | (0.0261) | |||||
| Outdoor swimming pools (numerical) | – | – | – | – | 0.0087* | −0.0153** | 0.1135*** | 0.0378*** |
| (0.0047) | (0.0069) | (0.0087) | (0.006) | |||||
| Indoor swimming pools (numerical) | – | – | – | – | −0.0185*** | 0.0074 | −0.0654*** | −0.0077 |
| (0.0047) | (0.0071) | (0.0073) | (0.0065) | |||||
| Laundrette (reference: none) | ||||||||
| The ship has a laundrette | – | – | – | – | −0.0109 | 0.0755*** | – | −0.112*** |
| (0.0131) | (0.0187) | (0.0163) | ||||||
| Cinema (reference: no cinema) | ||||||||
| The ship has a cinema | – | – | – | – | 0.0114** | −0.001 | 0.012 | 0.0171*** |
| (0.0058) | (0.0085) | (0.0097) | (0.0065) | |||||
| Library (reference: no library) | ||||||||
| The ship has a library | – | – | – | – | −0.2734*** | −0.1662*** | – | – |
| (0.0253) | (0.03) | |||||||
| Food system (reference: full board) | ||||||||
| All-inclusive | – | – | – | – | 0.2281*** | 0.4484*** | 0.4462*** | 0.088*** |
| (0.0118) | (0.0171) | (0.0342) | (0.0132) | |||||
| Constant | 5.924*** | 6.1924*** | 6.4542*** | 6.0757*** | 6.1074*** | 6.3528*** | 6.3041*** | 6.4282*** |
| (0.0401) | (0.0584) | (0.0685) | (0.0438) | (0.0594) | (0.0881) | (0.0864) | (0.0618) | |
| n | 35.506 | 13.611 | 7.644 | 9.176 | 35.506 | 13.611 | 7.644 | 9.176 |
| Adjusted R2 | 0.8514 | 0.8673 | 0.9271 | 0.9316 | 0.8517 | 0.8676 | 0.9342 | 0.933 |
| F | 3,449.4275 | 1,618.9177 | 2,778.4222 | 2,904.8677 | 3,137.1711 | 1,462.5871 | 2,714.5399 | 2,607.7672 |
| p-value | 0.0000 | 0.0000 | 0.0000 | 0.0000 | 0.0000 | 0.0000 | 0.0000 | 0.0000 |
Notes: Standard errors in brackets. *p<0.1; **p<0.05; ***p<0.01
Numerical interpretation of the results for the regression of the determinants of total price for cruises
| Mod. 1B.1 (%) | Mod. 1B.2 (%) | Mod. 1B.3 (%) | Mod. 1B.4 (%) | Mod. 2B.1 (%) | Mod. 2B.2 (%) | Mod. 2B.3 (%) | Mod. 2B.4 (%) | |
|---|---|---|---|---|---|---|---|---|
| Ship company (reference: Fred Olsen) | ||||||||
| Aida | 21 | 56 | −2 | – | – | – | – | – |
| Azamara | 70 | 105 | – | 68 | 45 | 33 | – | 38 |
| Carnival | −40 | −36 | – | – | −36 | −38 | – | – |
| Celebrity | 6 | 18 | – | 18 | 10 | 24 | – | 19 |
| Costa Cruceros | 9 | 24 | 11 | 2 | 14 | 30 | 94 | – |
| Crystal Cruises | 265 | 252 | – | – | 192 | 130 | – | – |
| Cunard | 27 | 41 | – | – | 33 | 39 | – | – |
| Hapag Lloyd | 78 | 170 | – | – | 53 | 75 | – | – |
| Holland American Line | 59 | 16 | – | 143 | 61 | 18 | – | 141 |
| Iberocruceros | 33 | 40 | – | – | – | – | – | – |
| MSC | 20 | 19 | 27 | −3 | 24 | 26 | 122 | −6 |
| NCL | 4 | 16 | – | 11 | 8 | 21 | – | 11 |
| Oceania Cruises | 51 | 69 | 50 | 58 | 21 | 11 | 34 | 47 |
| P&O Cruises | −6 | −4 | −9 | 16 | −4 | −5 | 46 | 24 |
| Phoenix | 18 | 41 | – | 14 | −5 | −8 | – | – |
| Princess | 12 | 29 | – | – | 14 | 30 | – | – |
| Pullmantur | 66 | 72 | – | – | – | – | – | – |
| Regent | 140 | 197 | – | 149 | 93 | 93 | – | 143 |
| Royal Caribbean | −5 | 22 | – | −11 | – | 26 | – | −9 |
| Saga | 43 | 72 | – | 23 | 53 | 68 | – | 13 |
| Silversea | 203 | 242 | – | – | 144 | 122 | – | – |
| The Yacht of Seabourn | 161 | 194 | – | – | 108 | 97 | – | – |
| Thomson | −22 | −20 | −34 | −18 | −39 | −49 | −61 | −27 |
| TUI | 41 | 56 | – | 57 | 45 | 62 | – | 60 |
| Month of departure (reference: July) | ||||||||
| January | −55 | −58 | −56 | −59 | −55 | −57 | −55 | −60 |
| February | −9 | – | −16 | −9 | −9 | – | −14 | – |
| March | – | – | – | – | – | – | – | – |
| April | −27 | −26 | −27 | −24 | −27 | −26 | −25 | −24 |
| May | −11 | −14 | −10 | −8 | −11 | −14 | −9 | −8 |
| June | −6 | −7 | −4 | −5 | −6 | −7 | −4 | −5 |
| August | −2 | −2 | −2 | −3 | −2 | −2 | −2 | −3 |
| September | −10 | −14 | −6 | −4 | −10 | −14 | −6 | −4 |
| October | −20 | −23 | −15 | −24 | −21 | −22 | −16 | −25 |
| November | −34 | −37 | −27 | −23 | −34 | −37 | −27 | −21 |
| December | −23 | −27 | −18 | −16 | −23 | −27 | −17 | −15 |
| Days before departure (reference: +180 days) | ||||||||
| 1-15 days | −8 | −16 | – | – | −8 | −16 | – | – |
| 16-30 days | −7 | −16 | 2 | – | −7 | −16 | 2 | – |
| 31-45 days | −7 | −14 | – | – | −7 | −14 | – | – |
| 46-60 days | −6 | −13 | 2 | – | −6 | −13 | 2 | – |
| 61-75 days | −5 | −9 | – | – | −5 | −10 | – | – |
| 76-90 days | −3 | −7 | 2 | – | −3 | −7 | 2 | – |
| 91-105 days | −4 | −6 | – | – | −4 | −6 | – | – |
| 106-120 days | −3 | −5 | – | – | −3 | −5 | – | – |
| 121-135 days | −3 | −4 | – | – | −3 | −4 | – | – |
| 136-150 days | – | −2 | 2 | – | – | −2 | 2 | – |
| 151-165 days | −1 | −2 | – | – | −1 | −2 | – | – |
| 166-180 days | – | – | – | – | – | – | 2 | – |
| Cabin type (reference: outside) | ||||||||
| Balcony | 27 | 28 | 25 | 31 | 27 | 28 | 25 | 31 |
| Inside | −16 | −16 | −18 | −14 | −16 | −16 | −18 | −14 |
| Suite | 79 | 80 | 88 | 71 | 79 | 80 | 88 | 71 |
| Boat size (reference: large resort ship) | ||||||||
| Boutique ship | – | 6 | – | – | 11 | – | – | – |
| Middle-sized ship | – | −3 | – | 8 | 5 | −9 | 76 | 28 |
| Berlitz guide ship rating (numerical) | ||||||||
| Small ship | 7 | 7 | 3 | 12 | 12 | – | 43 | 26 |
| 0 | – | – | – | 0 | – | 0 | 0 | |
| Number of nights of cruise (numerical) | 11 | 11 | 12 | 11 | 11 | 11 | 12 | 11 |
| Price type (reference: online price) | ||||||||
| Official online price | 43 | – | – | – | 42 | – | – | – |
| Best online price | −17 | – | – | – | −17 | – | – | – |
| Brochure price | 37 | – | – | – | 37 | – | – | – |
| Ship’s years of service (numerical) | ||||||||
| Minimum brochure price | 14 | – | – | – | 14 | – | – | – |
| Casino (reference: no casino) | – | – | – | – | – | 0 | 0 | 0 |
| The ship has a casino | – | – | – | – | 6 | – | 53 | −15 |
| Outdoor swimming pools (numerical) | – | – | – | – | 1 | −2 | 11 | 4 |
| Indoor swimming pools (numerical) | – | – | – | – | −2 | – | −7 | – |
| Laundrette (reference: none) | ||||||||
| The ship has a laundrette | – | – | – | – | – | 8 | – | −11 |
| Cinema (reference: no cinema) | ||||||||
| The ship has a cinema | – | – | – | – | 1 | – | – | 2 |
| Library (reference: no library) | ||||||||
| The ship has a library | – | – | – | – | −24 | −15 | – | – |
| Food system (reference: full board) | ||||||||
| All inclusive | – | – | – | – | 26 | 57 | 56 | 9 |
Note: Only significant variables at 10, 5 and 1 per cent significance levels are interpreted
Taking into account the company cruise models, the results show high values of adjusted R2 – between 0.85 and 0.93 – which means the variables considered explain the price, especially when considering brochure prices (0.93). Other interesting results are the fact that there are few differences whether ship attributes – years of service of the ship, casino, swimming pools, laundry, cinema, library and board type – or not. Furthermore, the correlations between variables and multicollinearity are low.
In this section, we interpret the principal results obtained (Tables II and III), especially those that are significant with 99, 95 and 90 per cent of confidence.
Cruise companies
Results about cruise companies can be considered as an approximation of a ranking of company price-quality, the best predictor of value (Petrick, 2005), with different results depending on the variables introduced in the model. This is the first study in the cruise literature that proposes a price-quality ratio from the supply-side point of view. To date, price-quality analysis had been carried out using other methodologies, such as surveys (Chua et al., 2017).
As not all companies offer all types of prices, we only are going to compare those with a minimum of 20 companies. In this case we analyse the models that include all type of prices (1B.1; 2B.1) and those that specifically include the online price (1B.2; 2B.2).
The range between the cheapest and the most expensive ship company varies considerably depending on the model. The highest range – 305 per cent – occurs when not discounting the effect and considering all the prices (model 1B.1), followed by the same model including only the online price (1B.2) showing a range of 288 per cent. The models that discount the effect of ship services provide less difference: 231 per cent when all prices are included (2B.1) and 179 per cent when analysing only online prices (2B.2). These last results highlight the wide range of possible prices.
Regardless of the model used, the cheapest companies are always Carnival – the market leader in the competitive low-price cruise market (Dev, 2006) and in price wars (Kwortnik, 2006) – Thomson and P&O Cruises. The most expensive are Crystal Cruises, Silversea, The Yacht of Seabourn and Regent. These results demonstrate stable strategies, show the models developed to be robust and coincide notably with those obtained by Li and Kwortnik (2016), although these authors consider price without any adjustment for product characteristics.
Itineraries and departure dates
Considering itineraries, results showed that for each additional cruising day, the price increases by 11 per cent. These results are also very stable in all models.
The destination is conditioned by climate: 94 per cent of departures are between May and September. July is the most expensive month, followed by August (−2 per cent), June (−6 per cent), September (−10 per cent) and May (−11 per cent). These results are notably stable between models and price differences depending on the departure date are common in the sector (Biehn, 2006).
Booking behaviour
One of the relevant aspects for study is whether there are differences depending on the time between the booking date and the departure date. As Biehn (2006, p. 139) says: “Incorporating the time of booking as a seasonality measure adds an important component to making pricing and availability decisions”. The results indicate that the prices are lower the closer the cruise departure date is to the passenger booking date (Table III), −8 per cent for the whole model and −16 per cent in the case of the model using online prices only.
These results could contradict some revenue management practices, as it is expected that consumers will get better prices if they book in advance (Ji and Mazzarella, 2007) and are in the line with Coleman et al. (2003, p. 142), a leading work on this topic, which points out “the lack of a consistent pattern of prices through the booking cycle”. The results observed can be explained mainly because the itinerary is already complete and there are only some cabins free, which are probably the worst located ones (e.g. those next to the lifts). In fact, Figure 1 shows that, considering the online price model, the number of observations from 1 to 15 days is the lowest, representing only 5.1 per cent, while the number of observations for bookings more than 180 days in advance represents 11.4 per cent. Toh et al. (2005) point out that the early departure rate is very low in the cruise industry and that cruise passengers book further in advance than for hotels, extending the booking window up to a year. Moreover, companies do not always offer online prices, as there are other important channels, such as travel agents. Another explanation could be that when a cruise has exceeded a minimum level of expected income it seems not to need price reduction strategies to sell more cabins. The authors are analysing this situation more specifically and we hope to give more useful information in a future paper.
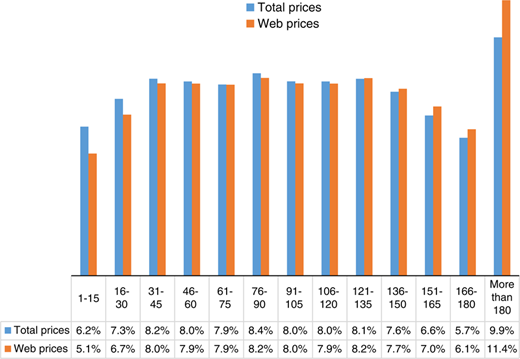
Percentage of observations depending on the number of days booked before departure
Percentage of observations depending on the number of days booked before departure
Price types
Models 1B.1 and 2B.1 allow a comparison of the differences depending on the type of price analysed. The cheapest price is the best price offered on the website (best online price), a saving of 17 per cent on the online price and a price actually paid by passengers that can be considered a “lowest price guarantee” or a “cabin category guarantee” where the actual cabin is assigned to the customer before departure to encourage bookings (Lieberman, 2012).
Official and brochure prices are intended to be a benchmark and are always above the online price (+14 per cent for the minimum brochure price, +37 per cent the brochure price and +42 per cent the official online price). It should be noted that online prices can be changed at any time depending on revenue management practices, while brochure prices are published and cannot be changed.
As already mentioned, the best online price could be the result of a strategy of subsidising ticket prices in order to get higher occupation levels, allowing revenue optimisation in a context of fixed costs (Vogel, 2011).
Although online bookings are increasing, it is believed these will not be as popular as in air travel and hotel reservations, as cruising is a more complex product. In fact, Toh et al. (2005, p. 134) point out: “on average it takes 14 phone calls between the travel agent and the customer to conclude a sale. People want informed choices, and only experienced travel agents can provide this”.
Cabin types
The type of cabin considerably affects prices and shows substantial differences demonstrating price discrimination practices. The cheapest cabin is an inside one (−16 per cent compared to the outside cabin), followed by an outside cabin and a cabin with balcony (+27 per cent). The most expensive are suites (+79 per cent). According Langenfeld and Li (2008) prices are different within the same cabin category depending on the customers’ price sensitivity and, on average, the price paid by price-sensitive customers is 34 per cent lower than that paid by price-insensitive customers, although these differences are lower in balcony (23 per cent) and outside cabins (21 per cent). Although cabins are usually classified in four types (inside, outside, balcony and suite), many cruises have 15-25 different cabin categories and newer ships have over 30 categories, so price differentials are frequently relatively small (Lieberman, 2012). This is another difference from other tourism activities, such as airlines or hotels.
Cruise Lines International Association (CLIA) (2017) shows that suite and balcony cabins are the most important features in a cruise ship and, in fact, new ships have more cabins with balconies, which can reinforce the importance of differential prices. Likewise, as mentioned in booking behaviour, as there are different types of cabin within the same type of accommodation (Ji and Mazzarella, 2007), revenue management is more difficult (Biehn, 2006). Along these lines, it can be clearly segmented for the same boat and itinerary, making the price differential between different types of cabin less dramatic (Ji and Mazzarella, 2007). As an example, suite customers in some cases have access to VIP lounges and other benefits, which may explain the difference in prices, validating the opinion of Biehn (2006, p. 140) that “in the case of a cruise product, customers are more likely to ‘buy up’ or ‘buy down’, especially if similar cabin categories are still available”.
Ship attributes
The ship attributes and characteristics results offer some interesting findings. The year of service does not affect prices, so it seems that refitting is enough and is assumed by brand image.
Ship size affects prices. Descriptive analysis shows that shipping companies tend to have fleets of a similar size. Small and boutique ships are the most expensive – 12 and 11 per cent higher compared to large boats – with 5 per cent for medium boats. In other words, large ships are the cheapest, probably because they can take advantage of economies of scale, while smaller boats opt for specialisation and differentiation.
Most ships offer full board but some offer all-inclusive to differentiate. This results in a price increase of 26 per cent on average, going up to 57 per cent for online price. This can be a decision to consider for all companies which is, in fact, applied for 36 per cent of ships. In some cases, food and drink packages are offered to stimulate demand.
The characteristics that most affect prices are the casino – 6 per cent and one of the main source of revenues and very much used by cruisers (2017a) – and the cinema – 1 per cent and one of the most highly rated attributes by customers (Xie et al., 2012). Along similar lines, outdoor swimming pools increase prices (1 per cent) and are also relevant, both for cruisers and potential cruisers (Xie et al., 2012), and they are among the most used features (CLIA, 2017). Indoor swimming pool results tend to be negative, probably because they may not be useful for cruisers and library results can be rejected as they are available on all the ships except one. All these public rooms are very important for consumers (Brejla and Gilbert, 2014) and their satisfaction (Zhang et al., 2015).
Finally, another result is that the Berlitz guide rating (Ward, 2013) does not affect price, which is rather surprising. More research should be done on this, as it would mean that the most similar approximation to category is not related to price.
Conclusions and management implications
This paper examines the effect on price of different cruise industry characteristics from the point of view of actual prices and in accordance with the hedonic price methodology. The analysis is therefore carried out from the supply side but taking into account the real prices paid by customers. Before exhibiting this research, a broad analysis of previous perspectives was made. To develop this research, a database of more than 36,000 prices paid by cruise passengers and different characteristics of ships in 2013 was built. To obtain the results, ten models have been developed with significant adjusted R2 of between 0.85 and 0.93 making the models and results robust.
We can conclude that cruising is one of the sectors with the most sophisticated revenue management strategies, allowing resource optimisation. In fact, prices change depending on the date of departure, the number of days before departure the booking is made, the type of cabin and whether some features or services are offered, such as casinos, cinemas, outdoor swimming pools or all-inclusive. Many of these show remarkable similarities to the work of Xie et al. (2012) and Zhang et al. (2015). The application of price discrimination practices to improve pricing strategy revenues have been suggested before (Ladany and Arbel, 1991; Dev, 2006), particularly third-degree price discrimination (Langenfeld and Li, 2008). Although some results are not surprising, this is the first study to show figures for its impact, helping with the making of better financial decisions.
This work makes a contribution to the literature. To begin with, it is the first study using the hedonic pricing methodology based on considering the cruise product as a basket of characteristics and attributes. Second, is the first study to use prices obtained as if we were users and taking into account different channels and dimensions of prices such as online price, official online prices, best online price, brochure price and minimum brochure price. Third, is the first study in developing a ranking of cruise companies that can be considered solid as the robustness and stability of the models. Other new approaches offered by this study are the use of different types of price, the analysis of price differences depending on the number of days between the date of booking and the date of departure, as well as offering numerical values for the results.
From a management perspective, the results of this research make it possible to suggest some strategies. First, it would be very useful for ship companies to know their position in relation to competitors considering attributes and characteristics other than the nominal price and to better identify strengths and weaknesses in order to make decisions. Second, the results suggest the application of pricing and product strategies and their impact on prices, so that it would possible to estimate the impact on revenues more precisely. Some of these measures can be easily implemented and with a relatively low cost (casino, cinema, all-inclusive, etc.) and other are more difficult and costlier. These measures are complementary to those suggested by Ji and Mazzarella (2007) such as upselling, category-based upgrading, onboard RM and options/waiting lists.
The main limitation of this research is that the database is local and restricted to northern Europe even though it includes all itineraries and results, so there could be differences from other destinations. Another limitation is that some potentially relevant variables could be lacking, such as detailed itineraries, although the results of the models seem include most variables. This study also does not include total cruise passenger spending so that other strategies could be suggested (Ji and Mazzarella, 2007).
From the point of view of pricing and revenue management there is a wide range of possibilities for future research, as suggested by Sun et al. (2011). This paper opens up new sources of research in different ways. First, it would be useful to make more use of the possibilities of the database, combining the variables in different ways and using other methodologies, and the authors are working on this. Second, we suggest the creation of a panel of data on characteristics, attributes and prices representing the whole market – destinations, origins, segments and dates – allowing us to do more and more useful research. Other opportunity lies in the development of a stable price ranking, comparing the competitiveness of ship companies considering nominal prices as well as a price-quality ratio considering the price adjusted for features and attributes. It may be also useful to compare prices with quality and satisfaction variables like those offered by Ward (2013). Most of this new research can be done thanks to technological advances and the development of big data.

