


The purpose of this paper is to investigate whether Islamic stock indexes outperform conventional stock indexes, in terms of informational efficiency and risk, during the recent financial instability period.
The paper uses a state space model combined with a standard GARCH(1,1) specification while taking into account structural breakpoints. The authors allow for efficiency and volatility spillovers to be time-varying and consider break dates to locate periods of financial instability.
Empirical results show that Islamic stock indexes are more volatile than their conventional counterparts and are not totally immune to the global financial crisis. As regards of the informational efficiency, the results show that the Islamic stock indexes are more efficient than the conventional stock indexes.
Resulting evidence of this paper has several implications for international investors who wish to invest in Islamic and/or conventional stock markets. Policy makers and even academics and Sharias researchers should as well take preventive measures in order to ensure the stability of Islamic stock markets during turmoil periods. Overall, prudent risk management and precocious financial practices are relevant and crucial for both Islamic and conventional financial markets.
The originality of this study is performed by the use of time-varying models for volatility spillovers and informational efficiency. It considers structural break dates that think about the dynamic effect of informational flows on stock markets. The study was developed in a global framework using international data. The global analysis allows avoiding country specific effects.
1. Introduction
In spite of the notable increase of Islamic finance, studies on Islamic equity markets have gained ground, in particular following the global financial crisis (GFC). Indeed, current financial literature focused on the analysis of the performance of Islamic indexes by raising the question of whether Islamic indices outperform their conventional counterparts (Hussein, 2004; Hakim and Rashidian, 2002). They mainly paid attention to differences in risk and return characteristics between Islamic and conventional investments (Dewandaru et al., 2015; Al-Khazali et al., 2014; Abul Basher et al., 2014; Ho et al., 2014; Milly and Sultan, 2012; Hayat and Kraussl, 2011; Abdullah et al., 2007). Nevertheless, mixed and conflicting empirical observation was found and no consensus was attained to date. Indeed, number of studies revealed an outperformance of Islamic stock indexes compared to conventional stock indexes (Jawadi et al., 2014; Ali et al., 2014; Arouri et al., 2013). Other investigations observed notable diversification benefits associated with the investing in Islamic assets (Hakim and Rashidian, 2002; Guyot, 2011). On the contrary, Girard and Hassan (2008) and Kok et al. (2009) found contrary results. Consequently, we believe that this research field deserves further investigations in so far as it allows providing support tools to investment decision or capital budgeting.
Modern financial theory suggests that the capital budgeting on stock markets depends mainly on development level, performance and risk. Indeed, investors have to consider informational efficiency given that on an efficient market; they are able to easily determine risk and profitability of their investments, since there is no overvalued and/or undervalued title. Additionally, given that on an efficient market, stock price adequately reproduces firms’ perspectives and capital will be allocated effectively to the most profitable investment, which is beneficial for market development and economic growth. However, the market efficiency alone is not enough for capital budgeting; market volatility is another main axis because it is straightforwardly related to the degree of risk.
The empirical literature of financial markets has grown in recent years to go further than the analysis of performance in terms of risk and return. Indeed, a limited part of the literature was interested in the international transmission of shocks in terms of either efficiency or volatility between Islamic indices on the one hand and between them and their developed counterparts on the other hand (Ben Rejeb, 2017; Ben Rejeb and Arfaoui, 2017; Al-Khazali et al., 2015; Ajmi et al., 2014; Hammoudeh et al., 2014; Dania and Malhotra, 2013). The results were divergent and inconclusive. Authors have tried mainly to study the degree of interdependence between Islamic and conventional stock markets, especially in periods of high financial fragility and during the last GFC, in terms of two important concepts separately namely: information efficiency and conditional volatility. The two concepts are extremely useful in either selection of investments or portfolio designs.
Some of these articles (Ben Rejeb, 2017; Ben Rejeb and Arfaoui, 2017; Hammoudeh et al., 2014) make a significant contribution to the empirical financial literature, since they used econometric techniques that are pertinent to deal with high-frequency data and especially to analyze interactions between several variables while considering a time-varying framework (the copula and the wavelet approach, the Bai and Perron (1998, 2003) technique, the state space model and the quantile regression technique). Nevertheless, each of the previous empirical studies treats either separately an important tool of financial performance or they just focused on the analysis of interdependencies.
The main objective of this study is to analyze the performance of Islamic stock indices with regard to their conventional counterparts, in high financial fragility periods and, especially, during the subprime crisis considering the volatility spillover effects. In addition, this paper is an attempt to combine the informational efficiency and volatility concurrently to analyze the performance of Islamic stock indices in comparison with their conventional counterparts. Indeed, the market efficiency is not alone enough for capital budgeting and for the analysis of market performance; market volatility is another main axis because it is straightforwardly related to the degree of risk. We note here that we allow both informational efficiency and conditional volatility to be time-varying not static. The time-varying parameters make it possible to track the dynamics of good and bad news inherent to market risk factors.
To achieve our objective, we first measured the volatility by a standard GARCH (1,1) model, that allows to consider an essential market characteristic, namely, the conditional volatility, which is not constant over time. We note that various empirical studies show that the GARCH (1,1) specification performs well to predict the volatility of financial series despite the diversity of conditional volatility models in financial empirical literature (Charles and Darne, 2006; Nikkinen et al., 2008; Ramlall, 2010). The originality of this study is primarily the use of specific econometric approach to the stock market context. Indeed, the empirical investigations are essentially based on time-varying models that take into account the variability over time of the various financial aspects. Second, compared to previous studies, this study examines the interdependencies during financial fragility periods and especially the last GFC. Indeed, we adopt the Bai and Perron’s (1998, 2003) technique to detect different structural break dates and then determine high financial fragility periods. This technique is very relevant in the data processing related to stock markets that are generally characterized by the presence of multiple regimes in the variance (Bensafta and Semedo, 2011; Nguyen, 2008). The third contribution is the adoption of a different methodological approach that considers the dynamic effect of informational flows on stock markets. We then consider the hypothesis of time-varying weak efficiency. We then use an auto-regressive model in which the coefficients may vary depending on market conditions. This model was first introduced by Zalewska-Mitura and Hall (1999) and developed by Fontaine and Nguyen (2006). It can detect both changes in the degree of efficiency and convergence speed toward the weak efficiency via the mutation of coefficients.
This present paper is a synthesis and a generalized work, it brings an important contribution to the empirical literature in so far as it adds significantly to the analysis of performance using relevant dynamic econometric tools, which have not been used until now or rarely used in the financial markets research area. The empirical analysis may constitute a help support to international investment decisions. Since investment decisions depend on stock market performance. Resulting evidence of this work has several implications for market regulators and international investors who wish to invest in Islamic and/or conventional stock markets.
2. Literature review
The empirical literature on the performance of Islamic equity indices is growing but shows a controversy when compared to their conventional counterparts. Two reasons may be discussed here; first, in accordance with modern financial theory, Islamic equity indices can be assumed riskier than their conventional counterparts due to the lack of diversification (Albaity and Ahmad, 2008). Furthermore, these indices could be more profitable than their counterparts since they include companies that have passed the financial and extra-financial screening criterion (Atta, 2000; Hussein and Omran, 2005). In addition to these two divergent positions, another current literature concludes that the performance of Islamic indices is similar to their conventional counterparts (El khamlichi et al., 2014).
Hassan (2004) empirically examines market efficiency and time-varying risk-return relationship for the DJIM and volatility of the DJIM index over the 1996–2000s period. Using serial correlation, variance ratio, the Dickey Fuller tests and the GARCH econometric framework, the author finds that the DJIM outperformed the conventional indices but underperformed them for the period 2001–2005. He shows a significant positive relationship between conditional volatility and DJIM equity index returns. He further reveals that the reward to risk and diversification benefits are similar for both indices. Similarly, Girard and Hassan (2008) find no influential differences between Islamic and non-Islamic equity indices between January 1999 and December 2006. The analysis of many ratios about market risk, size, book-to-market, momentum, and local and global risk factors results in a non-significant difference in return between Islamic and conventional indices. The performance gap is attributed to differences in style between the two types of series.
Elfakhani et al. (2005) study the Islamic investment funds and investment fundamentals in such channels. They explore the dynamics of Islamic investment funds, governance and control, marketing and distribution. The ANOVA statistical test shows that there is no significant disparity regarding fund performance compared to all used indices. Therefore, the study concludes that the behavior of Islamic mutual funds is not different from that of other conventional funds, whether some mutual funds comply with the Shariah that have exceeded underperforming funds. Hussein (2004) examines whether returns earned by investors who purchase shares in the FTSE Global Islamic Index are significantly different from their index counterpart. The results show that although Islamic and conventional indices have similar performance, Islamic indices reach abnormal returns in bullish markets and underperform in bearish markets. In general, the author concludes that the application of ethical screening does not have an adverse effect on the FTSE Global Islamic Index performance. Likewise, Al-Zoubi and Maghyereh (2007) using the Value-at-Risk methodologies in the 1996–2005 period, examine the relative risk performance of the Dow Jones Islamic Index and find that the index outperforms the Dow Jones World Index in terms of risk. Indeed, they conclude that Islamic indices are less risky than the benchmark and attribute this evidence to the profit and loss sharing principle in Islamic finance. Arshad and Rizvi (2013) address the question whether Islamic indices are affected through fundamental changes or short-term influences by sudden changes in volatility as compared to their conventional counterparts. The authors employ the continuous wavelet technique to identify co-movements between world financial indices and Islamic indices for world, Asia Pacific and emerging markets. Over a period of 15 years, they find that Islamic indices in the Asia Pacific and emerging market region are partially immune to speculative shocks to global financial services. These results corroborate those of Milly and Sultan (2009) which conclude that Islamic funds perform much better during calm periods and moderately better during times of crisis. He then assumes that Islamic asset allocation may be safer during times of economic and financial distress. Mansor and Bhatti (2011) analyze performance of the mutual funds for the Islamic and conventional portfolios in Malaysia, from 1996 to 2009. The results show that the Islamic portfolio provides slightly less returns relative to the conventional counterparts and that the Islamic portfolio is riskier than the conventional portfolio. The results also reveal that both Islamic and conventional portfolios are dependent on the market portfolio of which the former portfolio was closely mirrored to the market movement in relation to the latter portfolio. Abdullah et al. (2007) examine the relative performance of 14 Islamic funds and 51 conventional investment mutual funds in Malaysia during the period spanning from January 1992 to December 2001 using a number of methods, such as the Sharpe index, the adjusted Sharpe index, the Jensen Alpha, the Modigliani measure and the timing method. In this study, Islamic funds achieve better results than conventional funds during a bear market, while conventional funds reverse the trend during a bull market. The introduction of Islamic mutual funds in a portfolio can cover the downside risk in adverse economic conditions.
From the previous literature review, we can note that despite the multiplicity of previous empirical works focusing on the analysis of Islamic and conventional stock markets performance, the results are much divergent and no consensus has been reached to date. In the same context, this paper attempts to fill the gap in the literature to deal with this same concept of performance. However, unlike previous studies, we try to give special importance to the econometric techniques. Indeed, our empirical investigations are essentially based on time-varying models that take into account the variability over time of the various financial aspects addressed in this work.
3. Empirical methodology
In this study, we use the standard GARCH model to measure the conditional volatility for all conventional and Islamic stock markets. It is worth noting that the choice of the standard GARCH specification is far from being arbitrary. Indeed, we estimated different GARCH-model specifications and we chose the GARCH (1,1) specification for all markets’ volatility processes according to the widely-used information criteria (Akaike information criterion, Schwarz criterion or Bayesian information criterion and log-likelihood value).
More specifically, we compared the standard GARCH specification to the non-linear EGARCH and GJR-GARCH specifications. The choice of these specifications is justified by the fact that it accounts for the asymmetry in the response of the conditional variance to innovations. Nevertheless, the results of different information criteria clearly show the relevance of the standard GARCH model[1]. Again, many studies (see among others, Bollerslev et al., 1994; Ramlall, 2010) argued that the standard GARCH specification is the most appropriate specification, especially when it comes to high-frequency data. We also highlighted the relevance of this model in terms of theoretical stability conditions. Parameters estimation of the conditional variance model that has been reported (see Table II) turned out to be positive and statistically significant at the 1 percent level.
Estimation results from the state space model with GARCH effects
| Conditional mean equation | State equations | Conditional variance equation | |||||||
|---|---|---|---|---|---|---|---|---|---|
| (%) | (%) | Likelihood value | |||||||
| Conventional markets | |||||||||
| Emerging markets | 0.022 (0.000) | 26.492 (0.049) | 0.000** (0.000) | 0.002* (0.001) | 0.000** (0.000) | 0.106** (0.005) | 0.887** (0.005) | 0.993 | 16,548.975 |
| Arab markets | −0.114 (0.006) | −11.452 (0.047) | −0.002** (0.000) | 0.000 (0.001) | 0.000** (0.000) | 0.077** (0.003) | 0.913** (0.003) | 0.990 | 8,715.211 |
| Arab markets excluding SA | −0.088 (0.005) | −6.466 (0.048) | −0.001** (0.000) | −0.000 (0.001) | 0.000** (0.000) | 0.082** (0.004) | 0.909** (0.003) | 0.991 | 9,178.526 |
| GCC | −0.033 (0.004) | −2.247 (0.039) | −0.001** (0.000) | −0.002 (0.003) | 0.000** (0.000) | 0.080** (0.003) | 0.918** (0.003) | 0.998 | 5,875.286 |
| Canada | 0.033 (0.000) | 10.276 (0.020) | 0.000 (0.000) | −0.001** (0.000) | 0.000** (0.000) | 0.069** (0.004) | 0.928** (0.004) | 0.997 | 15,720.990 |
| UK | 0.030 (0.000) | −3.215 (0.048) | −0.000 (0.000) | −0.004* (0.002) | 0.001** (0.000) | 0.080** (0.005) | 0.909** (0.006) | 0.989 | 15,998.709 |
| USA | 0.017 (0.001) | −5.620 (0.053) | −0.000 (0.000) | 0.003** (0.001) | 0.000** (0.000) | 0.087** (0.005) | 0.900** (0.006) | 0.987 | 14,712.781 |
| Europe | 0.031 (0.000) | 1.403 (0.050) | 0.000 (0.001) | 0.002 (0.001) | 0.000** (0.000) | 0.084** (0.005) | 0.909** (0.005) | 0.993 | 15,970.633 |
| Asia Pacific | −0.011 (0.001) | 7.577 (0.034) | −0.000* (0.000) | −0.001 (0.000) | 0.000* (0.000) | 0.085** (0.005) | 0.905** (0.006) | 0.990 | 15,941.030 |
| World | 0.006 (0.000) | 14.814 (0.021) | −0.000** (0.000) | 0.004** (0.000) | 0.000** (0.000) | 0.081** (0.006) | 0.910** (0.005) | 0.991 | 13,645.687 |
| Islamic markets | |||||||||
| Islamic emerging markets | 0.021 (0.001) | 20.520 (0.012) | 0.000 (0.000) | 0.000 (0.006) | 0.000** (0.000) | 0.103** (0.006) | 0.889** (0.005) | 0.992 | 15,951.888 |
| Islamic developed markets | 0.006 (0.000) | 15.849 (0.025) | −0.000* (0.000) | −0.000 (0.001) | 0.001** (0.000) | 0.082** (0.005) | 0.908** (0.005) | 0.990 | 13,805.513 |
| Islamic Canada | 0.008 (0.001) | 9.210 (0.007) | −0.000 (0.000) | 0.000 (0.001) | 0.000** (0.004) | 0.063** (0.003) | 0.934** (0.003) | 0.997 | 14,513.519 |
| Islamic UK | 0.021 (0.000) | −2.073 (0.047) | −0.000 (0.000) | 0.004* (0.002) | 0.002** (0.000) | 0.063** (0.004) | 0.929** (0.004) | 0.992 | 15,633.658 |
| Islamic USA | 0.009 (0.000) | −4.532 (0.053) | −0.000 (0.000) | −0.004* (0.002) | 0.000** (0.000) | 0.086** (0.005) | 0.901** (0.006) | 0.987 | 16,101.963 |
| Islamic Europe | 0.027 (0.001) | −1.407 (0.027) | 0.000 (0.000) | 0.002 (0.002) | 0.000** (0.000) | 0.075** (0.005) | 0.919** (0.004) | 0.994 | 15,846.503 |
| Islamic Asia pacific | −0.008 (0.001) | 5.447 (0.038) | 0.000** (0.000) | 0.001 (0.000) | 0.000** (0.000) | 0.080** (0.005) | 0.912** (0.005) | 0.992 | 16,000.810 |
| Islamic world | 0.001 (0.001) | 10.849 (0.025) | −0.000 (0.000) | −0.000 (0.001) | 0.001** (0.000) | 0.081** (0.006) | 0.908** (0.005) | 0.989 | 13,805.513 |
Notes: The standard deviations of estimated parameters are given in parenthesis. For the estimated parameters in the conditional mean equation, we report their averages since they are allowed to vary over time. The significance of these coefficients ( in particular) in each time period is examined by using a standard t-test and shown in the graph of time-varying predictability (see, Figure 1). *,**Indicate that coefficients are, respectively, statistically significant at 5 and 1 percent level
In order to determine the financial fragility periods, we proceed to detect structural break dates in the conditional volatility series using the Bai and Perron’s (1998, 2003) econometric technique. We consider the following regression model with m breaks and m+1 regimes[2]:
is the estimated volatility in period t. If there are m multiple structural breaks (T1, …, Tm) in the time path of , Bai and Perron (1998, 2003) explicitly treat structural breakpoints as unknown, and estimates of the breakpoints are implemented using the OLS method for each Tm. The breakpoints estimations are generated by minimizing the sum of squared residuals.
The breakpoints estimations are generated by minimizing the sum of squared residuals and are given by:
In this expression, ST is the sum of squared residuals issued from the estimation of m regressions in Equation (3). The selection procedure of structural breaks is based on the Bayesian Information Criteria.
As about the market efficiency, it has been defined in the financial literature in different ways[3] and no standard conventional definition has been advanced yet. Therefore, it is important to shed light on the measurement of the informational efficiency. We take on the definition of Fama (1970), according to which, market efficiency is attributed to the informational content of news. Furthermore, on an efficient market, prices fully reveal all relevant and available information. According to Fama (1970, 1998), there are three types of efficiency and this depends on the available information on the market, i.e., weak, semi-strong and strong efficiency.
We try to add to traditional methods and focus on the time-varying efficiency in so far as maturating stock markets involves sustainable information inflows, changing markets structure, and an increasing sophistication of markets participants. These changes result in a shifting of market efficiency through time (Arouri and Nguyen, 2010). Such feature, if it exists, will be considered using a dynamic modeling of returns. We then adopt the time-varying technique proposed by Zalewska-Mitura and Hall (1999), through which the autocorrelation coefficient of equity returns is likely to vary conditional on market conditions. The weak form of efficiency can be tested using the following model:
The variable Rit stands for the Islamic and conventional stock market returns at time t. and measure, respectively, the long-term trend and the potential serial dependency of market i. They are allowed to change over time according to a first-order random-walk process described in Equation (7). The idea behind this dynamic modeling is that time values of these unobserved factors are a function of underlying market fundamentals that drive stock market price formation (Arouri and Nguyen, 2010). ht represents the conditional variance of residuals , which is assumed to follow the standard GARCH(1,1); and , random noises, assumed to be normally distributed with a zero mean and variances of 1 and , respectively. In order to apply the Kalman filter, innovations in Equation (4) are assumed to be uncorrelated with those in Equation (7). The estimated value of should be equal to “zero” or statistically insignificant to confirm the hypothesis of weak-form efficiency.
The estimation of this state space model which is characterized by the presence of hidden variables requires the application of an optimal algorithm (the Kalman filter). Generally, the Kalman filter recursively provides the optimal estimator of the system’s current states, conditional to the available information at that time, by a two-steps process. To determine estimated values of the set of unknown parameters we have to construct a log-likelihood function based on the Kalman gain under the normality assumption (Harvey, 1995). Estimation of the model is then carried out using the quasi-maximum likelihood[4] method of Bollerslev and Wooldridge (1992), which provides asymptotic and robust estimates even though the conditional returns are not normally distributed. This was tested by Zalewska-Mitura and Hall (1999). The authors show that the model is quite powerful in the detection of the time-varying efficiency in the case of the Kalman filter, except for a minimum number of observations at the beginning of the period.
4. Data and descriptive analysis
Our sample includes ten Islamic equity indices, namely: the DJIM Global Index, as well as its conventional counterparts, the DJIM Emerging Markets Index, the DJIM Arab Markets Index, the DJIM Arab Markets excluding Saudi Arabia Index, the DJIM GCC Index, the DJIM Canada Index, the DJIM UK Index, the DJIM US Index, the DJIM Europe index, the DJIM Asia-Pacific Index and the DJIM World Developed Index. The choice of DJIM indexes is justified by the fact that it is the most comprehensive and the most used representative index of Islamic stocks in view of the screening criteria, country and sector allocations.
We use daily frequency data expressed in US dollars, covering the period from January 1, 1996 to January 18, 2016 and extracted from DataStream wherein market returns are computed based on the log differences of the daily market price index. The sampling period covers major international events such as the Brother Lehman collapse (September 15, 2008) and the extreme market movements around the 2008–2009, GFC and the 2009–2012 Eurozone crisis (EZDC).
Table I summarizes descriptive statistics of the daily returns. First, the Jarque–Bera test confirms that market returns are significantly departed from normality. Second, market returns are stationary at the 1 percent confidence level, since the ADF calculated value is strictly below the critical threshold. Finally, the Engle’s (1982) test for conditional heteroskedasticity rejects the null hypothesis of no ARCH effect in daily returns which justifies the use of the GARCH specification with confidence.
Basic statistics of conventional and Islamic stock markets daily returns
| Mean (%) | SD (%) | Skewness | Kurtosis | Jarque–Bera | ADF Statistics | Q(6) | Q(12) | ARCH (12) | |
|---|---|---|---|---|---|---|---|---|---|
| Conventional markets | |||||||||
| Emerging markets | 0.008 | 1.209 | −0.534 | 10.595 | 12,820+++ | −56.651+++ | 319.34+++ | 332.61+++ | 158.794+++ |
| Arab markets | −0.021 | 1.207 | −1.580 | 20.443 | 36,322+++ | −47.897+++ | 51.547+++ | 54.404+++ | 38.395+++ |
| Arab markets excluding SA | −0.018 | 1.008 | −1.262 | 16.203 | 20,885+++ | −31.911+++ | 83.061+++ | 99.500+++ | 32.672+++ |
| GCC | −0.024 | 1.311 | −1.485 | 21.117 | 38,955+++ | −48.519+++ | 40.549+++ | 43.858+++ | 38.870+++ |
| Canada | 0.020 | 1.383 | −0.747 | 12.525 | 20,255+++ | −33.530+++ | 71.313+++ | 83.740+++ | 154.446+++ |
| UK | 0.006 | 1.311 | −0.136 | 11.590 | 16,094+++ | −35.529+++ | 67.687+++ | 85.929+++ | 157.583+++ |
| USA | 0.022 | 1.213 | −0.249 | 11.006 | 14,021+++ | −76.951+++ | 32.771+++ | 47.203+++ | 147.883+++ |
| Europe | 0.012 | 1.314 | −0.136 | 9.910 | 10,421+++ | −34.765+++ | 54.113+++ | 70.275+++ | 134.929+++ |
| Asia Pacific | −0.002 | 1.237 | −0.083 | 7.962 | 5,372+++ | −70.367+++ | 15.980++ | 21.013+ | 85.732+++ |
| World | 0.014 | 0.994 | −0.365 | 10.555 | 12,553+++ | −50.655+++ | 118.070+++ | 121.940+++ | 147.883+++ |
| Islamic markets | |||||||||
| Islamic emerging markets | 0.010 | 1.316 | −0.342 | 8.868 | 7,605+++ | −60.005+++ | 197.490+++ | 207.370+++ | 105.478+++ |
| Islamic developed markets | 0.021 | 1.028 | −0.352 | 9.865 | 10,379+++ | −50.670+++ | 119.790+++ | 123.300+++ | 183.306+++ |
| Islamic Canada | 0.013 | 1.741 | −0.808 | 13.335 | 23,846+++ | −33.417+++ | 64.351+++ | 73.346+++ | 102.446+++ |
| Islamic UK | 0.011 | 1.364 | −0.104 | 9.419 | 8,989+++ | −46.471+++ | 59.375+++ | 75.774+++ | 155.675+++ |
| Islamic USA | 0.026 | 1.252 | −0.133 | 9.608 | 9,531+++ | −54.751+++ | 28.799+++ | 39.086+++ | 131.507+++ |
| Islamic Europe | 0.018 | 1.320 | −0.055 | 9.623 | 9,560+++ | −34.958+++ | 54.697+++ | 71.307+++ | 143.841+++ |
| Islamic Asia pacific | 0.010 | 1.427 | −0.245 | 8.124 | 5,774+++ | −68.315+++ | 28.649+++ | 35.214+++ | 104.626+++ |
| Islamic world | 0.021 | 1.028 | −0.352 | 9.865 | 10,379+++ | −50.670+++ | 119.790+++ | 123.300+++ | 183.306+++ |
Notes: The table presents basic statistics of daily returns. Q (6) and Q (12) are statistics of the Ljung-Box autocorrelation test applied on returns with lags between 6 and 12. ARCH (12) is the statistics of the conditional heteroskedasticity test proposed by Engle (1982) using the residuals of the AR (1) model. ADF is the statistics of the ADF unit root test proposed by Dickey and Fuller (1981). The ADF test is conducted without time trend or constant. +,++,+++Denote that the null hypothesis of tests (no-autocorrelation, normality, no-stationarity and homogeneity) are rejected at, respectively, 10, 5 and 1 percent levels. The study period is from January 1, 1996 to January 18, 2016
5. Empirical results and discussion
5.1 Empirical results
Our primary objective consists in comparing the performance of Islamic and conventional stock indices in terms of risk.
Table II presents empirical results of the standard GARCH parameters estimation along with a detailed descriptive analysis of volatility series. We note that the parameters of the conditional variance equation, for all markets, are positive and statistically significant at 1 percent and then satisfy conditions of theoretical stability . Moreover, persistence of the conditional volatility is verified, in so far as the risk premium is close to one. Diagnostics of standardized residuals (Tables III and IV, part II) suggest that the standard GARCH(1,1) specification seems to be adequate to explain variations of the stock returns, since the residuals and squared residuals are not serially correlated. In addition, we note the absence of ARCH effect among residual series.
Diagnostic tests for conditional volatility – conventional stock markets
| Emerging markets | Arab markets | Arab markets excluding SA | GCC | Canada | UK | USA | Europe | Asia Pacific | World | |
|---|---|---|---|---|---|---|---|---|---|---|
| Panel I: basic statistics of conditional volatility | ||||||||||
| Mean (%) | 0.014 | 0.015 | 0.011 | 0.019 | 0.02 | 0.017 | 0.015 | 0.018 | 0.016 | 0.010 |
| SD (%) | 0.022 | 0.021 | 0.014 | 0.028 | 0.033 | 0.026 | 0.022 | 0.025 | 0.017 | 0.015 |
| Minimum | 0.00002 | 0.00002 | 0.00002 | 0.00002 | 0.00002 | 0.00002 | 0.00003 | 0.00002 | 0.00003 | 0.00001 |
| Maximum | 0.00315 | 0.00196 | 0.00144 | 0.00248 | 0.00387 | 0.00356 | 0.00279 | 0.00294 | 0.00239 | 0.00192 |
| Jarque–Bera | 129,9960+++ | 32,100+++ | 55,944+++ | 32,589+++ | 77,4702+++ | 883,563+++ | 601,178+++ | 458,176+++ | 552,367+++ | 697,481+++ |
| ADF test | −6.986+++ | −5.595+++ | −5.417+++ | −5.357+++ | −7.477+++ | −6.618+++ | −6.718+++ | −6.451+++ | −7.654+++ | −6.895+++ |
| Q(12) | 51,162+++ | 24,251+++ | 24,737+++ | 24,936+++ | 56,303+++ | 53,564+++ | 53,001+++ | 53,525+++ | 48,827+++ | 54,441+++ |
| Panel II: diagnostic of standardized residuals | ||||||||||
| Mean | −0.040 | −0.074 | −0.053 | −0.068 | −0.031 | −0.036 | −0.039 | −0.038 | −0.029 | −0.035 |
| SD | 0.999 | 0.998 | 0.999 | 0.998 | 0.999 | 0.999 | 1.000 | 0.999 | 0.999 | 1.000 |
| Minimum | −5.287 | −9.045 | −6.749 | −9.061 | −8.313 | −5.583 | −6.486 | −6.025 | −4.848 | −5.624 |
| Maximum | 4.024 | 10.319 | 5.577 | 4.766 | 3.911 | 4.776 | 3.381 | 3.870 | 5.217 | 3.698 |
| Skewness | −0.337 | −0.937 | −0.847 | −1.494 | −0.460 | −0.219 | −0.470 | −0.254 | −0.235 | −0.308 |
| Kurtosis | 4.211 | 17.910 | 8.673 | 15.400 | 4.951 | 3.930 | 4.666 | 3.867 | 4.072 | 4.111 |
| Jarque–Bera | 418.312+++ | 26,092.780+++ | 4,049.758+++ | 18,796.860+++ | 1,013.433+++ | 229.935+++ | 797.555+++ | 220.022+++ | 298.350+++ | 351.403+++ |
| Q(12) | 22.695++ | 33.257+++ | 58.600+++ | 28.929+++ | 6.411 | 14.997 | 12.768 | 11.440 | 9.763 | 11.191 |
| Q2(12) | 9.713 | 11.011 | 13.625 | 10.991 | 5.003 | 11.420 | 20.204+ | 18.019 | 12.742 | 13.324 |
| ARCH(12) test | 9.702 | 11.154 | 13.284 | 10.684 | 5.035 | 11.264 | 20.117+ | 18.263 | 12.589 | 13.978 |
Notes: +,++,+++Indicate that the null hypothesis of statistical tests (no-autocorrelation, normality, homogeneity and no-stationary under the ADF test) is rejected, respectively, at 10, 5 and 1 percent levels
Diagnostic tests for conditional volatility – Islamic stock markets
| Islamic emerging markets | Islamic developed markets | Islamic Canada | Islamic UK | Islamic USA | Islamic Europe | Islamic Asia pacific | Islamic world | |
|---|---|---|---|---|---|---|---|---|
| Panel I: basic statistics of conditional volatility | ||||||||
| Mean (%) | 0.017 | 0.010 | 0.031 | 0.019 | 0.016 | 0.018 | 0.016 | 0.010 |
| SD (%) | 0.021 | 0.015 | 0.049 | 0.024 | 0.021 | 0.024 | 0.018 | 0.015 |
| Minimum | 0.00002 | 0.00002 | 0.00004 | 0.00002 | 0.00003 | 0.00002 | 0.00002 | 0.00002 |
| Maximum | 0.00289 | 0.00201 | 0.00536 | 0.00292 | 0.00270 | 0.00302 | 0.00245 | 0.00201 |
| Jarque–Bera | 384,073+++ | 875,209+++ | 455,451+++ | 564,143+++ | 581,823+++ | 563,104+++ | 624,536+++ | 875,209+++ |
| ADF test | −8.616+++ | −6.822+++ | −5.218+++ | −6.761+++ | −6.398+++ | −6.873+++ | −7.535+++ | −6.822+++ |
| Q(12) | 47,400+++ | 53,428+++ | 56,383+++ | 55,245+++ | 51.132+++ | 54,596+++ | 50,885+++ | 53,428+++ |
| Panel II: diagnostic of standardized residuals | ||||||||
| Mean | −0.033 | −0.035 | −0.026 | −0.036 | −0.039 | −0.032 | −0.025 | −0.035 |
| SD | 0.999 | 1.000 | 0.999 | 0.999 | 1.000 | 0.999 | 0.999 | 1.000 |
| Minimum | −5.082 | −5.869 | −7.887 | −5.583 | −6.486 | −5.973 | −5.142 | −5.624 |
| Maximum | 4.302 | 3.946 | 4.379 | 4.776 | 3.381 | 4.225 | 4.979 | 3.698 |
| Skewness | −0.272 | −0.312 | −0.536 | −0.219 | −0.470 | −0.245 | −0.270 | −0.308 |
| Kurtosis | 4.060 | 4.169 | 5.421 | 3.930 | 4.666 | 3.850 | 4.061 | 4.111 |
| Jarque–Bera | 309.376+++ | 382.266+++ | 1,527.367+++ | 229.935+++ | 797.555+++ | 209.727+++ | 309.079+++ | 351.403+++ |
| Q(12) | 12.544 | 10.504 | 9.388 | 15.543 | 12.037 | 10.594 | 13.791 | 10.504 |
| Q2(12) | 20.151 | 16.553 | 4.536 | 15.801 | 17.010 | 19.477+ | 12.917 | 20.595+ |
| ARCH(12) test | 20.866 | 16.897 | 4.557 | 15.706 | 17.378 | 19.341+ | 12.876 | 20.897+ |
Notes: +,+++Indicate that the null hypothesis of statistical tests (no-autocorrelation, normality, homogeneity and no-stationary under the ADF test) is rejected, respectively, at 10 and 1 percent levels
In order to compare the extent of stock markets conditional volatility, we present, in Tables III and IV (part I) a summary of some descriptive statistics. We observe, first, that Islamic stock indexes are more volatile than their conventional counterparts (see Figure 1 as well), and second, conventional wisdom of “high risk, high returns” is also verified to Islamic stock indexes, where markets with higher returns exhibit high volatility.
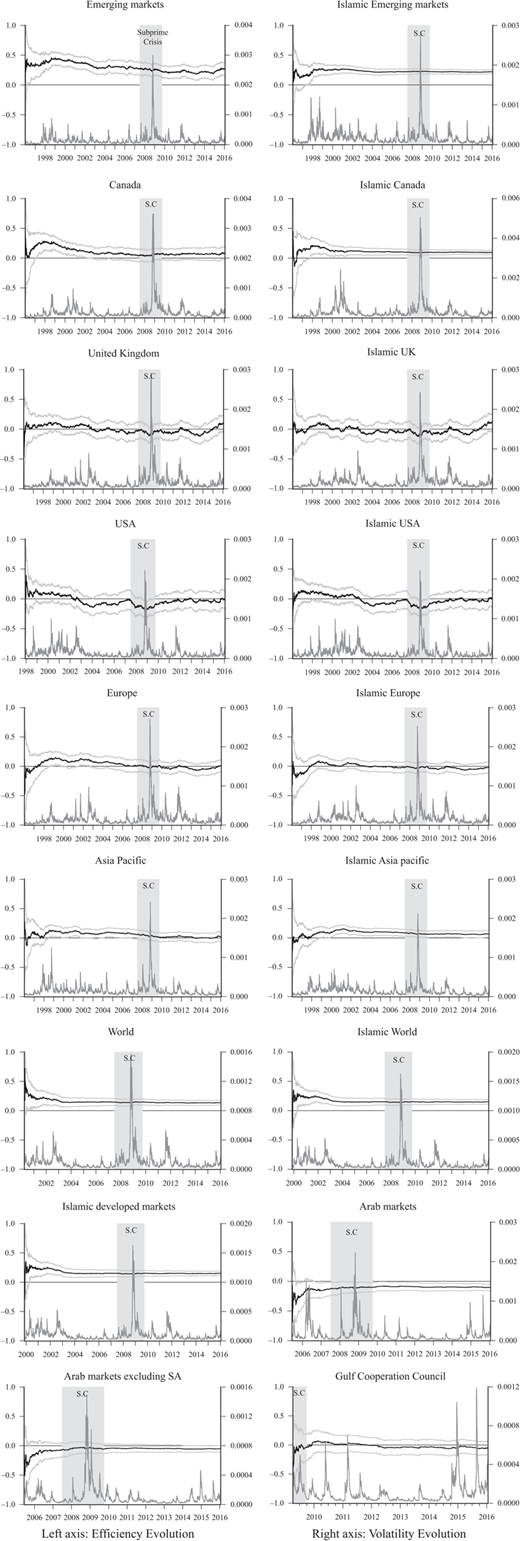
Evolving efficiency and volatility in conventional and Islamic stock markets, time-varying predictability index with 95% confidence intervals
Evolving efficiency and volatility in conventional and Islamic stock markets, time-varying predictability index with 95% confidence intervals
The analysis of the structural break dates (Table V) shows, first, a strong interdependence between the various stock indexes. Second, we can remark a significant impact of the last subprime crisis on the volatility of both conventional and Islamic markets in so far as the structural break dates coincide with the financial crisis period. So, we conclude that, arguably, the Islamic stock indexes as their conventional counterparts are not fully immunized against the effects of crisis.
Empirical results of Bai and Perron’s (1998, 2003) test, number and date of structural breaks (ε=0.05)
| Conventional stock markets | |||||||||
| Emerging markets | Arab markets | Arab markets excluding SA | GCC | Canada | UK | USA | Europe | Asia pacific | World |
| 6 | 4 | 5 | 4 | 7 | 6 | 10 | 8 | 9 | 8 |
| July 25, 2007 | January 21, 2008 | January 3, 2007 | January 3, 2007 | February 25, 2003 | April 29, 2003 | April 14, 2003 | April 17, 2003 | April 17, 2003 | April 30, 2003 |
| September 13, 2007 | August 25, 2009 | August 7, 2008 | August 7, 2008 | April 2, 2003 | July 26, 2007 | June 5, 2003 | June 25, 2003 | January 18, 2008 | July 25, 2003 |
| March 25, 2008 | November 13, 2011 | March 12, 2010 | March 12, 2010 | November 9, 2007 | October 15, 2007 | September 12, 2003 | January 18, 2008 | February 22, 2008 | July 26, 2007 |
| February 16, 2009 | June 13, 2014 | October 17, 2011 | June 13, 2014 | December 26, 2007 | February 5, 2008 | July 24, 2007 | July 11, 2008 | September 11, 2008 | October 12, 2007 |
| October 26, 2009 | May 19, 2014 | July 11, 2008 | October 27, 2009 | September 18, 2007 | September 12, 2008 | December 25, 2008 | December 4, 2008 | ||
| January 24, 2012 | February 10, 2010 | August 8, 2012 | June 3, 2008 | January 16, 2009 | January 1, 2009 | May 18, 2009 | |||
| August 10, 2012 | December 4, 2008 | June 11, 2010 | June 14, 2010 | October 27, 2009 | |||||
| June 17, 2009 | September 12, 2012 | August 12, 2010 | January 27, 2012 | ||||||
| October 23, 2009 | September 13, 2013 | ||||||||
| January 25, 2012 | |||||||||
| Islamic stock markets | |||||||||
| Islamic emerging markets | Islamic developed markets | Islamic Canada | Islamic UK | Islamic USA | Islamic Europe | Islamic Asia pacific | Islamic world | ||
| 7 | 4 | 5 | 6 | 8 | 6 | 6 | 7 | ||
| May 13, 2003 | April 15, 2003 | April 2, 2003 | April 18, 2003 | April 4, 2003 | April 18, 2003 | May 2, 2003 | April 15, 2003 | ||
| July 25, 2007 | July 26, 2007 | February 11, 2007 | July 16, 2007 | August 18, 2003 | July 26, 2007 | August 22, 2003 | August 22, 2003 | ||
| September 12, 2007 | October 27, 2009 | November 12, 2007 | September 13, 2007 | July 24, 2007 | September 13, 2007 | July 27, 2007 | July 26, 2007 | ||
| December 25, 2007 | January 27, 2012 | December 18, 2007 | January 1, 2008 | September 18, 2007 | January 1, 2008 | October 26, 2007 | September 12, 2007 | ||
| February 5, 2008 | August 14, 2012 | October 27, 2009 | January 11, 2008 | October 27, 2009 | October 28, 2009 | December 3, 2007 | |||
| October 27, 2009 | August 10, 2012 | April 2, 2009 | August 9, 2012 | January 30, 2012 | October 27, 2009 | ||||
| August 8, 2012 | October 23, 2009 | October 27, 2012 | |||||||
| January 25, 2012 | |||||||||
Notes: This table reports the structural breaks identified in the volatility series of various conventional and Islamic stock markets generated from the standard GARCH model. We sequentially test the hypothesis of l breaks vs l+1 breaks, employing the Sup FT (l+1/l) statics
In terms of the time-varying informational efficiency, reading the estimation results of the state space model, Table II, shows that the mean of coefficient is usually very close to zero, which shows that past returns do not help for price discovery on both Islamic and conventional equity markets. A thorough reading of the findings makes it possible to notice that the average values of coefficients, in Equation (4), are close to zero and listed in the interval (0.006 percent; 0.081 percent) for conventional stock markets and in the interval (0.001 percent; 0.027 percent) for Islamic stock markets. This suggests a low level of returns predictability along with the implications of other potential factors, such as macroeconomic effects, political events and external shocks (Arouri and Nguyen, 2010). As regards to the coefficients, which tell about the time-varying predictability (autocorrelation) of stock returns, their averages are not very different across markets and stand around an average of 8.95 percent for conventional stock markets and 8.73 percent for Islamic stock markets. This evidence supports the hypothesis that past and future returns are serially independent, except for the conventional and Islamic emerging stock markets, the conventional Arab markets and the global market that recorded usually very high coefficients, indicating that past returns predict about 14 percent of the current returns dynamics. In light of these results, it is obvious to note that the hypothesis of weak efficiency is well verified in the Islamic context compared to the conventional one. Indeed, we note that the average coefficient of the time-varying predictability is consistently lower in the case of Islamic stock markets than in case of conventional stock markets. So, we conclude that Islamic stock markets are relatively more efficient than their conventional counterparts.
Finally, regarding the global significance of the two coefficients , we find out a relative stability through time given the lower estimated values of variance issued from the state equations (Equation 7). Moreover, it seems that the GARCH (1,1) model performs well to enlighten variations of the conventional and Islamic stock returns since it detects the leptokurtic behavior and the conditional heteroscedasticity in the returns. Indeed, parameters of the conditional variance equation are positive, statistically significant at the 1 percent level and then satisfy conditions of theoretical stability .
In order to test the hypothesis of weak efficiency before and after the last subprime crisis and around financial instability periods, it seems important to report the evolution of the time-varying predictability indices with 95% confidence intervals, while taking into account volatility dynamics. The analysis of predictability index is based on the following reasoning: the hypothesis of weak efficiency is verified if the evolution is not significantly different from zero. A negative effect of a financial fragility/crisis on the efficiency is explained by the increase of return predictability level during or just after an increase in volatility. Even though the market was not efficient before the volatility shock, the negative effect results in a decline of the efficiency degree in the period which follows the volatility shock. Figure 1 shows the evolution of both time-varying predictability indices with 95% confidence intervals and the volatility dynamics.
From Figure 1, we make some general comments for all stock markets and specific comments inside groups that are identified based on the degree of efficiency. First, as noted by Zalewska-Mitura and Hall (1999), at start, observations arising from the application of the Kalman filter are too volatile. Second, we make out three groups of markets according to their degrees of informational efficiency. The first group includes three conventional stock markets (UK, USA and GCC) and two Islamic stock markets (Islamic UK and Islamic USA), describe efficiency over the entire period of study. Indeed, the zero line is located within the estimated confidence interval which leads to accept the null hypothesis of efficiency. The second group contains markets which are characterized by the inefficiency on several sub-periods at the beginning and the middle of the period, but gradually converge toward efficiency at the end, since the associated autocorrelation coefficients decline steadily over time, and are very close to zero. This group includes four conventional stock markets (Canada, Europe, Asia Pacific and the index of Arab markets excluding KSA) and three Islamic markets (Islamic Canada, Islamic Europe and Islamic Asia Pacific). The third and last group that is controversy to the previous groups, involving six markets, including three conventional (emerging markets, world and Arab markets) and three Islamic (Islamic Emerging markets, Islamic World and Islamic developed markets). These markets show absolute inefficiency for the entire period or efficiency for short period at start but prove an increasing inefficiency later.
Moreover, we can notice that the degree of efficiency varies from one market to another, which leads us to suppose that specific attributes of each market, such as the liquidity and development level may explain the different degree of efficiency between markets. This fact is also mentioned by Arouri and Nguyen (2010) and Fontaine and Nguyen (2006). Indeed, the lack of liquidity slows down the incorporation of available information in the stock price and in then delays the convergence process to efficiency.
At last, we note that numerous changes in the trend of the time-varying predictability are realized at time of financial crisis and at the financial fragility periods where one can notice a weakening of the informational efficiency degree on both conventional and Islamic markets. To summarize, we deduce that the weak efficiency hypothesis is relatively verified in the Islamic context than in the conventional one. But it varies from one market to another depending on the specific characteristics of each market. Additionally, we conclude that Islamic markets are not fully immunized against the effects of financial crises and the strong financial fragilities.
Generally, our findings are in line with those of Hassan (2004), Albaity and Ahmad (2008), Atta (2000) and Hussein and Omran (2005) who found that the Dow Jones Islamic index is more risky and more efficient than the conventional counterpart. However, our results contrast with those of Guyot (2011) and El khamlichi et al. (2014) who found that Islamic indices from the Dow Jones family present the same level of efficiency than conventional indices.
5.2 Discussions
During the last two decades, Islamic markets attracted much attention of national and international investors due to their specific character which comply with Shariah principles. Indeed, funding arrangements specifically based on the mechanism of murabaha and musharakah are supposed to encourage economic development through the success of committed projects (Bala and Zaha, 2009). These markets are held, more than conventional markets, to be more performing (in terms of volatility more efficiency) able to effectively and healthily finance economic growth, but also especially able to correct speculative bubbles. This is, unfortunately, not always check because of the disjunction of most of the stock markets.
According to our empirical analysis, it has been identified initially that Islamic markets are more volatile than their conventional counterparts. Indeed, in a global analysis context of risk tolerance and without taking into consideration the concept of profitability, relatively risk averse investor is not interested in depositing funds on these markets. This seems paradoxical on at least two ways: first, the screening criterion applied during the selection process of the Islamic equity indexes should exclude a portion of the riskiest companies as having high interest ratios. Furthermore, the use of conventional return measures does not allow concluding to a significant difference of performance between Islamic and conventional stock indexes. Indeed, Islamic stock indexes benefiting by an additional return linked to a higher risk of under-diversification than conventional indices. In our view, the high volatility of Islamic indices and the presence of a strong interdependence between conventional and Islamic markets, on the one hand, and among Islamic markets, on the other hand, in times of financial fragility, reduced investor interest to Islamic equities.
In addition and with reference to our empirical analysis of the informational efficiency, results show that Islamic stock markets are more efficient than their conventional counterparts in term of weak efficiency. Therefore, we can conclude that regulators of these markets have relatively succeeded in establishing a favorable investment environment since the informational efficiency will eventually enhance the market operational efficiencies and liquidity on these markets. The final outcome is undoubtedly the strengthening of a sustainable economic growth. However, the efficiency degree of these markets varies over time, especially in times of financial crisis and financial fragility. So, the regulators of these markets must always think about pushing the convergence to efficiency, they should consider the initial conditions of the domestic markets and keep the supervision of these conditions over time and especially during the high financial fragility and crisis periods. According to Nguyen (2008) and Fontaine and Nguyen (2006), market conditions include, among others, the quality and reliability of information flows, the financial market infrastructure and the sophistication of investors. A good control of this factor helps to significantly reduce the asymmetries that can benefit the informed agents and which involve the manipulation and the loss of investors’ confidence. To enhance the sophistication of investors, training on the characteristics of financial instruments and on the relationship between risk and return, as well as portfolio management are needed. This will reduce the benefits of insiders and professional investors. In addition, the implementation of regulations in favor of ownership and the protection of minor investors are also desirable to establish the trust of market participants and prevent the losses due to fraud and manipulation.
In summary, it should be noted that investors should enjoy benefit offered by Islamic stock markets in terms of informational efficiency. Indeed, from the diversification perspective, an institutional investor should consider the possibility of allocating a proportion of its assets to Islamic equities. This helps to strengthen investment on these markets and the development of economic growth. However, it is desirable to favor certain additional measures in a preventive perspective against financial instability risks in order to avoid the high volatility level on these markets.
6. Conclusion
Risk and informational efficiency are two concepts of particular importance, reflecting the effectiveness of investment decisions on equity markets. Recently, the finance literature has focused on the analysis of the performance of conventional equity indices in comparison with their Islamic counterparts.
This paper joins the literature to explore the degree of performance associated with both conventional and Islamic markets through a measure of both conditional volatility and informational efficiency across these markets. Furthermore, we sought to analyze the interdependencies between conventional and Islamic markets during the high financial fragility and the last subprime crisis periods.
The empirical strategy is, first, to measure the conditional volatility of all conventional and Islamic markets and analyze its evolution over time. To do this, we adopted a standard GARCH specification, which has always proved a higher pertinence to measure volatility, especially for high-frequency data. Then, to examine the interdependence in terms of volatility we used the Bai-Perron’s (1998, 2003) structural breaks test. This test is of great importance in so far as it allows determining the high financial fragility periods. Finally, we focused on modeling the weak efficiency while taking into account the dynamics of stock markets. Indeed, the weak efficiency has been considered as evolving over time unlike traditional methods.
Empirical results show that Islamic stock markets are more volatile than their conventional counterparts. Indeed, over the period of study, Islamic Indices exhibit greater degree of risk compared to conventional indices. It seems that Islamic Indices benefit from an additional return linked to a higher risk of under-diversification than the conventional indices. Likewise, we reached to a strong interdependence between markets within each type of index and also between the conventional and Islamic stock markets, especially during the subprime crisis. This shows that the crisis effects are quite transmissible between both stock markets and that even Islamic stock markets are not fully immunized against those effects. Finally, the empirical results show that past returns do not help predict future returns on both conventional and Islamic stock markets. Likewise, we notice that, the efficiency degree varies from one market to another, which leads us to believe that the specific characteristics of each market, including the liquidity and the development level may explain the difference in the level of efficiency between markets.
As regards of the comparison between conventional and Islamic stock markets in terms of efficiency, we note that the weak efficiency hypothesis is well verified in the Islamic context than in the conventional context. So, we can conclude that Islamic stock markets are relatively more efficient in terms of informational efficiency than their conventional counterparts. Moreover, due to the existence of deteriorating changes in the time-varying predictability index of all Islamic stock markets in times of financial crisis, we can conclude that Islamic markets are not fully immunized against effects of financial crisis and the strong financial fragilities.
To conclude, our results suggest that the behavior of DJIM indices do not robustly differ from their conventional counterparts, with indices outperforming their conventional competitors in terms of informational efficiency while others are less effective in term of volatility level. As demonstrated that Islamic stock markets are vulnerable to global financial shocks, it is important that policy makers should take preventive measures in order to minimize the effects of crisis and ensure the stability of Islamic stock markets during economic and financial uncertainty periods. Our empirical results point out that the general belief that the Islamic financial markets are immune from the negative impact of financial shocks because of its nature without interest is flawed. For which it is important that stakeholders, policy makers and even academics and Sharias researchers must work together to endow Islamic financial markets with appropriate techniques and tools in order to mitigate the impact of financial shocks on Islamic markets. The results of this study highlight the urgency of these initiatives. Indeed, prudent risk management and best financial practices are relevant and crucial for both Islamic and conventional financial markets.
Notes
For the sake of concision, the test results are not reported here, but they are available under request addressed to the corresponding author.
In Monte Carlo experiments, Bai and Perron (2006) find that the method of Bai and Perron (1998) is powerful enough to detect structural breaks.
For a comprehensive review of theoretical and empirical evidence on market efficiency, interested readers are invited to consult the works of Fama (1970, 1998), Dimson and Moussavian (1998) and Lim and Brooks (2010).
The optimization is carried out in GAUSS using the BFGS algorithm (Broyden, Fletcher, Goldfarb and Shanno).

