
This paper aims to study employee mental health in relation to workplace design and indoor environmental quality (IEQ) when working from home, which has received little attention. The trend toward hybrid working urges for more knowledge.
Through a mixed data collection method, this study analyzed potential relationships (between mental health, workplace design and IEQ) from information obtained through a cross-sectional survey, repeated point-in-time surveys and desk-based IEQ sensors at home. Data were collected in April 2020 during a national COVID-19 lockdown in The Netherlands amongst 36 subjects. They all worked full time from home in this period and together completed 321 point-in-time surveys. The three data sets were combined and analyzed using bivariate and path analysis.
Outcomes indicate that subjective and objective IEQ conditions, workplace suitability and distraction affect employee mental health in the home workplace in a similar way as in the office. Being satisfied with the noise level increases concentration, self-reported well-being and engagement. High sound pressure levels (>58 dB) increased tension or nervous feelings.
To the best of the authors’ knowledge, this study is one of the first to explore employee mental health in relation to simultaneously assessed (perceived and measured) multiple IEQ parameters in the home workplace.
1. Introduction
The influence of the indoor environmental quality (IEQ; air quality, thermal comfort, lighting and noise) on humans is evident and often associated with health outcomes. However, while physical health in relation to the workplace is commonly studied, mental health in the context of the (physical) workplace remains underexposed. Previous studies in offices have shown significant relations between IEQ conditions and perceptions (Mujan et al., 2019) and between IEQ conditions/perceptions and satisfaction and productivity (Geng et al., 2017). However, since COVID-19 induced hybrid working, the workplace at home has become more relevant too and is becoming “officized” (Cole et al., 2014). But although working arrangements have become more flexible over the past two decades, relatively little research outcomes are available on the effects of home-based working, related to, e.g. (mental) health and productivity (Arntz et al., 2019).
So far, studies have largely neglected IEQ conditions at home, while researchers warn about a chance of increased sick building syndrome issues due to forced teleworking (Hosseini et al., 2020), and that IEQ is relevant at home as well (Fan Ng, 2010). In addition, very little attention has been paid to (perceived) mental health issues related to teleworking. Mostly more straightforwardly measurable design aspects of the home environment have been studied in relation to mental health, such as outside view and apartment size (Amerio et al., 2020) and floor level, noise and indoor air pollutants (Beemer et al., 2021). Also, it is known that home workplace suitability is essential for employee productivity (Nakrošienė et al., 2019) and that perhaps different workplace aspects should be emphasized at home than in the office (Kojo and Nenonen, 2015). Therefore, the objective of this research was to identify relationships between measured (objective) IEQ conditions, its perception, workplace suitability and employee mental health, while working from home.
2. Conceptual model
Bergefurt et al. (2022) identified ten employee mental health concepts in relation to workplace quality: stress, fatigue, sleep quality, concentration, productivity, engagement, mental well-being, emotional exhaustion, depression and mood, indicating that mental health at work is a complex system of relationships between these concepts. This section discusses how these health indicators are influenced by other variables relating to IEQ conditions, personal characteristics and the home workplace.
2.1 Effects of indoor environmental quality conditions
IEQ is defined as “the condition of the inside of a building” (Choi and Lee, 2018, p. 591). Due to the scarcity of information on home workplace IEQ conditions in relation to mental health (including personal characteristics), relevant literature related to healthy office environments was reviewed to formulate hypotheses. First, thermal comfort (Geng et al., 2017) and indoor air quality (IAQ) have a significant joint influence on productivity (Nematchoua et al., 2019). Higher CO2 concentrations, as a proxy for IAQ, are associated with an increase of acute health symptoms (Erdmann and apte, 2004), increased sick leave (Schendell et al., 2004), psychosocial stress (Carrer and Wolkoff, 2018) and a reduction in decision-making performance (Schendell et al., 2004). Workplace lighting relates to productivity (Eklund and Boyce, 1996), work engagement (Veitch et al., 2013), concentration, depression and mood (Van Duijnhoven et al., 2019) and sleep quality and overall mental well-being (Boubekri et al., 2014). Finally, the sound pressure level relates to distraction (Delle Macchie et al., 2018), productivity and concentration (Mak and Lui, 2012). Lee et al. (2016) found that noise disturbance affects self-rated fatigue and depression. Besides relationships between IEQ and the mental health concepts, amongst others, Park et al. (2018) have shown that objective IEQ conditions and their subjective experience correlate. So, the following hypotheses are posed:
IEQ conditions at home impact employee mental health concepts.
Objective IEQ conditions at home impact subjective IEQ conditions at home.
2.2 Personal characteristics
According to Schellen et al. (2012), age and gender need to be included as control variables. Males and females experience the office environment differently (Kim et al., 2013). In addition, Haynes et al. (2017) showed that personality can lead to differing workplace needs. So, the following hypothesis is posed:
Personal characteristics impact subjective IEQ conditions at home.
Personal characteristics are related to mental health too. For example, household composition (presence of young children) affects the mental state of parents (Murray et al., 2003). Also, the relationship between mental illness and personality is very strong (Halpern, 1995). Work-related personal characteristics play a role too. For example, Bannai and Tamakoshi (2014) found that the risk of developing symptoms of depression increases when working more hours per day/week (workload). Additionally, work overload has a strong relation with exhaustion (Demerouti et al., 2010). Bodin Danielsson (2008) also controlled for job rank. As a result, the following hypothesis is posed:
Personal characteristics impact employee mental health at home.
2.3 Workplace at home
Not all home situations are pleasant to work in and not everybody can choose freely where to work at home. Nakrošienė et al. (2019) showed that one of the most important aspects to assure productivity when working from home was the suitability of the home workplace. Poor housing design (outside view and apartment size) is also known to relate to depressive symptoms (Amerio et al., 2020). In addition, distractions at home due to noise can impair mental health (Di Blasio et al., 2019). COVID-19 studies (Xiao et al., 2021) show that perceived mental health decreased while working from home, and that workplace design characteristics influence IEQ experiences. So, the following hypotheses are posed:
Home workplace characteristics impact employee mental health concepts.
Home workplace characteristics impact subjective IEQ conditions.
Based on the hypotheses, the conceptual model has been designed (Figure 1).
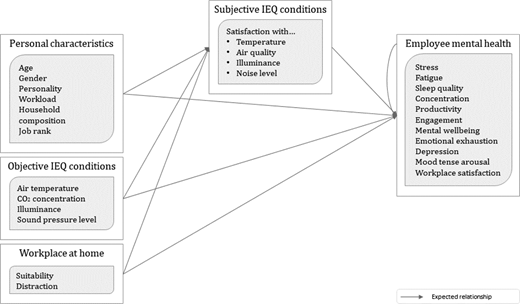
Derived conceptual model that connects mental health concepts to relevant parameters
Derived conceptual model that connects mental health concepts to relevant parameters
3. Method
Because of the many subjectively experienced variables, a survey combined with IEQ sensor measurements was chosen most suitable to test the hypotheses. To capture the ten mental health indicators, (parts of) existing scales have been used (Table 1). For the subjective IEQ conditions, each respondent was asked to evaluate in general, how satisfied they were with the temperature, the overall air quality, the noise level and the illuminance at their home workspace. IEQ conditions were measured with spot measurements from wireless sensors (Elsys ERS CO2 sensor + Elsys ERS Sound sensor) placed on the desk at home, similar to previous office IEQ studies (Candido et al., 2019). These measured temperature, relative humidity, illuminance, carbon dioxide level and sound pressure. Workplace suitability was asked with four statements: the ability to work in a pleasant way and the freedom of choosing in which room people worked at home (Nakrošienė et al., 2019), the ability to concentrate and one’s productivity compared to a regular day at the office. Distraction was measured through six questions on frequency of experiencing certain distractive factors.
Employee mental health concept composition
| Employee mental health concept | Metric and source |
|---|---|
| Stress and depression | Patient Health Questionnaire – PHQ-4 (Kroenke et al., 2009; Beute and De Kort, 2018) |
| Fatigue and concentration | Check List individual Strength – CIS (Vercoulen et al., 1994) |
| Sleep quality | Sleep Quality Scale (Snyder et al., 2018; WHO, 2020) |
| Productivity and mental well-being | Health at Work survey by WHO (2020) |
| Engagement and emotional exhaustion | Oldenburg Burnout Inventory – OLBI (Demerouti et al., 2010) |
| Mood (tense arousal) | Mood adjective checklist – UWIST (Matthews et al., 1990) |
Age and gender were operationalized according to Snyder et al. (2018). For household composition, a slightly adapted question from the CBS WoON survey was used (CBS, 2020) and for job rank the scale from Appel-Meulenbroek et al. (2020). For personality, the BFI-10 by Rammstedt and John (2007) was applied. For workload, both contracted formal hours/week and frequency of having the feeling that the work could be completed within those formal hours was questioned (WHO, 2020).
In addition to the one-time survey, participants were also queried through experience sampling on those mental health indicators that fluctuate a lot during a week (productivity, concentration and mood). This captured Point in Time (PiT) data on subjective IEQ perceptions and momentary mental health and allowed to compare them with the momentary objective IEQ ratings from the sensors.
Data was collected amongst 36 participants from a Dutch consulting firm, spread equally over two consecutive periods of five workdays in April 2020. For the PiT-survey, participants were prompted by messages on their mobile phone twice a day. The sensors generated a datapoint every 5 min. All participants completed the mental health (MH) survey at the end of their measuring period. The research design was approved by the ethical board of the authors’ University, number ERB2020BE5.
The MH and PiT surveys were connected through a pseudonym provided by the participant. Next, the subjective survey data was combined with the IEQ measurements. The sensor data was matched to the surveys through the timestamps of the surveys and the sensors. Measured data was averaged over intervals of 15, 30 and 60 min prior to the moment the PiT survey was completed. First, bivariate analyses were used to test whether a pair of variables was significantly related. Next, path analysis was conducted, as it enables simultaneously testing for positive or negative effects within the entire conceptual model. Only significant variables from the bivariate analyses were included in the path analysis. As the underlying technique of path analysis is multiple regression, the objective IEQ variables were recoded to dummy variables. Categories were recoded and merged for most personal characteristics given the small sample size.
4. Results
4.1 Descriptive statistics
The sample population was relatively young (Table 2). In general, respondents mostly lived without children, had a junior or medior job rank, formally worked 40 h and were able to finish work in these formal hours most days. Respondents indicated to be extravert, open, disagreeable and conscientious. The ability to work at home (Cronbach’s α = 0.769) scored a mean of 3.29 (SD = 0.98) on a five-point scale. Distraction at home scored lower, with 2.30 (SD = 0.68) on a four-point scale. Both the momentary satisfaction (PiT) and the overall satisfaction (MH) with the subjective IEQ conditions were rated “satisfied” or “very satisfied” by more than half of the participants on all parameters during the measuring period. The noise level was indicated as the main dissatisfier in both surveys, while the illuminance was assessed most positively.
Summary of outcomes for the personal characteristics
| Variable | Categories | N |
|---|---|---|
| Gender | Female | 23 |
| Male | 13 | |
| Formal hours | 32 | 6 |
| 36 | 7 | |
| 40 | 23 | |
| Age | 20–29 | 18 |
| 30–39 | 14 | |
| 45+ | 4 | |
| Household composition | Living single or together without children | 28 |
| Living together with children | 8 | |
| Job rank | Junior | 13 |
| Medior | 14 | |
| Senior | 5 | |
| Other | 4 | |
| Workload | Not at all | 3 |
| (=ability to finish work in formal hours) | Several days | 10 |
| More than half the days | 2 | |
| Nearly every day | 21 |
The sensor data (Table 3) show average sound pressure levels below 46 decibel which complies with the highest office standards. Based on the average carbon dioxide level measured (approximately 800 ppm), the air quality would be labeled as high to medium according to EN 13779 (CEN, 2007). For illuminance, differences between the two measuring periods were found. The first period complies with the illuminance threshold when performing office activities (>500 lux) following EN 12464–1 (CEN, 2002), but in the second period, the average illuminance was as low as 342 lux. The average temperatures appeared within normal ranges, around 20–22°C. However, from the maximum temperature recorded in Period 2 (37.2°C), one may notice that outliers were present. This, most probably, resulted from the fact that the sensor was exposed to the sun in such a situation. Reviewing weather conditions for both measuring periods (KNMI, 2020), no noteworthy differences were identified.
Objective IEQ conditions between 08:00 and 18:00 mean per measuring period
| Period 1 | Period 2 | |||||||||
|---|---|---|---|---|---|---|---|---|---|---|
| IEQ condition | N | Min | Max | Mean | SD | N | Min | Max | Mean | SD |
| Objective IEQ conditions (between 08:00 and 18:00) | ||||||||||
| air temperature [Co] (SENtemp) | 19,070 | 13.6 | 25.2 | 20.0 | 2.0 | 22,104* | 13.7 | 37.2 | 21.4 | 2.2 |
| CO2-concentration [ppm] (SENCO2) | 8,987 | 362 | 2,568 | 790 | 337 | 10,306 | 372 | 3,240 | 855 | 421 |
| illuminance [lux] (SENLight) | 19,070 | 0 | 2,340 | 710 | 685 | 22,105 | 0 | 2,327 | 342 | 501 |
| SPL_avg [dB] (SENsound_avg) | 18,680 | 34 | 70 | 44 | 9 | 19,648 | 34 | 70 | 39 | 8 |
| SPL_peak [dB] (SENsound_peak) | 9,775 | 64 | 99 | 75 | 10 | 11,257 | 64 | 99 | 73 | 9 |
Note:
*One case with extreme value of 5.150 has been deleted
For all mental health indicators internal consistency was confirmed (Cronbach’s α > 0.7). Table 4 summarizes how the 36 respondents scored on average, both in the end-survey and in the momentary surveys. It shows that, on average, the respondents have been bothered by stress on several days in the measurement period (some even more than half the days), but most felt only low levels of fatigue. Sleep quality was rated neutral on average, but especially some respondents were having problems staying asleep at night. Concentration, productivity and overall mental well-being scored slightly over 7 (on 10-pts scales). The more elaborate concentration scale in the end-survey, however, presented a more neutral score (3.89 on a 7-pts scale) though still on the positive side. The other four concepts (engagement, emotional exhaustion, depression and mood tense arousal) were rated more neutral in the end survey as well (average scores close to 2 on 4-pts scales). Half of the respondents agreed with the engagement scale item that they sometimes feel sickened by their work tasks. On the emotional exhaustion scale, ten participants felt worn out and weary after work and found that they did not have enough energy left for leisure activities. Half of the participants experienced days on which they felt tired even before they started work. A major part of the respondents experienced no or few days with depressive symptoms. Regarding mood, the Cronbach’s alpha of the end-survey was too low to assess the hedonic tone. The momentary data show that on average people scored “slightly not” when asked whether they were tense. All mental health concepts relate to at least one of the others.
Employee mental health concepts internal consistency survey items (N = 36, unless otherwise indicated)
| Mental health indicator | Mean* | SD* | Min | Max | No. of items (scale) | Cronbach’s α | Inter-item correlation |
|---|---|---|---|---|---|---|---|
| Stress (Low → High) | 1.71 | 0.605 | 4 | 14 | 4 (4-pts) | 0.842 | |
| Fatigue (Low → High) | 2.97 | 1.237 | 9 | 53 | 8 (7-pts) | 0.918 | |
| Sleep quality (Good → Bad) | 1.96 | 0.707 | 5 | 19 | 5 (4-pts) | 0.815 | |
| Concentration (Bad → Good) | |||||||
| • Momentary [N = 321] | 7.12 | 1.246 | 3 | 10 | 1 (10-pts) | ||
| • Overall | 3.89 | 1.346 | 5 | 34 | 5 (7-pts) | 0.880 | |
| Productivity (Bad → Good) | |||||||
| • Momentary [N = 321] | 7.36 | 1.116 | 3 | 10 | 1 (10-pts) | ||
| • Overall | 7.03 | 0.774 | 5 | 9 | 1 (10-pts) | ||
| Mental well-being (Bad → Good) | 7.75 | 0.970 | 5 | 10 | 1 (10-pts) | ||
| Engagement (High → Low) | 1.92 | 0.387 | 10 | 22 | 8 (4-pts) | 0.739 | |
| Emotional exhaustion (Good → Bad) | 2.29 | 0.376 | 12 | 25 | 8 (4-pts) | 0.726 | |
| Depression (Low → High) | 1.56 | 0.583 | 2 | 7 | 2 (4-pts) | 0.361 | |
| Mood: tense arousal (High → Low) | |||||||
| • Momentary [N = 321] | 2.13 | 0.472 | 3 | 13 | 4 (4-pts) | 0.814 | |
| • Overall | 2.00 | 0.500 | 7 | 17 | 4 (4-pts) | 0.840 | |
| Mood: hedonic tone (Low → High) | |||||||
| • Momentary [N = 321] | 1.85 | 0.403 | 4 | 14 | 4 (4-pts) | 0.675 | |
| • Overall | 3.10 | 0.380 | 4 | 12 | 4 (4-pts) | 0.590 |
Note:
*The mean and standard deviation values, based on the sum of the item outcomes, are divided by the number of items in the scale for ease of interpretation
4.2 Bivariate analysis
All pairs of variables in the conceptual model are tested at participant level (N = 36, see Table 5) and on the momentary PiT level (N = 321, see Table 6). Where necessary, PiT data was aggregated by taking the mean or the MH data were duplicated to the PiT level if necessary. At the PiT level, the carbon dioxide concentration did not relate significantly to any of the dependent variables. Further, all assumed relationships in the conceptual model show significant results. At the participant level, no significant relationships with other variables were found for age, household composition and the measured CO2 concentration. Only a limited number of the mental health concepts were related to subjective IEQ conditions; most prominent was noise level satisfaction correlating with concentration, productivity, mental well-being and workplace satisfaction. Moreover, satisfaction with temperature was related to the stress level of an employee. Sleep quality, emotional exhaustion, depression and tense feelings (tense arousal) were not related to any IEQ condition. The objective sound pressure level related to the subjective IEQ experience of noise, temperature and air quality. Some objective IEQ conditions also had a direct relationship with mental health (measured temperatures with concentration, and illuminance with concentration and engagement). As expected, personal characteristics related to subjective IEQ experience and mental health too. Similarly, the home workplace quality related to perceived noise and light level and to several mental health concepts.
Significant relations in the bivariate analysis on participant level
| Independent | Dependent | Test result |
|---|---|---|
| Personal characteristics | Subjective IEQ conditions | |
| Gender | SAT air quality | t(34) = −2.210, p = 0.034 |
| P agreeableness | SAT temperature | F(3,32) = 4.620, p = 0.009 |
| Workload | SAT temperature | F(3,32)=9.506, p = 0.000 |
| Personal characteristics | Workplace mental health | |
| P neuroticism | Stress | rs(34) = −0.435, p = 0.008 |
| P neuroticism | Fatigue | r(34) = −0.410, p = 0.013 |
| P neuroticism | Concentration (MH) | r(34) = −0.359, p = 0.031 |
| P neuroticism | Mental well-being | rs(34) = −0.545, p = 0.001 |
| P neuroticism | Emotion exhaustion | r(34) = −0.551, p = 0.000 |
| P neuroticism | Depression | rs(34) = −0.336, p = 0.045 |
| P neuroticism | Mood (PiT) | rs(34) = −0.450, p = 0.006 |
| P extraversion | Fatigue | F(3,32) = 5.027, p = 0.006 |
| P extraversion | Sleep quality | H(3) = 10.349, p = 0.016 |
| P extraversion | Concentration (PiT) | F(3,32) = 3.631, p = 0.023 |
| P agreeableness | Concentration (PiT) | H(3) = 8.789, p = 0.032 |
| P agreeableness | Concentration (MH) | H(3) = 7.924, p = 0.048 |
| P conscientiousness | Concentration (PiT) | F(3,32) = 3.945, p = 0.017 |
| P openness | Mood | F(3,32) = 11.803, p = 0.025 |
| Job rank | Mood | F(3,32) = 10.288, p = 0.047 |
| Objective IEQ conditions | Subjective IEQ conditions | |
| SEN sound 60 min | SAT air quality | r(34) = −0.428, p = 0.009 |
| SEN sound 60 min | SAT noise level | r(34) = −0.342, p = 0.041 |
| SEN sound 30 min | SAT temperature | r(35) = −0.334, p = 0.046 |
| SEN sound 30 min | SAT air quality | rs(35) = −0.355, p = 0.034 |
| SEN sound 30 min | SAT noise level | rs(35) = −0.354, p = 0.034 |
| SEN sound 15 min | SAT temperature | rs(34) = −0.380, p = 0.022 |
| SEN sound 15 min | SAT noise level | rs(34) = −0.346, p = 0.039 |
| Objective IEQ conditions | Workplace mental health | |
| SEN temperature 60 min | Concentration (MH) | rs(34) = 0.351, p = 0.036 |
| SENlight60 | Concentration (MH) | rs(34) = 0.322, p = 0.055 |
| SENlight60 | Engagement | rs(34) = 0.405, p = 0.014 |
| Workplace at home | Subjective IEQ conditions | |
| Distraction | SAT noise level | r(34) = −0.491, p = 0.002 |
| Suitability | SAT noise level | r(34) = 0.540, p = 0.001 |
| Suitability | SAT illuminance | r(34) = 0.367, p = 0.028 |
| Workplace at home | Workplace mental health | |
| Distraction | Engagement | r(34) = −0.373, p = 0.025 |
| Distraction | Mental well-being | rs(34) = −0.329, p = 0.050 |
| Suitability | Fatigue | rs(34) = 0.439, p = 0.007 |
| Suitability | Concentration (MH) | r(34) = 0.458, p = 0.005 |
| Suitability | Concentration (PiT) | r(34) = 0.355, p = 0.034 |
| Subjective IEQ conditions | Workplace mental health | |
| SAT temperature | Stress | rs(34) = 0.353, p = 0.035 |
| SAT noise level | Concentration (PiT) | r(34) = 0.346, p = 0.039 |
| SAT noise level | Productivity (PiT) | r(34) = 0.344, p = 0.040 |
| SAT noise level | Mental well-being | rs(34) = 0.419, p = 0.011 |
Relations tested significant in the bivariate analysis on the experience level
| Independent | Dependent | test result |
|---|---|---|
| Objective IEQ conditions | Subjective IEQ conditions | |
| SEN temperature 60 min | SAT illuminance | rs(320) = 0.139, p = 0.012 |
| SEN sound 60 min | SAT temperature | rs(320) = −0.157, p = 0.005 |
| SEN sound 60 min | SAT air quality | rs(320) = −0.195, p = 0.000 |
| SEN sound 60 min | SAT noise level | rs(320) = −0.178, p = 0.001 |
| Objective IEQ conditions | Workplace mental health | |
| SEN sound 60 min | Fatigue | rs(320) = −0.115, p = 0.039 |
| SEN sound 60 min | Mood (PiT) | rs(320) = −0.170, p = 0.002 |
| SEN sound 60 min | Stress | rs(320) = 0.112, p = 0.046 |
| SEN sound 60 min | Depression | rs(320) = −0.164, p = 0.003 |
| SEN illuminance 60 min | Fatigue | rs(320) = 0.120, p = 0.032 |
| SEN illuminance 60 min | Concentration (PiT) | rs(320) = 0.206, p = 0.000 |
| SEN illuminance 60 min | Productivity (PiT) | rs(320) = 0.169, p = 0.002 |
| SEN illuminance 60 min | Engagement | rs(320) = 0.328, p = 0.000 |
| SEN illuminance 60 min | Depression | rs(320) = −0.114, p = 0.041 |
| SEN temperature 60 min | Stress | rs(320) = 0.112, p = 0.046 |
| SEN temperature 60 min | Sleep quality | rs(320) = 0.179, p = 0.001 |
| SEN temperature 60 min | Depression | rs(320) = −0.133, p = 0.017 |
| Subjective IEQ conditions | Workplace mental health | |
| SAT temperature | Mood (PiT) | rs(320) = 0.114, p = 0.041 |
| SAT temperature | Stress | rs(320) = 0.168, p = 0.003 |
| SAT air quality | Fatigue | rs(320) = 0.191, p = 0.001 |
| SAT air quality | Concentration (PiT) | rs(320) = 0.197, p = 0.000 |
| SAT air quality | Productivity (PiT) | rs(320) = 0.180, p = 0.001 |
| SAT air quality | Mental well-being | rs(320) = 0.116, p = 0.037 |
| SAT air quality | Mood (PiT) | rs(320) = 0.126, p = 0.024 |
| SAT air quality | Stress | rs(320) =0.178, p = 0.001 |
| SAT air quality | Emotional Exhaustion | rs(320) = 0.140, p = 0.012 |
| SAT noise level | Fatigue | rs(320) = 0.176, p = 0.002 |
| SAT noise level | Concentration (PiT) | rs(320) = 0.221, p = 0.000 |
| SAT noise level | Productivity (PiT) | rs(320) = 0.213, p = 0.000 |
| SAT noise level | Engagement | rs(320) = 0.221, p = 0.001 |
| SAT noise level | Mental well-being | rs(320) = 0.294, p = 0.000 |
| SAT noise level | Mood (PiT) | rs(320) = 0.177, p = 0.001 |
| SAT noise level | Depression | rs(320) = 0.113, p = 0.043 |
| SAT illuminance | Productivity (PiT) | rs(320) = 0.140, p = 0.012 |
| SAT illuminance | Mood (PiT) | rs(320) = 0.122, p = 0.029 |
| Workplace at home | Subjective IEQ conditions | |
| Suitability | SAT air quality | rs(320) = 0.198, p = 0.000 |
| Suitability | SAT noise level | rs(320) = 0.332, p = 0.000 |
| Suitability | SAT illuminance | rs(320) = 0.189, p = 0.001 |
| Distraction | SAT air quality | rs(320) = −0.201, p = 0.000 |
| Distraction | SAT noise level | rs(320) = −0.324, p = 0.000 |
| Workplace at home | Workplace mental health | |
| Suitability | Fatigue | rs(320) = 0.498, p = 0.000 |
| Suitability | Concentration (PiT) | rs(320) = 0.202, p = 0.000 |
| Suitability | Productivity (PiT) | rs(320) = 0.135, p = 0.016 |
| Suitability | Engagement | rs(320) = 0.145, p = 0.009 |
| Suitability | Mental well-being | rs(320) = 0.270, p = 0.000 |
| Suitability | Mood (PiT) | rs(320) = 0.164, p = 0.003 |
| Suitability | Emotional exhaustion | rs(320) = 0.206, p = 0.000 |
| Suitability | Depression | rs(320) = 0.183, p = 0.001 |
| Distraction | Fatigue | rs(320) = −0.279, p = 0.000 |
| Distraction | Concentration (PiT) | rs(320) = −0.228, p = 0.000 |
| Distraction | Productivity (PiT) | rs(320) = −0.277, p = 0.000 |
| Distraction | Engagement | rs(320) = −0.375, p = 0.000 |
| Distraction | Mental well-being | rs(320) = −0.373, p = 0.000 |
| Distraction | Emotional exhaustion | rs(320) = −0.211, p = 0.000 |
4.3 Path model
The path analysis was performed using the PiT level (N = 321). A stepwise method was used to find the best model fit, excluding variables having insignificant paths or regressions with a low r-squared value. The model itself was tested against its goodness-of-fit by means of several indices (see Table 7). To derive a significant path model, only the significant pairs at the p = 0.01-level were included. As a result, satisfaction with temperature was excluded, increasing the model fit substantially. The final path model is shown in Figure 2, including the standardized effect sizes.
Path model goodness of fit indices
| Indicators | Value | Guideline |
|---|---|---|
| Degrees of freedom | 34 | |
| Chi-square | 0.168 | >0.05 = fit (Barrett, 2007) |
| Chi-square/degrees of freedom | 0.005 | <2 = fit (Golob, 2003) |
| Comparative Fit Index (CFI) | 0.989 | >0.9 = fit (Hooper et al., 2008) |
| Root mean square error of approximation (RMSEA) | 0.027 | <0.05 = fit (Hooper et al., 2008) |
| 90% Confidence interval for RMSEA | 0.000; 0.051 | |
| P-value for test of close fit (RMSEA < 0.05) | 0.941 | |
| Standardized Root Mean Square Residual (SRMR) | 0.038 |
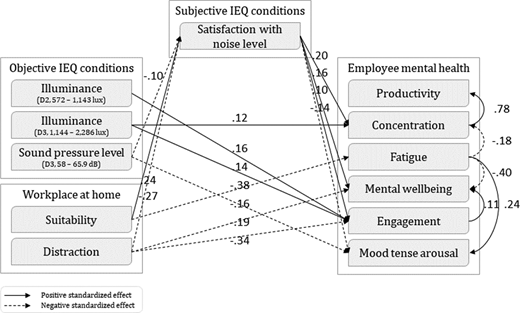
A limited number of the included variables appear most relevant to explain effects on mental health. Personal characteristics were not part of this final model, so H3 “Personal characteristics impact subjective IEQ conditions at home” and H4 “Personal characteristics impact employee mental health concepts at home” could only be confirmed with the bivariate analysis. From the IEQ-parameters, only those related to lighting and noise remained in the model (excluding temperature and air quality as less relevant). Lighting and noise related to several mental health concepts, confirming H1 “IEQ conditions at home impact employee mental health concepts”. The model also shows that H2 “Objective IEQ conditions at home impact subjective IEQ conditions at home” is confirmed, but only for sound pressure level versus noise perception. Workplace suitability related negatively to fatigue and the perceived distractions to mental well-being and engagement. This confirms H5 “Home workplace characteristics impact employee mental health concepts”. As both also relate to the subjective noise experience, also H6 “Home workplace characteristics impact subjective IEQ conditions” is confirmed. The home workplace showed the strongest standardized effects on employee mental health, more than the effects of the objective or subjective IEQ conditions.
5. Discussion, limitations and implications
The path model suggests higher engagement when illuminance at home exceeds 575 lux, similar to findings in offices between engagement and lighting appraisal (Veitch et al., 2013). Previous associations between lighting at the office with productivity (Eklund and Boyce, 1996) were only confirmed in the bivariate analyses. Surprisingly its relationships with sleep quality and overall mental well-being, which are common in offices (Boubekri et al., 2014), were not confirmed in this study. Regarding sound, results suggest that an average sound pressure level above 58 dB creates increased tension and diminished satisfaction with noise, confirming Delle Macchie et al. (2018). On the contrary, home workplace suitability had a positive effect on satisfaction with noise and also led to decreased fatigue. In turn, this increased satisfaction with noise related positively to concentration, self-reported mental well-being, engagement and diminished tension. Distractions while working from home negatively affected self-reported mental well-being and the level of engagement. This is similar to findings by Lee et al. (2016) for the effect of noise on self-rated health in open-plan offices. Previous findings of productivity effects from noise disturbance in offices (Mak and Lui, 2012) are at home only confirmed so far by indirect effects in the path model. So, overall, both effects of IEQ and of suitability/noise on employee mental health in the home workplace generally resemble the effects found in offices. Given the move to hybrid working practices, this is an interesting new finding about this less officially monitored workplace.
In contrast with office studies, the current study did not find significant relationships between carbon dioxide levels and productivity (Allen et al., 2016) or stress (Zhang et al., 2017); possibly because average and outlier CO2-levels were lower than in those studies. An additional explanation may also be that odors, volatile organic compounds and particulate matter might play a more crucial role in the assessment of air quality in the home environment. CO2-concentration is mainly a proxy related to the number of people exhaling air, and thus could be less suitable to measure the home workplace. Therefore, additional parameters should be included in future studies to measure IAQ in addition to CO2. By measuring across different seasons, additional effects of air quality and temperature may come forward as well.
The sensor measurements showed that the home workplace IEQ is of similar quality as the office. However, this study was performed in April under relatively cool weather conditions. As Dutch houses generally do not have air-conditioning, thermal conditions at home may be less comfortable in warmer periods. The COVID lockdown did not allow for more extensive measurements in the individual homes, but existing office studies with the same Elsys sensors also did not do so (Roskams and Haynes, 2021). Nevertheless, there is a need to confirm whether the simplification is sufficient in future research. In addition, Rasheed and Byrd (2017) question the reliability of self-evaluation to measure productivity. More research is necessary to see whether this is also true in self-evaluating mental health. Also, the participants were obligated to work from home due to the COVID-19 lockdown regulations. This may have led to a reduction in (perceived) work autonomy which could on its turn have led to diminished job satisfaction (Kröll and Nüesch, 2019). Besides not being able to work in the office, the pandemic may also have affected people in ways (e.g. friends or family experiencing health problems) not reflected in the survey. It would be valuable to repeat the study now that the pandemic appears less severe than in the early days when this data was collected.
Last, the number of cases for SEM should at least be 200 for an acceptable model (Barrett, 2007; Hooper et al., 2008). Although the current model consists of 321 experiences, those experiences are still nested in 36 participants. Due to the limited number of IEQ sensors available, the sample was small and thus the findings should be considered as an exploratory study. Nevertheless, the model findings are in line with several outcomes obtained for office environments and confirm that in the home workspace each IEQ factor can affect building occupants’ satisfaction and perceptions differently, like identified before for the office workspace (Bae et al., 2021). This is valuable new information for further theories on hybrid working.
5.1 Conclusion and policy implications
This study aimed to explore the effects of the IEQ at the home workplace on employee mental health. Outcomes demonstrate that both subjective and objective IEQ parameters, and the experienced workplace suitability and distractions when working from home are related to employee mental health when working from home in a similar way as when working in the office. More significant relationships may come forward future studies with larger samples to study diversity based on personal characteristics, cultures and local climates. The protocol developed here could be used for such studies.
So far, organizations have been managing home working mostly with a narrow ergonomic angle, by given people chairs, screens and other technology to take home. This study shows that, like in office work policies, the IEQ and noise disturbance at home must be considered in home working policies as well. This study showed the merit of using simple IEQ sensors at home for this. As Hui et al. (2010) already stressed for office research, asking about IEQ satisfaction does not identify all problems found with sensors. These sensors could be temporarily used at different homes to determine better home working policies in specific contexts.
When the workplace design relationship with mental health is better understood, employers are better able to act on improving their workforce’s mental health – a win-win situation. Employers may support the employees’ mental health state through aiming for optimal IEQ conditions in both the office and the home-based work environment. Individual employees could review their mental health state and possibly take small interventions (e.g. install lighting with increased illuminance at home or request increased soundproof workspaces at the office). In the long run, this may reduce health-related costs for society as well.
