Conventional tracer gas testing, using conservative tracer gases (like SF6 or CO2), is the most accurate method for assessing air change rates, but it can be expensive and cumbersome to perform. Using water vapor as unconventional tracer gas has been proposed as an alternative, but it has not been broadly validated through the build environment. This paper evaluates water vapor tracer gas testing in a new context.
Eight simultaneous water vapor and CO2 tracer gas tests were conducted on a Mongolian ger (or “yurt” in Russian). The air change rates from the water vapor (ACHH2O) and CO2 tracer gas tests (ACHCO2) were compared to evaluate the accuracy of the method.
Under ideal conditions, the ACHH2O values were accurate within 21–41% of the ACHCO2 values (consistent with the literature). Indoor combustion and rainstorms were identified to cause higher errors (70–88% and 76%, respectively).
Limitations in the accuracy and deployment of the sensors made characterization of the air change rate (ACH) errors challenging. However, the agreement between the ACHH2O and ACHCO2 observed in this study was consistent with other lower cost alternatives to conventional tracer gas testing.
This paper evaluates water vapor tracer gas testing in a new residential building type, and it is the first study to consider water vapor tracer gas testing in the presence of indoor combustion and after a rainstorm.
1. Introduction
Air infiltration is a key contributor to building energy consumption. Many studies have evaluated the impact of air infiltration on building energy use, using values taken from experimental assessment (Feijó-Muñoz et al., 2019; Jokisalo et al., 2009; Liu et al., 2021b; Lu et al., 2020; Ren and Chen, 2015) or prior knowledge (Guillén-Lambea et al., 2019; Han et al., 2015; Lin and Chuah, 2010). Infiltration loads have been reported in the range of 3–64% of the space conditioning load for residences (Feijó-Muñoz et al., 2019; Guillén-Lambea et al., 2019; Jokisalo et al., 2009; Ren and Chen, 2015). One simulation study showed that the infiltration load for a given house would be up to six times greater in northern cities like Paris, London and Berlin than in Mediterranean cities like Palermo and Almeria (Guillén-Lambea et al., 2019).
Many residential buildings lack mechanical ventilation systems, so natural ventilation (planned air flows outside to inside) and air infiltration (unplanned air flows from outside to inside) deliver all ventilation benefits (Colclough et al., 2018; Kinnane et al., 2016; Persily et al., 2010). In these cases, it can be nearly impossible to distinguish between air infiltration and natural ventilation, so they are typically combined into a total air change rate. Ventilation is required to remove many indoor generated pollutants like CO2, particulate matter and VOCs, as well as excess humidity, which is correlated with health hazards (Sterling et al., 1985; Yin et al., 2019). Excessive air change rates can be concerning, particularly in urban environments. One study in Madrid, Spain, found that high air change rates were correlated with a 5.85% increase in annual average indoor nitrogen dioxide (NO2) concentrations (Jose and Perez-Camanyo, 2023). Additionally, air infiltration can be a significant source of indoor PM2.5 (Braham et al., 2022; Liang et al., 2021).
Notwithstanding the potential ventilation benefits, building regulations in Europe and North America have been increasingly incorporating standards for air tightness (Poza-Casado et al., 2020), and improving air seals is common in renovations to improve building energy performance (Qu et al., 2021). However, without knowing the air change rates, it can be challenging to quantify the investment benefit of improving airtightness and whether additional ventilation is necessary.
Tracer gas testing is the only technique that can accurately measure air change rates under ambient conditions, and it is often used as the “ground truth” measurement that other experimental techniques are compared against. Standardized procedures for tracer gas tests are published in the American Society for Testing and Materials (ASTM) standard E741 and the International Standards Organization (ISO) standard 12,569 (ASTM, 2023; International Standards Organization, 2017). According to ASTM E741, the ideal criteria for a conservative tracer gas are chemical inertness, non-interactivity with building materials and stable concentration in the atmosphere. Water vapor fails to meet these criteria because it can be adsorbed by many building materials, and its concentration in the atmosphere is not stable over long periods of time. Two of the most common tracer gases used in buildings are carbon dioxide (CO2) (Boulard and Draoui, 1995; Dai and Chen, 2022; Hou et al., 2019; Li et al., 2012; Liu et al., 2021a; Montoya et al., 2011; Shi and Li, 2019; Wu et al., 2016; Yin et al., 2019) and sulfur hexafluoride (SF6) (Boardman and Glass, 2015; Edouard et al., 2016; Liu et al., 2018a; Pereira and Melo, 2019; Wu et al., 2016). Due to its high greenhouse gas potential, toxicity to humans and new European Union (EU) regulations, there have been efforts to reduce the use of SF6 for tracer gas testing (Pinto et al., 2025; Tsai, 2007; Yu et al., 2018). Additionally, some studies have noted that sourcing, storing and releasing the quantities of the industrially purified tracer gases prescribed by ASTM E741 and ISO 12569 can be challenging and expensive (Roberts et al., 2023; Shi et al., 2017; Tusi et al., 2021).
Occupant-exhaled CO2 tracer gas testing has emerged as an alternative to conventional tracer gas testing. Concentration decay-style occupant-exhaled CO2 tests occurs when the all of the occupants leave the space and the CO2 concentration decays to ambient levels (Bekö et al., 2010; Hou et al., 2019; Kisilewicz et al., 2021; Park et al., 2014; Shi et al., 2015). These tests require robust occupancy data to determine when spaces are vacant and information on any other potential indoor sources of CO2. Constant injection-style occupant-exhaled CO2 tests are typically done when occupants can be assumed to be in a constant metabolic state, such sleeping or doing light office work (Ai et al., 2016; Bekö et al., 2010; Edouard et al., 2016; Hou et al., 2019; Lu et al., 2010; Men et al., 2020; Turanjanin et al., 2014). These tests require robust occupant counts, activity levels of the occupants and biometric data on the occupants to estimate the CO2 exhalation rates. Three studies have rigorously compared occupant-exhaled CO2 tracer gas tests against conventional tracer gas tests like SF6 and Freon® and found errors in the range of 7.4–143% (Bekö et al., 2016; Edouard et al., 2016; Men et al., 2020). However, the occupancy-related data that these studies rely on are not always available.
Seven studies have been published considering the use of water vapor as a tracer gas (Boulard and Draoui, 1995; DeWalle and Heisler, 1980; Li et al., 2012; Liu et al., 2018b; Rigakis et al., 2015; Tusi et al., 2021; Xiong et al., 2021a). These studies evaluated a small variety of building types: plant growth chambers (Boulard and Draoui, 1995; Li et al., 2012; Rigakis et al., 2015; Tusi et al., 2021), a residence (DeWalle and Heisler, 1980), three offices (Xiong et al., 2021a) and an airport terminal (Liu et al., 2018b). Three of these studies evaluated the accuracy of water vapor tracer gas testing relative to CO2 tracer gas tests and found errors in the range of 0.086–39% (DeWalle and Heisler, 1980; Li et al., 2012; Xiong et al., 2021a). While these low errors are promising, additional research is necessary to validate the applicability of this technique in different building contexts and under different climatic and indoor conditions. This paper aims to help fill that research gap.
2. Methods
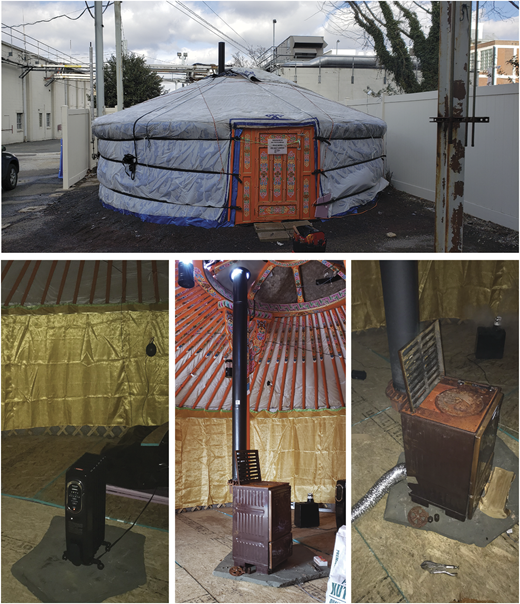
This work was conducted as part of United Nation International Children's Emergency Fund (UNICEF) Mongolia’s Ger of the 21st Century Project. The goals of that project were to decrease ambient air pollution experienced by ger (or “yurt” in Russian, Figure 1) residents in Mongolian cities, more details of which can be found elsewhere (Braham et al., 2022). When these experiments were conducted, no studies had been published evaluating air change rates in ger. Since then, one paper has been published evaluating change rates in ger, but the authors of that paper noted difficulty using a blower door to pressurize the ger and had moderate success using occupant-exhaled CO2 tracer gas tests (Kisilewicz et al., 2021). This paper will present eight simultaneous water vapor and CO2 tracer gas tests (Table 1) conducted on a ger (Figure 1) at the University of Pennsylvania’s Pennovation research campus, hereafter referred to as the “Penn Ger.” Details on additional water-vapor-only tracer gas tests conducted on ger near Ulaanbaatar, Mongolia, can be found in the supplemental file.
2.1 Case study building: Penn Ger
The Penn Ger was a typical “five panel” (6-m diameter) ger purchased from a market in Ulaanbaatar, Mongolia, that was shipped to Philadelphia and constructed on a paved parking lot (see Figure 1). It had a floor area of 28 m2 and an internal air volume of 45 m3. The structure and envelope were constructed of wood, felt and cotton, which are all organic fiber materials that can adsorb or desorb significant quantities of water vapor when there are large changes (over 20%) in the relative humidity (Hill et al., 2009, 2010; Shi and Avramidis, 2017). Given the small observed relative humidity ranges during the tracer gas tests (Table 2), water vapor adsorption/desorption was assumed to be minimal.
Two heat sources were tested in the Penn Ger, a Honeywell EnergySmart® 1,500-W oil-filled electric radiator and a coal stove shipped from Mongolia (Figure 1). Combustions stoves are the most common heat source in ger, and they are common for cooking and heating in vernacular housing around the world (Balmes, 2019). However, there is significant interest in replacing these stoves with electric heaters to reduce emissions and improve health outcomes in Mongolia and elsewhere (Braham et al., 2022).
2.2 Instrument and calibration
ASTM E741 requires verification of homogeneity in indoor tracer gas concentration (ASTM, 2023). For a space that is under a volume of 425 m3, three uniformly spatially distributed samples of the tracer gas are necessary to verify horizontal homogeneity. ASTM E741 states that for “single-story zones” with ceiling heights below 4.6 m, it is not necessary to verify vertical homogeneity, and it recommends that measurements should be taken mid-way between the floor and the ceiling. The sensors used in this paper were installed in place for the entire winter, and it was not possible to suspend the sensors halfway between the floor and ceiling without disrupting other research and teaching activities. That said, previous studies have placed sensors in “unobtrusive” locations (Bekö et al., 2010; Xiong et al., 2021b).
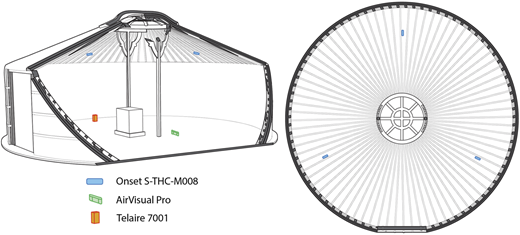
Indoor and outdoor temperature and relative humidity were measured using Onset S-THC-M008 temperature and relative humidity sensors (temperature: resolution: 0.02 °C; accuracy: ±0.25 °C from −40° to 0 °C, ±0.20 °C from 0° to 70 °C, ±0.25 °C from 70° to 75 °C; response time: 3 min [or 45 s in air moving 1 m/s] for 90% step change typical; relative humidity: resolution: 0.01% relative humidity (RH); accuracy: ±2.5% RH from 10% to 90% RH with a typical to a maximum of ±3.5%, below 10% and above 90% ± 5% typical; response time: 15 s in air moving 1 m/s for 90% step change typical). Indoor and outdoor CO2 concentration measurements were taken using Telaire 7001 NDIR CO2 sensors (resolution: 1 ppm; accuracy: 0–5,000 ppm: ±50 ppm or 5% of reading, whichever is greater; response time: <60 s for 90% step change typical) and an AirVisual Pro, which uses a Senseair S8 LP NDIR CO2 Sensor (resolution: 1 ppm; accuracy: ±40 ppm or 3% of reading, whichever is greater; <30 s for 90% step change typical). Onset sensors and Telaire T70001 CO2 sensors have been used in previous studies to evaluate air change rates (Bekö et al., 2010; Cheng and Li, 2018).
Three Onset S-THC-M008 temperature and relative humidity sensors were hung from the uni (thin rafters in the roof of the ger, Figure 2). They were attached halfway between the walls and the toono (circular oculus at the top of the ger), hung 15 cm from the ceiling, evenly distributed around the circumference of the ger. Unfortunately, only three CO2 sensors were available to the research team for these tests. One was needed to measure the outdoor CO2 concentration, so only two CO2 sensors were used to measure indoor CO2 concentration: a Telaire 7001 CO2 sensor on the floor 1 m from the perimeter of the ger and an Air Visual Pro in the center of the floor (Figure 2). While this does not meet the measurement of uniformity requirements in ASTM E741, the small internal volume and radial symmetry of the ger should ensure easy mixing of the tracer gases. Given that the diffusivity coefficients of CO2 and water vapor in air are similar—0.16 and 0.242 cm2/s at 20 °C and atmospheric pressure—Engineering Toolbox, n.d., the mixing times for the two gases in the volume of the ger would be 28 and 19 s, respectively. This timescale is sufficiently short that if the water vapor was well mixed, the CO2 was likely well mixed as well.
Outdoor temperature and relative humidity measurements were taken by an Onset S-THC-M008 temperature and relative humidity sensor at a height of 1.7 m attached to the fence surrounding the ger. Outdoor CO2 measurements for the Penn Ger were captured by a Telaire 7001 CO2 sensor at ground level. Wind speed and wind direction data were taken from a weather station on the roof of Meyerson Hall at the University of Pennsylvania, 1.5 km north of the test site at a height of approximately 15 m.
The Onset S-THC-M008 sensors used in this project were purchased new. The manufacturer calibrates the sensors prior to shipping them, so additional pre-calibration was not done. Prior to the tracer gas testing, the Telaire 7001 CO2 sensors were calibrated using the Telaire T2075NG one-point calibration kit. The AirVisual Pro was also purchased new, and no calibration was done on that sensor.
Because all the response times for the sensors were below 1 min (including the temperature and relative humidity sensors for expected air speeds), data were collected at a 1-min sampling interval.
2.3 Tracer gas experiments and analysis
The procedures for the eight simultaneous water vapor and CO2 tracer gas tests closely followed the concentration decay tests described in ASTM E741 (ASTM, 2023). During these tests, a humidifier was placed in the ger for 6 h, prior to the start of the test, to saturate the indoor air with water vapor. Once that was done, the humidifier was turned off, and CO2 was released from a pressurized cylinder until the indoor concentration reached 7,000 ppm. Then, the CO2 cylinder was closed, and the tracer gas test began. ASTM E741 does not require assisted fan mixing for concentration decay tests by default and is only necessary if the uniformity criteria is not met (ASTM, 2023). As will be discussed in Section 3, the uniformity criterion was met for the water vapor, so fan-assisted mixing was not used. The indoor humidity and CO2 concentration were measured for 12 h, but because the gas concentrations in the ger decayed quickly, only the first 90 min were used for analysis. Details about the eight tests can be found in Table 2. Tests 7 and 8 were conducted with the door cracked open and the toono partially uncovered to evaluate higher air leakage scenarios.
For the analysis period, a mass balance was taken on the indoor air (USDOE, 2024):
Here, Cx,indoor and Cx,outdoor are the indoor and outdoor mass concentrations of gas x, Vindoor is the volume of the indoor space (45 m3), V̇ACH is the volumetric air change rate and ṁx,generated is the mass generation rate of gas x in the space (which can be positive or negative). To enable this analysis, the temperature and relative humidity measurements were converted to absolute humidity or mass concentration of water vapor via equations published in the American Society of Heating, Refrigeration, and Air-Conditioning Engineers (ASHRAE) Fundamentals (ASHRAE, 2021). To ensure that measurement errors were faithfully reported, minimum and maximum water vapor concentrations were calculated using the most extreme possible errors from the temperature and relative humidity sensors.
The indoor gas generation rate was assumed to be zero, ṁx,generated ≈ 0. Indoor water vapor and CO2 generation is typically due to occupant respiration, domestic water use, heating and space conditioning and adsorption/desorption from building materials. During the tracer gas experiments, the Penn Ger was unoccupied. The coal stove in the Penn Ger had a sealed internal combustion chamber with a chimney (Figure 1), so exhaust gas leaks into the ger were assumed to be minimal. Additionally, the electric heater used in the Penn Ger was an oil-filled electric radiator. The oil in the radiator was acting as a thermal mass, and there was no combustion, so the radiator could increase the indoor temperature (affecting the relative humidity) but could not directly add or remove water vapor or CO2. As was previously discussed, the relative humidity ranges during the tests were small, so likely little vapor was adsorbed or desorbed by the building materials. The outdoor CO2 and vapor concentrations were much more stable than the indoor concentrations over the 90-min tracer gas tests, as shown in Table 2, so it was assumed that the outdoor concentrations are nearly constant.
With these assumptions, the mass balance in Equation 1 was reduced to
Here, θx is the non-dimensional indoor-to-outdoor concentration difference for gas x, and is the air change rate in h−1. The solution to Equation 2 is
For the tracer gas experiments, the log of the non-dimensional indoor-to-outdoor concentration difference for gas x, ln(θx(t)), was graphed versus time. A least squares linear regression was applied to ln(θx(t)) with respect to time using an intercept of 0 because there is no intercept in Equation 4, and the slope was used to calculate the air change rate.
3. Results
Data for these tests were published as part of a larger Ger of the 21st Century data set (Hakkarainen et al., 2024). According to ASTM E741, if the coefficient of variation for the spatially distributed tracer gas measurements is less than 10%, the uniformity criterion will be met, and the measured air change rate values will be within 10% of the actual value (ASTM, 2023). Testing conditions for the eight simultaneous water vapor tracer and CO2 tracer gas tests are shown in Table 2. As was discussed in Section 2.2, there were only two indoor CO2 sensors, so the CO2 coefficient of variation cannot be used to verify the uniformity criterion in ASTM E741, but it can be used as an indicator of uniformity. During test 3, the Telaire 7001 CO2 sensor had a data error, so the coefficient of variation could not be assessed for the CO2 concentration. For the remaining tests, the coefficient of variation was below 10% threshold, so the uniformity criterion in ASTM E741 was satisfied.
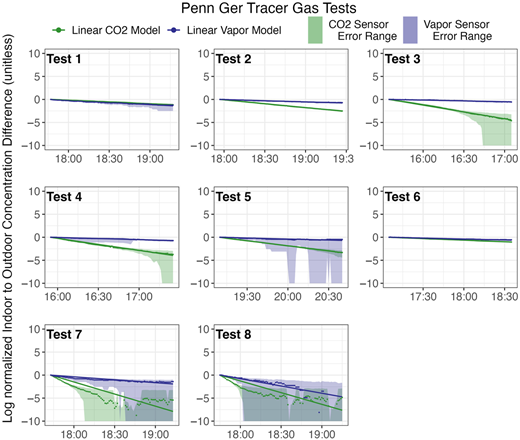
Table 3 shows the calculated air change rates for the eight tests, along with relevant statistics, and Figure 3 shows the log normalized indoor-to-outdoor concentration differences with error bands based on the sensor accuracy, discussed in Section 2. The high degree of linearity observed in these graphs suggests that the air change rates for these tests were nearly constant. The error bands correspond to minimum and maximum potential values for tracer gas concentration based on sensor accuracy and calculation of vapor concentration described in Section 2.3.
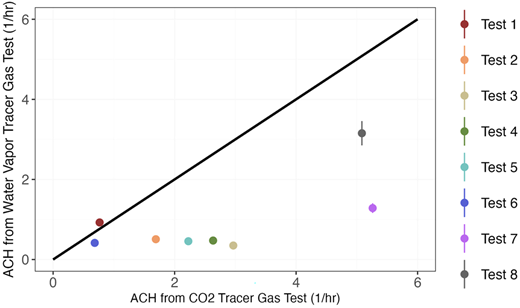
Figure 4 shows the correlation between the ACHCO2 and ACHH20 for the eight tracer gas tests. Except for test 1, ACHH2O underestimated the ACHCO2 values. Test 1 shows the best agreement (the error was 0.16 h−1 or 21%) between ACHCO2 and ACHH20, and there is overlap in the 10% error range suggested by ASTM standard E741. Tests 6 and 8 also show good agreement between ACHCO2 and ACHH20; errors were in the range 0.28–1.93 h−1 or 38–41%. When the ger was heated by the coal stove (Tests 2–5), there was worse agreement between ACHCO2 and ACHH20; errors were in the range 1.18–2.62 h−1 or 70–88%. In Test 7, the agreement between ACHCO2 and ACHH20 was also worse; the error was 3.98 h−1 or 76%.
4. Discussion
The published studies on the accuracy of water vapor tracer gas testing show errors of 0.086–39% relative to CO2 tracer gas testing (DeWalle and Heisler, 1980; Li et al., 2012; Xiong et al., 2021a). The results for tests 1, 6 and 8 showed similar errors (21–41%). The error range observed here is in line with the error range (7.4–143%) from the previously mentioned occupant-exhaled CO2 tracer gas studies (Bekö et al., 2016; Edouard et al., 2016; Men et al., 2020). As another benchmark, blower door tests are extremely common in research and industry, but they rely on empirical formulas to relate their results to air change rates at ambient pressure. Roberts et al. (2023) conducted a comprehensive study of the accuracy of 11 of the most popular empirical models in research and industry and found that all 11 overestimated the air change rates measured by CO2 tracer gas tests by 64–208% for a two-story, semi-detached house (Roberts et al., 2023).
However, in the presence of indoor combustion (Tests 2–5), the errors were higher (70–88%). It is possible that the chimney seal may have leaked during these tests, allowing exhaust gas containing CO2 and water vapor into the ger. Additionally, while the indoor humidity variation was small during those tests, the humidity variation during the 36 h before and after the tests was significantly higher (Table 2). This coupled with the higher temperatures during these tests (Table 2) may indicate that water vapor desorbed from the ger envelope, which would have compromised the assumptions discussed in Section 2.3. Test 7 also showed a higher error of 76%, but the reasons for this are less clear. It rained on the day before test 7 (March 25, 2019) in Philadelphia, and there appear to be a large fluctuation in the outdoor relative humidity prior to test 7 (Table 2). After a lag, depending on the moisture adsorbing properties of the materials, the large change in humidity likely caused moisture to adsorb and desorb from the ger envelope, compromising the assumptions in Section 2.3.
Furthermore, the accuracy of the water vapor tracer gas tests presented here is limited by the accuracy of the instrumentation and experimental procedures used. As was mentioned previously, the uniformity of the indoor CO2 concentration was not verified, so the error in the ACHCO2 is less straightforward to characterize.
5. Conclusions
Based on the tests presented here, water vapor appears to perform relatively well as a tracer gas for short time scale testing, only under the most ideal conditions. Indoor combustion and recent rainstorms were identified as conditions that might compromise the accuracy of water vapor tracer gas testing. Additional testing on other building types in other climates is still necessary to fully validate the use of water vapor as an unconventional tracer gas and identify other high error cases, where the technique is not applicable. That said, this technique may have utility in contexts where it is not possible to perform conventional tracer gas testing, and it is not possible to collect robust occupancy data for occupant-exhaled CO2 tracer gas tests. Further, if water vapor was fully validated as an unconventional tracer gas, it would be possible to use it for long-term passive monitoring to determine air change rates in buildings, as occupant-exhaled CO2 is sometimes used now. Like occupant-exhaled CO2, water vapor has the benefits of being non-toxic, relatively inexpensive and easy to monitor. This could promote more research into evaluating air change rates in buildings.
The supplementary material for this article can be found online.