Skip to article sections
Purpose

This study aims to evaluate beekeeping as a sustainable strategy to enhance resilience in East African agriculture by improving food security, livelihoods and pollination services. Using GIS-based analysis, it identifies climate-smart apiary sites, assesses current suitability and forecasts future conditions to support sustainable practices and climate adaptation.

Design/methodology/approach

This study sought to improve the robustness and adaptability of apiary site selection in Yabelo, Ethiopia and Taita-Taveta County, Kenya by using fuzzy Multicriteria Decision-Making methods under current climate and future low emission (SSP1-2.6) and high emission (SSP1-2.6) Shared Socioeconomic Pathways. By integrating these future climate scenarios, the authors assessed the future suitability of the apiary area under changing climate conditions.

Findings

The results revealed that under current climate conditions, 40.2% of the Yabelo area is highly suitable for beekeeping, with 43.6% and 16.2% being moderately and less suitable areas, respectively. On the other hand, Taita-Taveta County had higher current suitability, with 54.9% classified as highly suitable, 34.0% as moderately suitable and 11.2% as less suitable. Under SSP1-2.6 and SSP5-8.5 scenarios, highly suitable areas had a decreasing trend in both sites, whereas moderately and less suitable areas exhibited an increasing trend, reflecting the impact of climate change on apiary site variability. Despite these trends, Taita-Taveta County exhibited higher overall suitability than Yabelo. By anticipating future climate conditions, this study emphasized the importance of integrating climate projection into suitability analysis to ensure the long-term variability and resilience of beekeeping operations in East Africa.

Practical implications

This study highlights the role of beekeeping as a climate-resilient strategy to enhance livelihoods and food security in East Africa. Integrating climate projections allows policymakers to prioritize beekeeping through adaptive agricultural policies, while refined site selection methods help identify climate-suitable apiary locations. Targeted support for moderately suitable areas, along with broader adaptation strategies, will help sustain productivity and resilience in climate-sensitive regions, promoting long-term rural sustainability.

Originality/value

The manuscript was prepared based on the primary data and hence, it provides fresh insights.

East Africa is vulnerable to climate change, as this region is highly dependent on agriculture, which is already affected by rising temperatures and fluctuating rainfall (IPCC, 2014; Leal Filho et al., 2017; Natamba et al., 2018; Souverijns et al., 2016). This vulnerability is expected to increase as surface temperatures continue to rise. This will require not only mitigation measures but also adaptations to maintain food and nutrition security. Food achievement is not possible without access to income, and beekeeping is a recognized best practice for improving livelihoods among poor farming communities (Prodanović et al., 2024).

Beekeeping is a valuable practice for the livelihood diversity of agro-pastoral communities, as it provides sustainable low-cost income to support traditional agro-pastoral activities and playing an important role in crop development via pollinators living in woody landscapes, which increase overall agricultural productivity (Prodanović et al., 2024). Having apiaries requires less land and resources, which makes it more convenient even for smaller farms. Apiaries also promote environmental protection by encouraging the conservation of natural habitats, which are important for healthy bee populations (Hilmi et al., 2011).

As demand for honey and other bee-related products continues to increase, sustainable and strategic site selection for apiaries is important (Sari et al., 2020). Traditional apiary site selection relies on experiential knowledge of beekeepers, who consider factors such as presence of flowering plants, proximity to water sources and protection from harsh weather conditions. While this traditional approach is valuable, it can be limited by subjective biases and the inability to assess larger-scale environmental changes or the suitability of more distant locations (Komasilova et al., 2020). In contrast, Geographic Information Systems (GIS) allow analysis of extensive spatial data, including vegetation cover, land use, climate patterns and topography for more objective apiary site selection (Fotso Kamga et al., 2024; Tennakoon et al., 2023; Zoccali et al., 2017). GIS-based site selection can lead to more strategically located apiaries that maximize honey production and pollination efficiency while minimizing risks, thereby improving the sustainability and productivity of beekeeping operations. Fuzzy Multicriteria Decision-Making (MCDM) techniques provide a robust framework for integrating multiple criteria and accommodating uncertainty in decision-making (Tennakoon et al., 2023).

Climate change introduces significant uncertainty, affecting the long-term suitability of apiary sites by altering the availability of floral resources, water sources and suitable habitats for bees (Gallardo-López et al., 2021). Traditional methods of site selection often rely on local knowledge and static environmental assessments, which may not fully account for the dynamic and unpredictable nature of climate change. In contrast, modern approaches, such as GIS and fuzzy Multicriteria Decision-Making (MCDM), provide tools to incorporate complex data sets and future climate projections, bridging critical gaps in traditional methods.

The variability of temperature and precipitation due to climate change poses considerable challenges for beekeepers, who must adapt to evolving conditions that can impact honey production and colony health. Shared Socioeconomic Pathways (SSPs) offer a framework to analyze how various greenhouse gas emission trajectories influence future conditions. For instance, SSP1-2.6 represents a low-emission scenario where aggressive mitigation strategies limit global warming, leading to less severe ecosystem disruptions and more stable environmental conditions for apiaries. Conversely, SSP5-8.5 describes a high-emission scenario with minimal mitigation, resulting in significant temperature increases and extreme weather events that may drastically alter habitats and reduce the viability of traditional apiary sites (IPCC, 2021). Each scenario profoundly impacts key environmental variables critical to apiary site selection, such as forage plant availability, water resources and protection from extreme weather. This underscores the necessity of climate-informed planning and management in beekeeping activities to ensure long-term sustainability (Gebremedhn et al., 2024).

Apiary site selection can offer a more comprehensive perspective when traditional knowledge is integrated with GIS and fuzzy MCDM methodologies. This combined approach is vital for advancing site selection processes, enhancing resilience, supporting ecosystem stability and fostering sustainable beekeeping practices in the face of climate change uncertainties. Given security risks, the primary focus of this study was the application of fuzzy MCDM techniques for apiary site selection under current climate conditions and future scenarios (SSP1-2.6 and SSP5-8.5) in Yabelo, Ethiopia and Taita-Taveta County, Kenya. The study also sought to identify key factors influencing apiary site selection, evaluate current site suitability in these regions and assess the potential impacts of climate change scenarios on apiary viability.

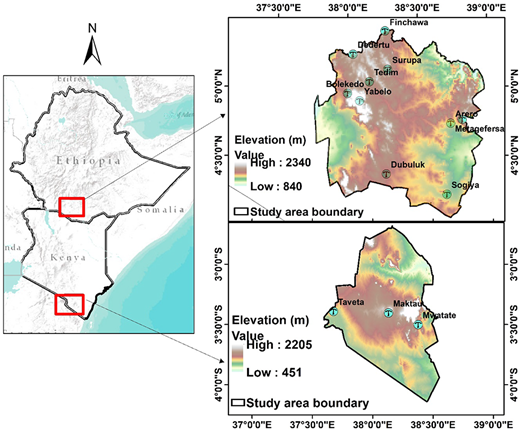
The study was conducted in Yabelo, the Borena Zone of the Oromia regional states, in southern Ethiopia and Taita-Taveta County (TTC), Kenya (Figure 1). Elevation in Yabelo ranges from 840 to 2,340 m above sea level. The area exhibits a bimodal precipitation pattern, with long rains between March and May and short rains between September and November. Average temperature varies from 17°C to 25°C with mean annual rainfall from 410 to 820 mm. The Borana plateau is dominated by savannah vegetation, with both woody and herbaceous vegetation. Common tree species include Acacia spp., Commiphora spp., Combretum spp., Cordia Africana, Terminalia spp., Aspilia spp., Albizia spp., Juniperus procera, Rhus spp., Boswellia spp. and Balanites aegyptica. Grasses and leguminous plant species include Andropogon gayanus, Hyparrhenia spp., Panicum spp., Crotalaria spp., Indigofera spp., Tephorsia spp. and Psoralea plicata, which are used as animal forage and may also be used by honey bees (Addi et al., 2014; Bareke and Addi, 2019b).

TTC is located in southern Kenya. We selected three subcounties within TTC, Wundanyi, Taveta and Mwatate, to provide a comprehensive analysis of apiary site suitability under current and future climate scenarios. The area has varied rainfall and topography, with lower elevation zones receiving an average 440 mm of rain annually and highland areas receiving up to 1,500 mm annually. The county ranges in altitude from 450 to 2,205 m above sea level, with Mt. Vuria being the highest point. The Taita Hills, situated within Kenya’s Eastern Arc Mountains, are characterized by high population density, leading to widespread agricultural and agroforestry activities. These land use practices have driven extensive deforestation throughout, especially in the hills. Consequently, the once continuous forest cover has been significantly reduced, leaving behind only small, isolated patches of forest. These remaining fragments are predominantly found at higher elevations near the mountain tops (Pellikka et al., 2013). The Taita Hills are home to a diverse array of native plant species, such as Tabernaemontana stapfiana, Macaranga capensis, Oxyanthus speciosus and Phoenix reclinata and Celtis Africana. Nonnative species, such as Eucalyptus spp., Pinus patula, Cupressus lusitanica and Acacia mearnsii, surround the montane forests (Amara et al., 2023).

The Taita Hills lowlands are situated within the extensive Tsavo ecosystem. This ecosystem includes key conservation areas, such as the Taita Hills Wildlife Sanctuary (THWS) and the LUMO Community Wildlife Sanctuary, both of which are crucial for maintaining large populations of livestock and wildlife. THWS is also notable for riverine forests, which provide essential habitats and support diverse species. Conversely, the areas outside these protected zones are predominantly used for dryland agriculture, sisal plantations (Vuorinne et al., 2021), livestock management (Wachiye et al., 2020) or are covered by Acacia-Commiphora bushland and thickets (Abera et al., 2023; Amara et al., 2023).

The study sites in Yabelo, Ethiopia and Taita-Taveta County (TTC), Kenya, offer favorable conditions for beekeeping, which supports community livelihoods and resilience. Yabelo’s savannah ecosystem, with diverse flora and moderate rainfall (410–820 mm annually), supports bee foraging and complements livestock livelihoods. Beekeeping diversifies income, mitigates climate impacts and promotes biodiversity. In TTC, varied rainfall (440–1,500 mm annually) and rich plant species provide ample forage, with diverse topography supporting local agriculture and conservation, making beekeeping a viable livelihood. Beekeeping boosts income diversification, food security through pollination and ecological resilience by supporting biodiversity. The involvement of local, refugee and pastoralist communities promotes social cohesion. By integrating GIS, fuzzy MCDM and traditional knowledge, this study identifies climate-smart apiary sites, ensuring the sustainability of beekeeping and enhancing community resilience to climate change.

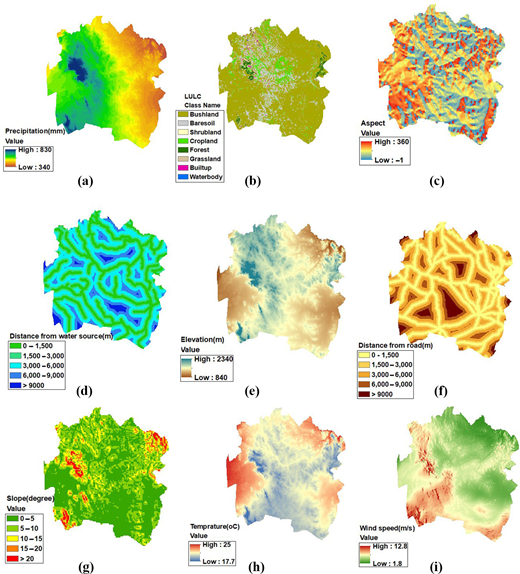
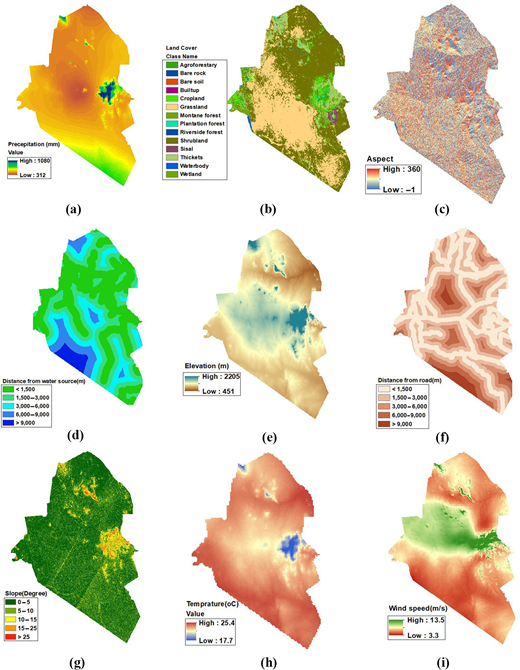
Defining environmental, meteorological and topographic requirements is crucial for identifying landscapes suitable for apiaries. This phase involves consulting the expertise of bee specialists, experienced beekeepers and local knowledge to ensure that the chosen sites will support effective beekeeping activities and maximize productivity (Fotso Kamga et al., 2024). Effective site selection relies on criteria and data based on proven beekeeping practices. We used nine specific criteria to analyze suitability, namely, forage sources, temperature, precipitation, distance from water sources, distance from roads, elevation, slope, aspect and wind speed. By considering these criteria, we wanted to identify the most conducive environments for sustainable and productive beekeeping operations. Data sources for different criteria are listed in Table 1 and visualized in Figures 2 and 3.

Food sources are important for bee health and productivity, as they provide pollen essential for honey production (Leponiemi et al., 2023). Forage availability and quality directly affect bee colony fitness and survival. A varied and abundant diet ensures that bees can have a balanced diet, which is essential for immune system function and lifespan. Plants bloom at different times of the year, providing a constant supply of resources and reducing the risk of food shortages (Pande and GI, 2018; Ricigliano et al., 2019; Parreño et al., 2022). The bee forage significantly influences the quality, type and quantity of honey produced. Accordingly, certain forage criteria should be given more weight than others. For pollen and nectar sources, beekeepers prefer a variety of landscapes, like forests, bushlands and shrublands. Grasslands are important for certain wildflowers that bloom at different times, providing seasonal resources for bees. In addition, croplands with flowering crops provide essential foraging resources, such as nectar and pollen, which bees need to survive or to produce honey (Sari et al., 2020).

Temperature is the most important predictor of bee behavior and overall health. Bees are ectothermic animals, whose body temperature and metabolic processes are greatly influenced by external temperatures. An optimal temperature range is essential for various bee activities, including foraging, brood rearing and hive maintenance (Clarke and Robert, 2018; Gebremedhn et al., 2024; Mishra et al., 2023; Simioni et al., 2015). Increasing temperature affects the internal dynamics of the bee colony by decreasing the number of bees inside, thereby reducing the overall bee density. This decline in bee density can hinder the colony’s ability to perform essential functions, which ultimately threatens the stability and sustainability of the bee population (Chabert et al., 2021; Karbassioon et al., 2023).

Precipitation plays an important role in determining the suitability of an area for beekeeping. Effective rainfall distribution is essential for growth of pollinators and pollinator food plants. Regular rainfall ensures a steady supply of floral resources, which is critical for sustaining bee populations and maintaining high honey production (Gebremedhn et al., 2024; Mishra et al., 2023). Excessive rainfall can reduce soil fertility and flowers, reducing nutrient availability (Kim et al., 2024). It can also increase the wetness of marshland, causing favorable conditions for mold growth and spread of insect diseases (Mishra et al., 2023). On the other hand, insufficient rainfall may lead to drought, reducing the number and diversity of food plants and disturbing honey bee colonies due to lack of resources (Frazier et al., 2024).

Windspeed can significantly impact foraging behavior and efficiency. Strong wind makes flight more difficult for bees, increasing energy expenditure and reducing food intake efficiency. In strong wind, bees struggle to navigate and remain stable, which can prevent them from finding and collecting nectar and pollen (Hennessy et al., 2020). Wind may present additional difficulties for bees, as they conduct numerous short flights between specific flowers or inflorescences, for example visiting between 250 and 1,446 flowers every trip. Foraging time can be increased exponentially even by a minor increase in the time required to travel between and to land on flowers due to wind-induced delays (Couvillon et al., 2015).

Elevation above sea level and land surface play a crucial role in determining suitable locations for beehives. Temperature variations, microclimate conditions, forage availability, wind exposure, water sources and pest management factors associated with different elevations (Olliff‐Yang and Ackerly, 2020; Tian, 2016; Zoccali et al., 2017).

Slope and aspect also have significant implications for beehive location and management in beekeeping. Drainage, stability, sun exposure, wind protection, accessibility and erosion control factors associated with slope gradients (Marnasidis et al., 2021; Doherty et al., 2021).

The distance from the road to beehive locations is a critical factor in beekeeping operations, impacting hive disturbance, safety and accessibility (Dietzel et al., 2023). Choose hive locations that strike a balance between road distance and accessibility, ensuring ease of transportation, equipment access and routine inspections while minimizing traffic-related disturbances (Bond et al., 2021).

Proximity to water sources improves foraging efficiency and productivity, supporting healthy bee colonies and increasing honey yields. Streams, rivers and dams are considered water sources. An adequate supply of water is necessary for beekeeping so that bees can maintain suitable hive temperature and produce honey efficiently (Dietzel et al., 2023).

Land suitability analyses frequently use multicriteria decision analysis (MCDA), which can handle several criteria and produce decisions based on human judgment. Many factors, such as the ecological demands of bees and the requirements for apiary management, must be considered (Tennakoon et al., 2023; Fotso Kamga et al., 2024; Gebremedhn et al., 2024).

Fuzzy Analytic Hierarchy Process (AHP) methods are extensions of the traditional AHP technique that incorporate fuzzy logic to handle uncertainty and vagueness in decision-making (Alaqeel and Suryanarayanan, 2018; Liu et al., 2020). Fuzzy AHP methods add another layer of flexibility by allowing decision-makers to express preferences in a more nuanced way. Similar to traditional AHP, the decision problem is structured hierarchically, with the main goal at the top, criteria in the middle and alternatives at the bottom (Sarkar et al., 2022). However, in fuzzy AHP, the linguistic terms or fuzzy numbers are used to represent the judgments of decision-makers about the importance of criteria and the performance of alternatives (Liu et al., 2020; Tennakoon et al., 2023). This research uses fuzzy AHP that integrates fuzzy logic with basic AHP. The advantages of both AHP and fuzzy logic are combined in this integrated method, which can handle the imprecision associated with conventional AHP, particularly when decisions are made under uncertainty (Nuhu et al., 2022; Tennakoon et al., 2023).

The pairwise comparison matrix was prepared using linguistics developed by Tennakoon et al. (2023) (Table 2). Fuzzy AHP can translate linguistic terms into Triangular Fuzzy Numbers (TFN) (Chang, 1996; Zamani-Sabzi et al., 2016; Sarkar et al., 2022), which is known as fuzzification. TFN consists of three integers that includes the smallest possible value, the most probable value and the largest possible value [Equation (1)] (Sarkar et al., 2022). The inverse of a TFN is used when the relative importance of criterion “j” over criterion “i” is expressed [Equation (2)] (Wang and Chen, 2008):

(1)
(2)

In the present study, a geometric mean method introduced by Buckley (1985) was used to calculate the fuzzy weight of each criterion [Equation (3)].

The fuzzy geometric mean value ri for each criterion nth is computed as:

(3)

where ln, mn and un are the smallest possible value, the most probable value and the largest possible value of the nth criterion (such as, forage source, distance from water source and precipitation), respectively, and n is the number of criteria.

The fuzzy weight wi for each criterion i is calculated as:

(4)

where ri is the fuzzy geometric mean value of the ith criterion.

Once the pairwise comparisons are made, the fuzzy judgments are aggregated to derive the overall priority or ranking of criteria and alternatives. This often involves defuzzification, which is the process of converting fuzzy sets into crisp values. The most common method of defuzzification is the center of area (CoA) method [Equation (5)] (Buckley, 1985). The fuzzy weights wi = (li,mi,ui) are defuzzified by any defuzzification method; here we used the CoA method as follows:

(5)

The weight of every criterion is normalized by dividing each weight by the summation of weights.

The vector layers were converted into raster format and subsequently resampled to a uniform 30 x 30 m resolution, ensuring consistency across layers for effective overlay analysis using ArcGIS 10.8 software. The Fuzzy Analytic Hierarchy Process (Fuzzy AHP) calculations were performed using MS Excel.

The main criteria represent factors influencing honey bee habitat suitability, with assigned weights indicating their relative importance in the assessment process (Table 3). In addition to the main criteria, their corresponding weights, subcriteria and suitability values for evaluating honey bee habitat suitability, several subcriteria are listed, each with assigned suitability values (highly, moderately or less) indicating the suitability of the habitat based on that specific criterion.

Future land suitability assessment aims to evaluate land suitability for sustainable honey production in the future. Assuming consistent forest management over time, the focus is on evaluating the impact of future climate change on beekeeping. Various methods exist for projecting climate change impacts on honey bees, given the challenge of integrating local-scale models with coarse GCM projections. Most impact models require high-resolution climate data, especially temperature and precipitation (Navarro-Racines et al., 2020).

We used climatic variables, such as rainfall and temperature, from the WorldClim database (The Marketing JournalLink to the website of worldclim), which provides historical and future data on rainfall, temperature and other climatic variables. These data are based on the Coupled Model Intercomparison Project Phase 6 (CMIP6) Shared Socioeconomic Pathways (SSPs) projections. The database offers high spatial resolutions, which allow for detailed and precise climate modeling. By using WorldClim version 2.1 with a 30-s spatial resolution, the analysis can capture small-scale climatic variations crucial for assessing habitat suitability for beekeeping.

The model was configured to cover two future prediction periods (2021–2040 and 2061–2080). The inclusion of two distinct periods allows for analysis of both short-term and long-term climate impacts on beekeeping suitability. For future projections, the study focused on two SSP scenarios: SSP1-2.6 and SSP5-8.5. SSP1-2.6 represents a low-emission scenario, aiming to keep global warming well below 2°C above pre-industrial levels, reflecting a world with strong climate policies and sustainable practices. In contrast, SSP5-8.5 is an extreme emission scenario, assuming continued high greenhouse gas emissions and resulting in significant global warming (IPCC, 2021). This dual approach allows for an analysis of how different emission trajectories might affect beekeeping suitability.

To ensure reliable projections, the study selected three general circulation models (GCMs) known for their performance in East Africa (CMCC-ESM2, HadGEM3-GC31-LL, MPI-ESM1-2-HR) (Table 4). These models were chosen based on their ability to accurately simulate climatic conditions in the region (Kogo et al., 2019; Yebeyen et al., 2022; Jimma et al., 2024). By using multiple GCMs, the study incorporates a range of potential outcomes, enhancing the reliability of the predictions. This method provides a comprehensive understanding of how varying climatic conditions could influence beekeeping suitability in different future scenarios, enabling better planning and adaptation strategies for beekeepers in East Africa.

Data for model validation were obtained from the International Centre of Insect Physiology and Ecology (icipe) and field observations, providing detailed records of honey bee occurrences and managed apiary locations (see  Appendix). This data served as a critical foundation for assessing the accuracy of the apiary site suitability model. By using this data set, we aimed to validate the model’s predictions under current climate conditions.

The validation process involves analyzing the intersection of existing apiary locations with the predicted suitability classes under both current and future climate conditions. For the current suitability analysis, we mapped existing apiary locations onto the model’s current suitability classifications (highly, moderately and less) to determine the alignment between observed beekeeping activities and model predictions. Future suitability analysis followed a similar procedure, evaluating how the distribution of existing apiary locations shifts across suitability classes under climate scenarios SSP1-2.6 and SSP5-8.5 for the periods 2021–2040 and 2061–2080.

Evaluation metrics were focused on the percentage distribution of apiary locations within each suitability class and the spatial intersection of these locations with suitability predictions. We calculate the percentage of existing apiary sites in highly, moderately and less suitable areas.

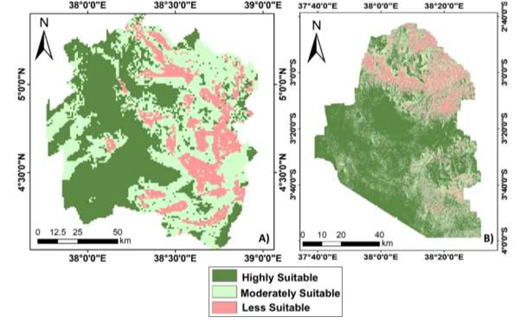
The modeled apiary suitability analysis for the study sites Yabelo and Taita-Taveta provides a comparative overview of their current potential for supporting honey bee colonies (Figure 4). For Yabelo, 40.2% of the area is classified as highly suitable for apiaries, indicating that nearly half of the region offers optimal conditions for beekeeping; 43.6% of the area is moderately suitable and the remaining 16.2% is deemed less suitable.

In contrast, the Taita-Taveta site exhibits a higher overall suitability for apiaries. Here, 54.89% of the area is classified as highly suitable, reflecting a more extensive proportion of the region with ideal conditions for honey bee habitation and productivity. Additionally, 33.9% of the area is categorized as moderately suitable, indicating that a significant portion of Taita-Taveta also supports beekeeping, although not at the highest level of suitability. Only 11.2% of the area is less suitable, which is a smaller proportion than Yabelo.

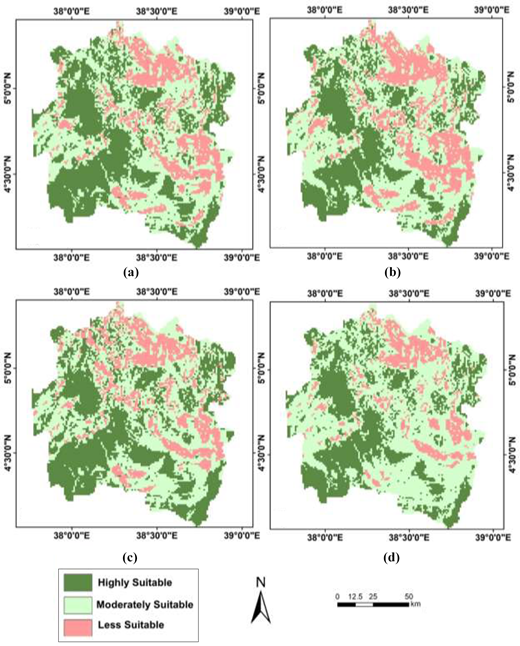
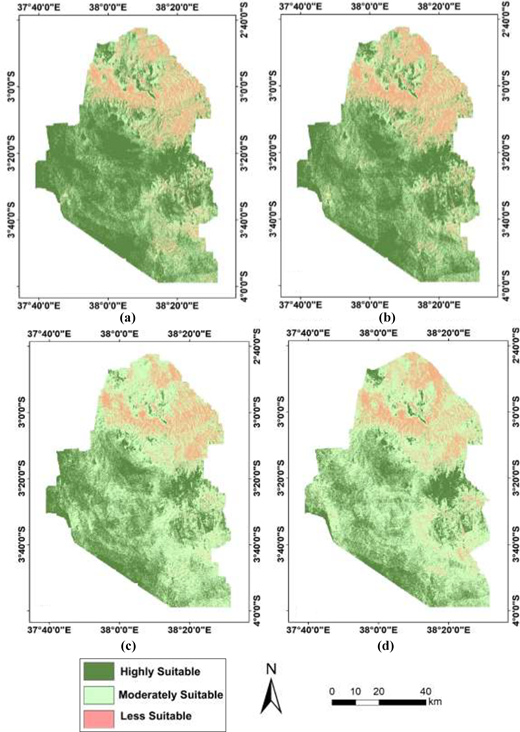
Analysis of apiary suitability at the Yabelo and Taita-Taveta study sites over different time periods and under various SSPs revealed notable trends and shifts in suitability categories (Table 5). For the Yabelo site under the SSP1-2.6 scenario, the highly suitable area decreased from 38.2% in 2021–2040 to 32.5% in 2061–2080. During the same periods, the moderately suitable area increased slightly from 44.0% to 45.9% and the less suitable area increased from 17.8% to 21.6%. This trend indicates a gradual decline in optimal conditions for apiaries. Similarly, under the SSP5-8.5 scenario, the Yabelo site experienced a decrease in highly suitable areas from 38.5% in 2021–2040 to 32.6% in 2061–2080. Whereas the moderately suitable areas increased from 43.9% to 55.3%, the less suitable areas decreased from 17.6% to 12.1%. This shift suggests that while the overall suitability becomes less optimal, there is a significant increase in moderately suitable areas, indicating a redistribution of suitability rather than an overall decline (Figure 5).

In contrast, the Taita-Taveta site under the SSP1-2.6 scenario showed a slight decrease in highly suitable areas, from 53.6% in 2021–2040 to 51.5% in 2061–2080. The moderately suitable areas had a marginal increase from 34.6% to 35.5% and the less suitable areas increased from 11.8% to 13%. Although there was a reduction in highly suitable areas, Taita-Taveta remains predominantly favorable for beekeeping, with most areas still offering good to moderate conditions (Figure 6). Under the SSP5-8.5 scenario, there was a notable decrease in highly suitable areas from 34% in 2021–2040 to 27.8% in 2061–2080. However, the moderately suitable areas increased dramatically from 56.3% to 61.4%, while the less suitable areas experienced a slight increase from 9.7% to 10.8%. Although this indicates a major shift toward moderate suitability, the overall area remains largely viable for apiary activities.

Evaluation of current and future suitability of existing beehive locations of Yabelo and Taita-Taveta under different climate change scenarios provide insights into how climate change may impact the productivity and sustainability of these apiary sites (Table 6). In Yabelo, the current suitability analysis shows 73.3% of honey bee occurrences in highly suitable areas, with 13.3% each in moderately and less suitable areas. The highly suitable area decreased over time under both SSP1-2.6 and SSP5-8.5 scenarios. These trends suggest that Yabelo is more susceptible to reductions in highly suitable areas than Taita-Taveta, particularly under high-emission scenarios.

Under the current conditions, 43 (58.9%) of the existing beehive locations in Taita-Taveta are classified as highly suitable, 24 (32.9%) as moderately suitable, and 6 (8.2%) as less suitable. These results suggest that most of the current beehive locations are well-positioned for optimal beekeeping conditions.

The distribution of suitability remained relatively stable in the low-emission scenario (SSP1-2.6) for the periods 2021–2040 and 2061–2080. The moderately and less suitable classifications also showed minor changes. In the high-emission scenario (SSP5-8.5), there was a notable decline in the percentage of highly suitable areas.

Consistent with previous studies (Zoccali et al., 2017; Bareke and Addi, 2019a; Sari et al., 2020; Tennakoon et al., 2023; Gebremedhn et al., 2024), we observed that areas that are highly suitable for apiary sites are strongly correlated with the presence of forage sources, emphasizing the significant role of flowering species in determining suitability for honey bees.

Highly suitable habitats are typically associated with forested areas, bushland and shrubland. These ecosystems offer abundant floral resources and nesting sites essential for foraging activities. Studies indicate that diverse and dense vegetation supports higher bee diversity and abundance, making these habitats highly conducive for honey bees (Bartholomée et al., 2020). In contrast, grasslands, while providing moderate resources, do not offer the same level of floral diversity and nesting opportunities and are thus considered moderately suitable. Croplands, often characterized by monocultures and pesticide use, are less suitable due to limited floral resources and higher exposure to harmful chemicals (Bond et al., 2021; Brühl et al., 2021; Janousek et al., 2023).

Proximity to water sources significantly impacts honey bee habitat suitability. Similar studies have emphasized the importance of water access for bees, particularly concerning their needs for cooling, brood rearing and feeding. Maintaining water sources within close proximity to bee habitats improve the sustainability of honey bee colonies (Tian, 2016; Fotso Kamga et al., 2024). Rainfall levels are directly correlated with habitat suitability for honey bees. Regions receiving higher rainfall are highly suitable as they support vegetation and continuous floral availability, which are crucial for bee nutrition (Balvino‐Olvera et al., 2024). Conversely, areas with lower rainfall are less suitable due to sparse vegetation and limited floral resources, which affects the bees’ ability to sustain their colonies throughout the year (Frazier et al., 2024).

The forage source criterion was given the highest weight in the fuzzy AHP analysis, consistent with findings of earlier studies (Sarı et al., 2020; Tennakoon et al., 2023). Consequently, incorporating information about floral resources is paramount when devising a methodology for identifying suitable apiary locations. Weather variations significantly impact forage availability, directly influencing bee success (Mishra et al., 2023; Sari et al., 2020; Tennakoon et al., 2023). Additionally, research indicates that rising temperatures can adversely affect forage presence, leading to increased stress on bees, reduced foraging efficiency and higher mortality rates. Therefore, maintaining moderate temperatures is essential for supporting healthy bee populations (Sari et al., 2020; Mishra et al., 2023; Tennakoon et al., 2023).

Climate change is increasingly recognized as a significant threat to honey bee populations, primarily due to its impact on the diversity and availability of plants essential for bees to collect pollen and nectar (Bertrand et al., 2011; Mishra et al., 2023). Our study supports these concerns, revealing a clear decline in the suitability of areas for beekeeping due to the effects of climate change under both climate change scenarios.

The future projections for honey bee habitat suitability in both study sites under the SSP5-8.5 scenario revealed a significant shift in suitability categories, with a decrease in highly suitable areas and an increase in both moderately and less suitable areas from 2021–2040 to 2061–2080. This redistribution of suitability suggests a nuanced impact of climate change, emphasizing a transformation in habitat quality rather than an outright decline in extreme climate scenarios, which leads to a reshaping of habitat suitability rather than a complete deterioration (Conrad et al., 2021). Additionally, Dupont et al. (2022) observed that while high-emission scenarios exacerbate climate stressors, they often result in a shift toward less optimal conditions rather than an absolute loss of habitat. This aligns with our results, which indicate that while highly suitable areas are diminishing, the expansion of moderately suitable zones suggests a more complex scenario where habitat quality is redistributed rather than entirely lost. However, the decrease in highly suitable areas points to potential challenges in maintaining peak honeybee productivity and health, as extreme temperature and precipitation increases may stress bee populations (Gebreyohans and Gebremariam, 2017; Gebremedhn et al., 2024).

Validating the results of beehive suitability revealed significant trends in how climate change may impact existing beehive locations in the future. The observed decrease in the existing beehive locations from highly suitable areas in Yabelo aligns with climate change, such as higher temperatures and altered precipitation patterns, leading to reduced habitat quality for honey bees (Conrad et al., 2021). In contrast, the stability of beehive locations in Taita-Taveta under the low-emission scenario (SSP1-2.6) and the relative decline under the high-emission scenario (SSP5-8.5) shows the regions experiencing moderate climate impacts tend to maintain more stable habitat conditions than areas under climate change (Frazier et al., 2024).

This study underscores beekeeping as a climate-resilient strategy that can enhance livelihoods and food security in East Africa. Integrating climate projections into site selection and beekeeping practices allows policymakers to prioritize beekeeping in areas with favorable conditions, enabling communities to better adapt to climate change. Refining site selection with tools like GIS and fuzzy MCDM can identify optimal apiary locations, ensuring productivity and ecological resilience. Targeted support for moderately suitable areas can boost local economies, promoting beekeeping as a climate-resilient livelihood that reduces reliance on climate-sensitive activities. Broader adaptation strategies, such as training and access to resources, can further strengthen community resilience. Ultimately, integrating beekeeping into climate adaptation plans supports long-term sustainability, fosters social cohesion and contributes to economic growth in rural communities.

The limitations of this study stem from the lack of comprehensive honey bee location data, as most records come from managed apiary sites that may not reflect the natural distribution of honey bees. While these sites are assumed to represent favorable conditions for honey bees, they may not capture the full range of environmental factors supporting wild populations. To improve the reliability and validity of the research, a mixed-methods approach could be adopted. Integrating GIS, fuzzy MCDM and additional data sources such as remote sensing or citizen science can provide a more holistic view of honey bee distribution. GIS can map environmental variables, while fuzzy MCDM evaluates the suitability of sites for both managed and wild populations. Incorporating local knowledge and field surveys will further validate the findings, ensuring a more accurate representation of both managed and natural habitats. This approach would enhance the study’s robustness and provide a clearer understanding of honey bee habitat suitability.

Another important limitation is the potential bias introduced by relying solely on managed apiary locations. These sites are often chosen based on practical considerations for beekeeping rather than purely ecological suitability, which may skew the analysis of habitat preferences and suitability under changing climate conditions. Additionally, managed apiaries may be subject to human interventions that do not reflect the natural foraging and nesting behaviors of wild honey bees. This study would benefit from incorporating honey bee occurrence data from natural, unmanaged locations. To address this limitation, future research should aim to gather and integrate occurrence data from wild honey bee populations. Expanding the data set to include wild honey bee locations would significantly strengthen the study’s conclusions and its applicability to broader conservation and management efforts.

Climate change poses a significant threat to the development of East Africa and particularly affects agriculture, which is a basis of food and income security for the agro-pastoral community. Suitable adaptation strategies are essential to mitigate these impacts and ensure the resilience of these communities. One promising and sustainable practice is beekeeping, which not only generates income but also improves food security through essential pollination services. By integrating beekeeping into their livelihoods, agro-pastoralists can improve their economic stability and contribute to the health of their ecosystems.

Climate change presents significant challenges to honey bee habitat suitability. The resilience observed in moderately suitable areas suggests that there are opportunities for adaptation. The insights gained from this study can guide future research and policy development to support beekeeping in evolving climatic conditions. By implementing adaptive strategies, the long-term viability of agricultural practices and the protectection of livelihoods of agro-pastoral communities in East Africa can be ensured. This study reinforces the critical role of adaptive planning in safeguarding the stability of ecosystems and agricultural systems that rely on pollination, contributing to overall resilience against climate change. This study highlights the role of beekeeping as a climate-resilient strategy to enhance livelihoods and food security in East Africa. Integrating climate projections allows policymakers to prioritize beekeeping through adaptive agricultural policies, while refined site selection methods help identify climate-suitable apiary locations. Targeted support for moderately suitable areas, along with broader adaptation strategies, will help sustain productivity and resilience in climate-sensitive regions, promoting long-term rural sustainability.

This study was funded by a European Union grant under the ESSA project (Earth Observation and Environmental Sensing for climate-smart sustainable agro-pastoral Ecosystem Transformation in East Africa) (FOOD/2020/418-132). The authors acknowledge support provided by the University of Helsinki, Addis Ababa University, Taita Research Station, NACOSTI and the International Centre of Insect Physiology and Ecology (icipe).

Abera
,
T.
,
Heiskanen
,
J.
,
Maeda
,
E.
,
Odongo
,
V.
and
Pellikka
,
P.
(
2023
), “
Impacts of land cover and management change on top-of-canopy and below-canopy temperatures in southeastern Kenya
”,
Science of The Total Environment
, Vol.
874
, p.
162560
, doi: .
Addi
,
A.
,
Wakjira
,
K.
,
Ensermu
,
K.
, and
Amssalu
,
B.
(
2014
),
Honeybee Forages of Ethiopia (Ethiopia)
,
Holeta Bee Research Centre
.
Alaqeel
,
T.A.
and
Suryanarayanan
,
S.
(
2018
), “
A fuzzy analytic hierarchy process algorithm to prioritize smart grid technologies for the saudi electricity infrastructure
”,
Sustainable Energy, Grids and Networks
, Vol.
13
, pp.
122
-
133
, doi: .
Amara
,
E.
,
Adhikari
,
H.
,
Mwamodenyi
,
J.M.
,
Pellikka
,
P.K.E.
and
Heiskanen
,
J.
(
2023
), “
Contribution of tree size and species on aboveground biomass across land cover types in the Taita hills, Southern Kenya
”,
Forests
, Vol.
14
No.
3
, p.
642
, doi: .
Balvino‐Olvera
,
F.J.
,
Olivares‐Pinto
,
U.
,
González‐Rodríguez
,
A.
,
Aguilar‐Aguilar
,
M.J.
,
Ruiz‐Guzmán
,
G.
,
Lobo‐Segura
,
J.
,
Cortés‐Flores
,
J.
,
Cristobal‐Perez
,
E.J.
,
Martén‐Rodríguez
,
S.
,
Patiño‐Conde
,
V.
and
Quesada
,
M.
(
2024
), “
Effects of floral resources on honey bee populations in Mexico: Using dietary metabarcoding to examine landscape quality in agroecosystems
”,
Ecology and Evolution
, Vol.
14
No.
6
, p.
e11456
, doi: .
Bareke
,
T.
and
Addi
,
A.
(
2019a
), “
Bee flora resources and honey production calendar of Gera forest in Ethiopia
”,
Asian Journal of Forestry
, Vol.
3
No.
2
, pp.
69
-
74
.
Bareke
,
T.
and
Addi
,
A.
(
2019b
), “
Pollen analysis of honey from Borana zone of Southern Ethiopia
”,
Journal of Apicultural Science
, Vol.
63
No.
2
, pp.
233
-
242
, doi: .
Bartholomée
,
O.
,
Aullo
,
A.
,
Becquet
,
J.
,
Vannier
,
C.
and
Lavorel
,
S.
(
2020
), “
Pollinator presence in orchards depends on landscape-scale habitats more than in-field flower resources
”,
Agriculture, Ecosystems and Environment
, Vol.
293
, p.
106806
, doi: .
Bertrand
,
R.
,
Lenoir
,
J.
,
Piedallu
,
C.
,
Riofrío-Dillon
,
G.
,
De Ruffray
,
P.
,
Vidal
,
C.
,
Pierrat
,
J.-C.
and
Gégout
,
J.-C.
(
2011
), “
Changes in plant community composition lag behind climate warming in lowland forests
”,
Nature
, Vol.
479
No.
7374
, pp.
517
-
520
, doi: .
Bond
,
J.K.
,
Hitaj
,
C.
,
Smith
,
D.
,
Hunt
,
K.
,
Perez
,
A.
and
Ferreira
,
G.
(
2021
), “
Honey bees on the move: from pollination to honey production and back
”, doi:
Brühl
,
C.A.
,
Bakanov
,
N.
,
Köthe
,
S.
,
Eichler
,
L.
,
Sorg
,
M.
,
Hörren
,
T.
,
Mühlethaler
,
R.
,
Meinel
,
G.
and
Lehmann
,
G.U.C.
(
2021
), “
Direct pesticide exposure of insects in nature conservation areas in Germany
”,
Scientific Reports
, Vol.
11
No.
1
, p.
24144
, doi: .
Buckley
,
J.J.
(
1985
), “
Fuzzy hierarchical analysis
”,
Fuzzy Sets and Systems
, Vol.
17
No.
3
, pp.
233
-
247
, doi: .
Chabert
,
S.
,
Requier
,
F.
,
Chadoeuf
,
J.
,
Guilbaud
,
L.
,
Morison
,
N.
and
Vaissière
,
B.E.
(
2021
), “
Rapid measurement of the adult worker population size in honey bees
”,
Ecological Indicators
, Vol.
122
, p.
107313
, doi: .
Chang
,
D.-Y.
(
1996
), “
Applications of the extent analysis method on fuzzy AHP
”,
European Journal of Operational Research
, Vol.
95
No.
3
, pp.
649
-
655
, doi: .
Clarke
,
D.
and
Robert
,
D.
(
2018
), “
Predictive modelling of honey bee foraging activity using local weather conditions
”,
Apidologie
, Vol.
49
No.
3
, pp.
386
-
396
, doi: .
Conrad
,
K.M.
,
Peters
,
V.E.
and
Rehan
,
S.M.
(
2021
), “
Tropical bee species abundance differs within a narrow elevational gradient
”,
Scientific Reports
, Vol.
11
No.
1
, p.
23368
, doi: .
Couvillon
,
M.J.
,
Walter
,
C.M.
,
Blows
,
E.M.
,
Czaczkes
,
T.J.
,
Alton
,
K.L.
and
Ratnieks
,
F.L.W.
(
2015
), “
Busy bees: Variation in insect flower-visiting rates across multiple plant species
”,
Psyche: A Journal of Entomology
, Vol.
2015
, pp.
1
-
7
, doi: .
Dietzel
,
S.
,
Rojas-Botero
,
S.
,
Kollmann
,
J.
and
Fischer
,
C.
(
2023
), “
Enhanced urban roadside vegetation increases pollinator abundance whereas landscape characteristics drive pollination
”,
Ecological Indicators
, Vol.
147
, p.
109980
, doi: .
Doherty
,
K.D.
,
Kuhlman
,
M.P.
,
Durham
,
R.A.
,
Ramsey
,
P.W.
and
Mummey
,
D.L.
(
2021
), “
Fine-grained topographic diversity data improve site prioritization outcomes for bees
”,
Ecological Indicators
, Vol.
132
, p.
108315
, doi: .
Dupont
,
L.M.
,
Zhao
,
X.
,
Charles
,
C.
,
Faith
,
J.T.
and
Braun
,
D.
(
2022
), “
Continuous vegetation record of the greater cape floristic region (South Africa) covering the past 300 000 years (IODP U1479)
”,
Climate of the Past
, Vol.
18
No.
1
, pp.
1
-
21
, doi: .
Fick
,
S.E.
and
Hijmans
,
R.J.
(
2017
), “
WorldClim 2: new 1-km spatial resolution climate surfaces for global land areas
”,
International Journal of Climatology
, Vol.
37
No.
12
, pp.
4302
-
4315
, doi: .
Fotso Kamga
,
G.A.
,
Bouroubi
,
Y.
,
Germain
,
M.
,
Mbom
,
A.M.
and
Chagnon
,
M.
(
2024
), “
Expert knowledge-based modelling approach for mapping beekeeping suitability area
”,
Ecological Informatics
, Vol.
80
, p.
102530
, doi: .
Frazier
,
M.
,
Muli
,
E.
and
Patch
,
H.
(
2024
), “
Ecology and management of African honey bees (Apis mellifera L
”,
Annual Review of Entomology
, Vol.
69
No.
1
, pp.
439
-
453
, doi: .
Gallardo-López
,
F.
,
Castellanos-Potenciano
,
B.P.
,
Díaz-Padilla
,
G.
,
Pérez-Vázquez
,
A.
,
Landeros-Sánchez
,
C.
and
Sol-Sánchez
,
Á.
(
2021
), “
Disonancia cognitiva ante el cambio climático en apicultores: Un caso de estudio en méxico
”,
Revista Mexicana de Ciencias Pecuarias
, Vol.
12
No.
1
, pp.
238
-
255
, doi: .
Gebremedhn
,
H.
,
Gebrewahid
,
Y.
,
Haile
,
G.G.
,
Hadgu
,
G.
,
Atsbha
,
T.
,
Hailu
,
T.G.
and
Bezabih
,
G.
(
2024
), “
Projecting the impact of climate change on honey bee plant habitat distribution in Northern Ethiopia
”,
Scientific Reports
, Vol.
14
No.
1
, p.
15866
, doi: .
Gebreyohans
,
K.W.
and
Gebremariam
,
T.T.
(
2017
), “
Beekeeping management practices and constraints in Eastern Tigray
”,
Ethiopia. Journal of Agriculture and Environment for International Development (JAEID)
, Vol.
111
No.
2
, doi: .
Hennessy
,
G.
,
Harris
,
C.
,
Eaton
,
C.
,
Wright
,
P.
,
Jackson
,
E.
,
Goulson
,
D.
and
Ratnieks
,
F.F.L.W.
(
2020
), “
Gone with the wind: effects of wind on honey bee visit rate and foraging behaviour
”,
Animal Behaviour
, Vol.
161
, pp.
23
-
31
, doi: .
Hilmi
,
M.
,
Bradbear
,
N.
, and
Mejía-Lorío
,
D.J.
(
2011
),
Beekeeping and Sustainable Livelihoods
, (2nd ed) .,
FAO
.
IPCC
(
2021
),
Climate Change 2021 – The Physical Science Basis: Working Group I Contribution to the Sixth Assessment Report of the Intergovernmental Panel on Climate Change
, (1st ed) .,
Cambridge University Press
, doi: .
Ipcc
,
I.
(
2014
), “
The IPCC’s fifth assessment report – what’s in it for Africa, executive summary, climate and development knowledge network (CDKN)
”.
Janousek
,
W.M.
,
Douglas
,
M.R.
,
Cannings
,
S.
,
Clément
,
M.A.
,
Delphia
,
C.M.
,
Everett
,
J.G.
,
Hatfield
,
R.G.
,
Keinath
,
D.A.
,
Koch
,
J.B.U.
,
McCabe
,
L.M.
,
Mola
,
J.M.
,
Ogilvie
,
J.E.
,
Rangwala
,
I.
,
Richardson
,
L.L.
,
Rohde
,
A.T.
,
Strange
,
J.P.
,
Tronstad
,
L.M.
and
Graves
,
T.A.
(
2023
), “
Recent and future declines of a historically widespread pollinator linked to climate, land cover, and pesticides
”,
Proceedings of the National Academy of Sciences
, Vol.
120
No.
5
, p.
e2211223120
, doi: .
Jimma
,
T.
,
Chemura
,
A.
,
Spillane
,
C.
,
Demissie
,
T.
,
Abera
,
W.
,
Ture
,
K.
,
Terefe
,
T.
,
Solomon
,
D.
and
Gleixner
,
S.
(
2024
), “
Coupled impacts of soil acidification and climate change on future crop suitability in Ethiopia
”,
Sustainability
, Vol.
16
No.
4
, p.
1468
, doi: .
Karbassioon
,
A.
,
Yearlsey
,
J.
,
Dirilgen
,
T.
,
Hodge
,
S.
,
Stout
,
J.C.
and
Stanley
,
D.A.
(
2023
), “
Responses in honeybee and bumblebee activity to changes in weather conditions
”,
Oecologia
, Vol.
201
No.
3
, pp.
689
-
701
, doi: .
Kim
,
Y.-U.
,
Webber
,
H.
,
Adiku
,
S.G.K.
,
Nóia Júnior
,
R.D.S.
,
Deswarte
,
J.-C.
,
Asseng
,
S.
and
Ewert
,
F.
(
2024
), “
Mechanisms and modelling approaches for excessive rainfall stress on cereals: waterlogging, submergence, lodging, pests and diseases
”,
Agricultural and Forest Meteorology
, Vol.
344
, p.
109819
, doi: .
Kogo
,
B.K.
,
Kumar
,
L.
,
Koech
,
R.
and
Kariyawasam
,
C.S.
(
2019
), “
Modelling climate suitability for rainfed maize cultivation in Kenya using a maximum entropy (MaxENT) approach
”,
Agronomy
, Vol.
9
No.
11
, p.
727
, doi: .
Komasilova
,
O.
,
Komasilovs
,
V.
,
Kviesis
,
A.
,
Bumanis
,
N.
,
Mellmann
,
H.
and
Zacepins
,
A.
(
2020
), “
Model for the bee apiary location evaluation [PDF]. 804.6Kb
”, doi: .
Leal Filho
,
W.
,
Nzengya
,
D.
,
Muasya
,
G.
,
Chemuliti
,
J.
and
Kalungu
,
J.W.
(
2017
), “
Climate change responses among the maasai community in Kenya
”,
Climatic Change
, Vol.
145
Nos
1-2
, pp.
71
-
83
, doi: .
Leponiemi
,
M.
,
Freitak
,
D.
,
Moreno-Torres
,
M.
,
Pferschy-Wenzig
,
E.-M.
,
Becker-Scarpitta
,
A.
,
Tiusanen
,
M.
,
Vesterinen
,
E.J.
and
Wirta
,
H.
(
2023
), “
Honeybees’ foraging choices for nectar and pollen revealed by DNA metabarcoding
”,
Scientific Reports
, Vol.
13
No.
1
, p.
14753
, doi: .
Liu
,
Y.
,
Eckert
,
C.M.
and
Earl
,
C.
(
2020
), “
A review of fuzzy AHP methods for decision-making with subjective judgements
”,
Expert Systems with Applications
, Vol.
161
, p.
113738
, doi: .
Marnasidis
,
S.
,
Kantartzis
,
A.
,
Malesios
,
C.
,
Hatjina
,
F.
,
Arabatzis
,
G.
and
Verikouki
,
E.
(
2021
), “
Mapping priority areas for apiculture development with the use of geographical information systems
”,
Agriculture
, Vol.
11
No.
2
, p.
182
, doi: .
Mengistu
,
F.
,
Hailu
,
B.T.
,
Abera
,
T.A.
,
Heiskanen
,
J.
,
Zeleke
,
T.T.
,
Johansson
,
T.
and
Pellikka
,
P.K.E.
(
2024
),
Improving the Accuracy of Honey Bee Habitat Mapping Using Ensemble Learning and Multi-Source Satellite Data in Google Earth Engine
, doi: .
Mishra
,
D.M.
,
Bhunia
,
P.
,
Shubham
,
S.
,
Sen
,
R.
,
Bhunia
,
R.
,
Gulia
,
J.
,
Mondal
,
T.
,
Zidane
,
Z.
,
Saha
,
T.
,
Chacko
,
A.
,
Raj
,
R.
,
S.
,
V.S.
and
Kaushal
,
L.
, (
2023
), “
The impact of weather change on honey bee populations and disease
”,
Journal of Advanced Zoology
, Vol.
44
No.
S7
, pp.
180
-
190
, doi: .
Navarro-Racines
,
C.
,
Tarapues
,
J.
,
Thornton
,
P.
,
Jarvis
,
A.
and
Ramirez-Villegas
,
J.
(
2020
), “
High-resolution and bias-corrected CMIP5 projections for climate change impact assessments
”,
Scientific Data
, Vol.
7
No.
1
, p.
7
, doi: .
Natamba
,
L.
,
Zhang
,
W.
,
Zhang
,
J.
and
Zhao
,
X.
(
2018
), “
Climate change causing food insecurity in east africa: traditional and non-traditional strategies to solve the problem
”,
Applied Ecology and Environmental Research
, Vol.
16
No.
3
, pp.
2233
-
2254
, doi: .
Nuhu
,
S.K.
,
Manan
,
Z.A.
,
Wan Alwi
,
S.R.
and
Md Reba
,
M.N.
(
2022
), “
Integrated modelling approach for an eco-industrial park site selection
”,
Journal of Cleaner Production
, Vol.
368
, p.
133141
, doi: .
Olliff‐Yang
,
R.L.
and
Ackerly
,
D.D.
(
2020
), “
Topographic heterogeneity lengthens the duration of pollinator resources
”,
Ecology and Evolution
, Vol.
10
No.
17
, pp.
9301
-
9312
, doi: .
Pande
,
R.
and
GI
,
R.
(
2018
), “
Diversification of Honey bees’ flora and bee flora calendar for Nagpur and Wardha districts of Maharashtra, India
”, Vol.
6
No.
2
, pp.
3102
-
3110
.
Parreño
,
M.A.
,
Alaux
,
C.
,
Brunet
,
J.-L.
,
Buydens
,
L.
,
Filipiak
,
M.
,
Henry
,
M.
,
Keller
,
A.
,
Klein
,
A.-M.
,
Kuhlmann
,
M.
,
Leroy
,
C.
,
Meeus
,
I.
,
Palmer-Young
,
E.
,
Piot
,
N.
,
Requier
,
F.
,
Ruedenauer
,
F.
,
Smagghe
,
G.
,
Stevenson
,
P.C.
and
Leonhardt
,
S.D.
(
2022
), “
Critical links between biodiversity and health in wild bee conservation
”,
Trends in Ecology and Evolution
, Vol.
37
No.
4
, pp.
309
-
321
, doi: .
Peano
,
D.
,
Lovato
,
T.
and
Materia
,
S.
(
2020
), “
CMCC CMCC-ESM2 model output prepared for CMIP6 LS3MIP (version 20230213) [application/x-netcdf]. earth system grid federation
”, doi: .
Pellikka
,
P.K.E.
,
Clark
,
B.J.F.
,
Gosa
,
A.G.
,
Himberg
,
N.
,
Hurskainen
,
P.
,
Maeda
,
E.
,
Mwang’ombe
,
J.
,
Omoro
,
L.M.A.
and
Siljander
,
M.
(
2013
), “Agricultural expansion and its consequences in the Taita hills, Kenya”,
In Developments in Earth Surface Processes
,
Elsevier
, Vol.
16
, pp.
165
-
179
, doi: .
Prodanović
,
R.
,
Brkić
,
I.
,
Soleša
,
K.
,
Ljubojević Pelić
,
D.
,
Pelić
,
M.
,
Bursić
,
V.
and
Vapa Tankosić
,
J.
(
2024
), “
Beekeeping as a tool for sustainable rural development
”,
Journal of Agronomy, Technology and Engineering Management (JATEM)
, Vol.
7
No.
2
, pp.
1054
-
1066
, doi: .
Ricigliano
,
V.A.
,
Mott
,
B.M.
,
Maes
,
P.W.
,
Floyd
,
A.S.
,
Fitz
,
W.
,
Copeland
,
D.C.
,
Meikle
,
W.G.
and
Anderson
,
K.E.
(
2019
), “
Honey bee colony performance and health are enhanced by apiary proximity to US conservation reserve program (CRP) lands
”,
Scientific Reports
, Vol.
9
No.
1
, p.
4894
, doi: .
Roberts
,
M.
(
2017
), “
MOHC HadGEM3-GC31-LL model output prepared for CMIP6 HighResMIP (version 20230220) [application/x-netcdf]. earth system grid federation
”, doi:
Sari
,
F.
,
Kandemir
,
İ.
,
Ceylan
,
D.A.
and
Gül
,
A.
(
2020
), “
Using AHP and PROMETHEE multi-criteria decision making methods to define suitable apiary locations
”,
Journal of Apicultural Research
, Vol.
59
No.
4
, pp.
546
-
557
, doi: .
Sarkar
,
B.
,
Das
,
P.
,
Islam
,
N.
,
Basak
,
A.
,
Debnath
,
M.
and
Roy
,
R.
(
2022
), “
Land suitability analysis for paddy crop using GIS-based Fuzzy-AHP (F-AHP) method in Koch Bihar district, West Bengal
”,
Geocarto International
, Vol.
37
No.
25
, pp.
8952
-
8978
, doi: .
Schupfner
,
M.
,
Wieners
,
K.-H.
,
Wachsmann
,
F.
,
Steger
,
C.
,
Bittner
,
M.
,
Jungclaus
,
J.
,
Früh
,
B.
,
Pankatz
,
K.
,
Giorgetta
,
M.
,
Reick
,
C.
,
Legutke
,
S.
,
Esch
,
M.
,
Gayler
,
V.
,
Haak
,
H.
,
de Vrese
,
P.
,
Raddatz
,
T.
,
Mauritsen
,
T.
,
von Storch
,
J.-S.
,
Behrens
,
J.
, …
Roeckner
,
E.
(
2019
), “
DKRZ MPI-ESM1.2-HR model output prepared for CMIP6 ScenarioMIP (version 20230220)
”,
Earth System Grid Federation
, doi: .
Simioni
,
L.C.
,
Mussury
,
R.M.
,
Mauad
,
M.
,
Dresh
,
D.M.
,
Pereira
,
F.F.
and
Scalon
,
S.P.Q.
(
2015
), “
Plant-pollinator interactions in crambe abyssinicaHochst. (brassicaceae) associated with environmental variables
”,
Anais da Academia Brasileira de Ciências
, Vol.
87
No.
1
, pp.
137
-
145
, doi: .
Souverijns
,
N.
,
Thiery
,
W.
,
Demuzere
,
M.
and
Lipzig
,
N.P.M.V.
(
2016
), “
Drivers of future changes in east african precipitation
”,
Environmental Research Letters
, Vol.
11
No.
11
, p.
114011
, doi: .
Tennakoon
,
S.
,
Apan
,
A.
,
Maraseni
,
T.
and
Altarez
,
R.D.D.
(
2023
), “
Decoding the impacts of space and time on honey bees: GIS based fuzzy AHP and fuzzy overlay to assess land suitability for apiary sites in Queensland, Australia
”,
Applied Geography
, Vol.
155
, p.
102951
, doi: .
Tian
,
B.
(
2016
),
Suitability Evaluation and Neighborhood Design for Pollinator Habitat, City of Madison, WI A Plan for Healthy and Pollinator-Friendly Urban Ommunity
,
Department of Urban and Regional Planning, University of WI Madison
.
Vuorinne
,
I.
,
Heiskanen
,
J.
and
Pellikka
,
P.K.E.
(
2021
), “
Assessing leaf biomass of agave sisalana using sentinel-2 vegetation indices
”,
Remote Sensing
, Vol.
13
No.
2
, p.
233
, doi: .
Wachiye
,
S.
,
Merbold
,
L.
,
Vesala
,
T.
,
Rinne
,
J.
,
Räsänen
,
M.
,
Leitner
,
S.
and
Pellikka
,
P.
(
2020
), “
Soil greenhouse gas emissions under different land-use types in savanna ecosystems of Kenya
”,
Biogeosciences
, Vol.
17
No.
8
, pp.
2149
-
2167
, doi: .
Wang
,
T.-C.
and
Chen
,
Y.-H.
(
2008
), “
Applying fuzzy linguistic preference relations to the improvement of consistency of fuzzy AHP
”,
Information Sciences
, Vol.
178
No.
19
, pp.
3755
-
3765
, doi: .
Yebeyen
,
D.
,
Nemomissa
,
S.
,
Hailu
,
B.T.
,
Zewdie
,
W.
,
Sileshi
,
G.W.
,
Rodríguez
,
R.L.
and
Woldie
,
T.M.
(
2022
), “
Modeling and mapping habitat suitability of highland bamboo under climate change in Ethiopia
”,
Forests
, Vol.
13
No.
6
, p.
859
, doi: .
Zamani-Sabzi
,
H.
,
King
,
J.P.
,
Gard
,
C.C.
and
Abudu
,
S.
(
2016
), “
Statistical and analytical comparison of multi-criteria decision-making techniques under fuzzy environment
”,
Operations Research Perspectives
, Vol.
3
, pp.
92
-
117
, doi: .
Zoccali
,
P.
,
Malacrinò
,
A.
,
Campolo
,
O.
,
Laudani
,
F.
,
Algeri
,
G.M.
,
Giunti
,
G.
,
Strano
,
C.P.
,
Benelli
,
G.
and
Palmeri
,
V.
(
2017
), “
A novel GIS-based approach to assess beekeeping suitability of mediterranean lands
”,
Saudi Journal of Biological Sciences
, Vol.
24
No.
5
, pp.
1045
-
1050
, doi: .
Saaty
,
R.W.
(
1987
), “
The analytic hierarchy process—what it is and how it is used
”,
Mathematical Modelling
, Vol.
9
Nos
3-5
, pp.
161
-
176
, doi: .

The supplementary material for this article can be found online.
Published by Emerald Publishing Limited. This article is published under the Creative Commons Attribution (CC BY 4.0) licence. Anyone may reproduce, distribute, translate and create derivative works of this article (for both commercial and non-commercial purposes), subject to full attribution to the original publication and authors. The full terms of this licence may be seen at Link to the terms of the CC BY 4.0 licenceLink to the terms of the CC BY 4.0 licence.

Supplementary data

Data & Figures

Figure 1.
Map displaying two study areas in Ethiopia, with elevation data showing high and low values, and various marked locations.The image shows a map highlighting two study areas in Ethiopia, with the upper section featuring the study area marked in red on a larger map of Ethiopia. This section displays elevation values ranging from eight hundred forty meters to two thousand three hundred forty meters, indicated through a gradient colour scale. Featured locations within this area include names such as Dubuluk, Surupa, and Yabelo. The bottom section gives another view of the study area, marked similarly, with elevations between four hundred fifty-one meters and two thousand two hundred five meters. Key locations in this area include Taveta, Maktau, and Maytate. The image also incorporates directional indicators and a study area boundary outline.

Location map of the study area

Note(s): (a) Yabelo and (b) Taita-Taveta County

Source: Authors’ own creation

Figure 1.
Map displaying two study areas in Ethiopia, with elevation data showing high and low values, and various marked locations.The image shows a map highlighting two study areas in Ethiopia, with the upper section featuring the study area marked in red on a larger map of Ethiopia. This section displays elevation values ranging from eight hundred forty meters to two thousand three hundred forty meters, indicated through a gradient colour scale. Featured locations within this area include names such as Dubuluk, Surupa, and Yabelo. The bottom section gives another view of the study area, marked similarly, with elevations between four hundred fifty-one meters and two thousand two hundred five meters. Key locations in this area include Taveta, Maktau, and Maytate. The image also incorporates directional indicators and a study area boundary outline.

Location map of the study area

Note(s): (a) Yabelo and (b) Taita-Taveta County

Source: Authors’ own creation

Close Figure 1.
Figure 2.
A series of nine maps displaying various geographical parameters including precipitation, land use, aspect, distance from water sources, elevation, slope, temperature, and wind speed.This image features a grid of nine distinct maps, each representing different geographical parameters. The first map shows precipitation levels, measured in millimeters, with high values indicated as eight hundred thirty and low as three hundred forty. The second map illustrates land use and land cover categories such as bushland, forest, and cropland, with corresponding colour coding. The third map depicts aspect values ranging from negative one to three hundred sixty. The fourth map represents distance from water sources, measured in meters, categorized into ranges from zero to nine thousand. The fifth map displays elevation in meters, with high values of two thousand three hundred forty and a low of eight hundred forty. The sixth map shows slope in degrees, with ranges from zero to over twenty degrees. The seventh map illustrates temperature in degrees Celsius, with values from zero to twenty-five. The eighth map displays wind speed in meters per second, indicating a high of twelve point eight and a low of one point eight. Each map is labelled and colour-coded to convey its respective information clearly. The layout provides an organized visual for easy comparison of the different parameters.

Criteria map of Yabelo

Note(s): (a) Precipitation; (b) forage source; (c) aspect; (d) distance from water resources; (e) elevation; (f) distance from roads; (g) slope; (h) temperature and (i) wind speed

Source: Authors’ own creation

Figure 2.
A series of nine maps displaying various geographical parameters including precipitation, land use, aspect, distance from water sources, elevation, slope, temperature, and wind speed.This image features a grid of nine distinct maps, each representing different geographical parameters. The first map shows precipitation levels, measured in millimeters, with high values indicated as eight hundred thirty and low as three hundred forty. The second map illustrates land use and land cover categories such as bushland, forest, and cropland, with corresponding colour coding. The third map depicts aspect values ranging from negative one to three hundred sixty. The fourth map represents distance from water sources, measured in meters, categorized into ranges from zero to nine thousand. The fifth map displays elevation in meters, with high values of two thousand three hundred forty and a low of eight hundred forty. The sixth map shows slope in degrees, with ranges from zero to over twenty degrees. The seventh map illustrates temperature in degrees Celsius, with values from zero to twenty-five. The eighth map displays wind speed in meters per second, indicating a high of twelve point eight and a low of one point eight. Each map is labelled and colour-coded to convey its respective information clearly. The layout provides an organized visual for easy comparison of the different parameters.

Criteria map of Yabelo

Note(s): (a) Precipitation; (b) forage source; (c) aspect; (d) distance from water resources; (e) elevation; (f) distance from roads; (g) slope; (h) temperature and (i) wind speed

Source: Authors’ own creation

Close Figure 2.
Figure 3.
A series of nine maps showcasing geographical data, including precipitation, land cover, aspect, elevation, distance from water sources and roads, slope, temperature, and wind speed in a defined area.The image features nine analytical maps arranged in a grid format, depicting various geographical attributes of a specific region. The first map illustrates precipitation levels measured in millimeters, marked with a color gradient from green to orange, indicating high and low values. Adjacent, the land cover map categorizes different ecosystem types with colours corresponding to Agroforestry, Grassland, Wetlands, amongst others. The aspect map follows, showing directional characteristics with a colour gradient. The fourth map displays elevation in meters, with variations between low and high peaks denoted. The fifth visual represents the distance from water sources in meters, featured with distinct color groupings. Next, the distance from roads is shown, similarly quantified in meters. The slope map quantifies land steepness in degrees, while the temperature map indicates ranges in degrees Celsius. Lastly, wind speed measured in meters per second is depicted, showcasing varying levels of wind across the area. Each map contains legends that explain the colour coding and variable ranges, aiding user interpretation of the spatial information.

Criteria map of Taita-Taveta

Note(s): (a) Precipitation; (b) forage source; (c) aspect; (d) distance from water resources; (e) elevation; (f) distance from roads; (g) slope; (h) temperature and (i) wind speed

Source: Authors’ own creation

Figure 3.
A series of nine maps showcasing geographical data, including precipitation, land cover, aspect, elevation, distance from water sources and roads, slope, temperature, and wind speed in a defined area.The image features nine analytical maps arranged in a grid format, depicting various geographical attributes of a specific region. The first map illustrates precipitation levels measured in millimeters, marked with a color gradient from green to orange, indicating high and low values. Adjacent, the land cover map categorizes different ecosystem types with colours corresponding to Agroforestry, Grassland, Wetlands, amongst others. The aspect map follows, showing directional characteristics with a colour gradient. The fourth map displays elevation in meters, with variations between low and high peaks denoted. The fifth visual represents the distance from water sources in meters, featured with distinct color groupings. Next, the distance from roads is shown, similarly quantified in meters. The slope map quantifies land steepness in degrees, while the temperature map indicates ranges in degrees Celsius. Lastly, wind speed measured in meters per second is depicted, showcasing varying levels of wind across the area. Each map contains legends that explain the colour coding and variable ranges, aiding user interpretation of the spatial information.

Criteria map of Taita-Taveta

Note(s): (a) Precipitation; (b) forage source; (c) aspect; (d) distance from water resources; (e) elevation; (f) distance from roads; (g) slope; (h) temperature and (i) wind speed

Source: Authors’ own creation

Close Figure 3.
Figure 4.
Two maps display land suitability classifications into highly suitable, moderately suitable, and less suitable areas across two regions.The figure contains two maps showing land suitability distribution. Map A presents suitability categories across a region, classifying areas as highly suitable, moderately suitable, and less suitable for the intended use. Map B provides a similar classification for another region, with the southern and western parts largely falling under the highly suitable category, while the northern and central regions contain mixed moderately suitable and less suitable zones. The maps include latitude and longitude markings, a north arrow, and scale bars for reference, offering a spatial analysis of land suitability variations.

Current apiary suitability map of Yabelo (a) and Taita-Taveta (b) sites

Source: Authors’ own creation

Figure 4.
Two maps display land suitability classifications into highly suitable, moderately suitable, and less suitable areas across two regions.The figure contains two maps showing land suitability distribution. Map A presents suitability categories across a region, classifying areas as highly suitable, moderately suitable, and less suitable for the intended use. Map B provides a similar classification for another region, with the southern and western parts largely falling under the highly suitable category, while the northern and central regions contain mixed moderately suitable and less suitable zones. The maps include latitude and longitude markings, a north arrow, and scale bars for reference, offering a spatial analysis of land suitability variations.

Current apiary suitability map of Yabelo (a) and Taita-Taveta (b) sites

Source: Authors’ own creation

Close Figure 4.
Figure 5.
Land suitability maps showing highly suitable, moderately suitable, and less suitable areas across four modelling approaches for the first region.The figure presents four land suitability maps of the first region labelled a, b, c, and d. Each map categorises land into highly suitable, moderately suitable, and less suitable areas. Highly suitable zones are mostly concentrated in the central and southern parts, moderately suitable zones extend across large patches in the north and east, while less suitable areas are scattered mainly in the northern and north-eastern parts. Differences between the four panels indicate variations in suitability classification among the modelling methods.

Apiary suitability map of Yabelo under different scenarios

Note(s): (a) SSPs126 (2021–2040); (b) SSPs126 (2061–2080); (c) SSPs585 (2021–2040) and (d) SSPs585 (2061–2080)

Source: Authors’ own creation

Figure 5.
Land suitability maps showing highly suitable, moderately suitable, and less suitable areas across four modelling approaches for the first region.The figure presents four land suitability maps of the first region labelled a, b, c, and d. Each map categorises land into highly suitable, moderately suitable, and less suitable areas. Highly suitable zones are mostly concentrated in the central and southern parts, moderately suitable zones extend across large patches in the north and east, while less suitable areas are scattered mainly in the northern and north-eastern parts. Differences between the four panels indicate variations in suitability classification among the modelling methods.

Apiary suitability map of Yabelo under different scenarios

Note(s): (a) SSPs126 (2021–2040); (b) SSPs126 (2061–2080); (c) SSPs585 (2021–2040) and (d) SSPs585 (2061–2080)

Source: Authors’ own creation

Close Figure 5.
Figure 6.
Land suitability maps of the second region showing classification into highly suitable, moderately suitable, and less suitable areas across four models.The figure presents four maps of the second region labelled a, b, c, and d, illustrating land suitability under different modelling conditions. Highly suitable areas dominate the central and southern parts, moderately suitable areas extend over large sections of the north and west, and less suitable areas are concentrated in the northern highlands. Comparisons across panels a to d highlight model-dependent differences but maintain the general trend of central dominance of highly suitable areas and northern clustering of less suitable areas.

Apiary suitability map of Taita-Taveta under different senarios

Note(s): (a) SSPs126 (2021–2040); (b) SSPs126 (2061–2080); (c) SSPs585 (2021–2040) and (d) SSPs585 (2061–2080)

Source: Authors’ own creation

Figure 6.
Land suitability maps of the second region showing classification into highly suitable, moderately suitable, and less suitable areas across four models.The figure presents four maps of the second region labelled a, b, c, and d, illustrating land suitability under different modelling conditions. Highly suitable areas dominate the central and southern parts, moderately suitable areas extend over large sections of the north and west, and less suitable areas are concentrated in the northern highlands. Comparisons across panels a to d highlight model-dependent differences but maintain the general trend of central dominance of highly suitable areas and northern clustering of less suitable areas.

Apiary suitability map of Taita-Taveta under different senarios

Note(s): (a) SSPs126 (2021–2040); (b) SSPs126 (2061–2080); (c) SSPs585 (2021–2040) and (d) SSPs585 (2061–2080)

Source: Authors’ own creation

Close Figure 6.
Table 1.

Data sources for apiary suitability analysis

CriteriaData type and resolutionSource
ElevationRaster (30 m x 30 m)SRTM-DEM
AspectRaster (30 m x 30 m)SRTM-DEM
SlopeRaster (30 m x 30 m)SRTM-DEM
Water sourceVectorGeoportal.rcmrd.org for river network and ministry of water and energy of Ethiopia for water points
RoadVectorGeoportal.rcmrd.org
LULCRaster (10 m x10 m)Mengistu et al. (2024) (Yabelo) and Abera et al. (2023) (Taita-Taveta)
PrecipitationRaster (1 km x 1 km)Worldclim.org (Fick and Hijmans, 2017)
TemperatureRaster (1 km x 1 km)Worldclim.org (Fick and Hijmans, 2017)
Wind speedRaster (1 km x 1 km)Worldclim.org (Fick and Hijmans, 2017)
Source(s): Authors’ own creation
Table 2.

Linguistic variable for pairwise comparison of each criterion

Linguistic variableTriangular fuzzy scaleTriangular fuzzy reciprocal scale
Equally strong(1,1,1)(1,1,1)
Moderately strong(2,3,4)(1/4,1/3,1/2)
Strong(4,5,6)(1/6,1/5,1/4)
Very strong(6,7,8)(1/8,1/7,1/6)
Extremely strong(9,9,9)(1/9,1/9,1/9)
Intermediate values(1,2,3)(1/3,1/2,1)
(3,4,5)(1/5,1/4,1/3)
(5,6,7)(1/7,1/6,1/5)
(7,8,9)(1/9,1/8,1/7)
Source(s): Adapted from Tennakoon et al. (2023) 
Table 3.

Weights of main criteria and Subcriteria

Main criteriaWeightSubcriteriaSuitability value
Forage source28Forest, bushland, thickets and shrublandHighly
GrasslandModerately
CroplandLess
Distance from water source (m)22<1,000Highly
1,000–3,000Moderately
>3,000Less
Distance from road (m)4<1,000Highly
1,000–3,000Moderately
>3,000Less
Elevation (m)9898–1,400Highly
1,400–1,800Moderately
1,800–2,300Less
Aspect9Flat, North, Northeast and EastHighly
Southwest, West and NorthwestModerately
SouthLess
Slope (°)90–10Highly
10–20Moderately
20–35Less
Precipitation (mm)111,100–500Highly
500–300Moderately
300–100Less
Temperature (°C)415–21Highly
21–25Moderately
25–29Less
Wind speed (m/s)41–4Highly
4–8Moderately
8–13Less
Source(s): Authors’ own creation
Table 4.

Climate model outputs used for future climate analysis

Climate modelModel predictionReference
HadGEM3-GC31-LLHadley Centre Global Environmental Model run in the Global Coupled configuration 3.1(Roberts, 2017)
MPI-ESM1-2-HRMax planck institute for meteorology, earth system model(Schupfner et al., 2019)
CMCC-ESM2Centro Euro-Mediterraneo sui cambiamenti climatici, earth system model(Peano et al., 2020)
Source(s): Authors’ own creation
Table 5.

Current and future suitability for apiary location

Suitability for apiaryYabeloTatita-Taveta
Highly (area %)Moderately (area %)Less (area %)Highly (area %)Moderately (area %)Less (area %)
Current40.243.616.254.933.911.2
SSPs1262021–204038.244.017.853.634.611.8
2061–208032.545.921.651.535.513.0
SSPs5852021–204038.543.917.634.056.39.7
2061–208032.655.312.127.861.410.8
Source(s): Authors’ own creation
Table 6.

Distribution of existing beehive locations across suitability classes under current and future climate change scenarios

ClassificationSSP1-2.6SSP5-8.5
Current2021–20402061–20802021–20402061–2080
No.%No.%No.%No.%No.%
Yabelo
Highly suitable1173.3960.0853.3853.3746.7
Moderately suitable213.3426.7533.3533.3533.3
Less suitable213.3213.3213.3213.3320.0
Total1510015100151001510015100
Taita-Taveta
Highly suitable4358.94358.94460.33142.53547.9
Moderately suitable2432.92432.92331.53852.03446.6
Less suitable68.268.268.245.545.5
Total7310073100731007310073100
Source(s): Authors’ own creation
Table A1.

Beehive locations in the Yabelo Study site, Ethiopia

FIDLatitudeLongitude
14.998738.2051
24.996738.2063
34.875638.1229
44.874338.1196
54.888938.0861
64.882838.0980
74.886238.0908
84.890238.0570
94.875738.1417
104.878638.1481
114.814138.3229
125.010138.2126
134.888938.0859
144.676238.1633
154.674038.1497
Source(s): Authors’ own creation
Table A2.

Beehive locations in the Tatita-Taveta study site, Kenya

FIDLatitudeLongitude
1−3.478138.3549
2−3.481438.3422
3−3.407538.3625
4−3.408738.3749
5−3.485038.4112
6−3.457538.3927
7−3.508738.3549
8−3.505638.3478
9−3.507738.3431
10−3.498738.3770
11−3.507038.2667
12−3.641338.3737
13−3.458238.3390
14−3.469338.3648
15−3.504338.3355
16−3.480238.3309
17−3.634638.3701
18−3.382438.3332
19−3.277138.2993
20−3.288038.3026
21−3.399838.3136
22−3.423638.3536
23−3.508438.3507
24−3.504338.3302
25−3.482038.3559
26−3.459838.3454
27−3.470438.3466
28−3.466738.3447
29−3.637038.3734
30−3.423638.3533
31−3.369438.3526
32−3.371638.3526
33−3.380138.3437
34−3.354238.3367
35−3.482238.3118
36−3.431438.2949
37−3.427438.3046
38−3.413538.3177
39−3.403438.2891
40−3.524038.3156
41−3.385138.3283
42−3.417138.4086
43−3.596338.3359
44−3.375238.4328
45−3.459538.1884
46−3.486738.2646
47−3.392038.3763
48−3.386738.3800
49−3.393538.3794
50−3.380638.3775
51−3.455638.4812
52−3.475638.4314
53−3.479738.4124
54−3.391238.3727
55−3.425838.1398
56−3.469138.1965
57−3.469138.1965
58−3.441638.5009
59−3.457638.3927
60−3.457438.3927
61−3.457438.3927
62−3.398237.7300
63−3.488138.4088
64−3.488338.4089
65−3.489038.4090
66−3.489638.4094
67−3.490138.4096
68−3.489938.4075
69−3.489038.4075
70−3.403338.4422
71−3.403038.4424
72−3.635038.2579
73−3.635238.2580
Source(s): Authors’ own creation

Supplements

Supplementary data

References

Abera
,
T.
,
Heiskanen
,
J.
,
Maeda
,
E.
,
Odongo
,
V.
and
Pellikka
,
P.
(
2023
), “
Impacts of land cover and management change on top-of-canopy and below-canopy temperatures in southeastern Kenya
”,
Science of The Total Environment
, Vol.
874
, p.
162560
, doi: .
Addi
,
A.
,
Wakjira
,
K.
,
Ensermu
,
K.
, and
Amssalu
,
B.
(
2014
),
Honeybee Forages of Ethiopia (Ethiopia)
,
Holeta Bee Research Centre
.
Alaqeel
,
T.A.
and
Suryanarayanan
,
S.
(
2018
), “
A fuzzy analytic hierarchy process algorithm to prioritize smart grid technologies for the saudi electricity infrastructure
”,
Sustainable Energy, Grids and Networks
, Vol.
13
, pp.
122
-
133
, doi: .
Amara
,
E.
,
Adhikari
,
H.
,
Mwamodenyi
,
J.M.
,
Pellikka
,
P.K.E.
and
Heiskanen
,
J.
(
2023
), “
Contribution of tree size and species on aboveground biomass across land cover types in the Taita hills, Southern Kenya
”,
Forests
, Vol.
14
No.
3
, p.
642
, doi: .
Balvino‐Olvera
,
F.J.
,
Olivares‐Pinto
,
U.
,
González‐Rodríguez
,
A.
,
Aguilar‐Aguilar
,
M.J.
,
Ruiz‐Guzmán
,
G.
,
Lobo‐Segura
,
J.
,
Cortés‐Flores
,
J.
,
Cristobal‐Perez
,
E.J.
,
Martén‐Rodríguez
,
S.
,
Patiño‐Conde
,
V.
and
Quesada
,
M.
(
2024
), “
Effects of floral resources on honey bee populations in Mexico: Using dietary metabarcoding to examine landscape quality in agroecosystems
”,
Ecology and Evolution
, Vol.
14
No.
6
, p.
e11456
, doi: .
Bareke
,
T.
and
Addi
,
A.
(
2019a
), “
Bee flora resources and honey production calendar of Gera forest in Ethiopia
”,
Asian Journal of Forestry
, Vol.
3
No.
2
, pp.
69
-
74
.
Bareke
,
T.
and
Addi
,
A.
(
2019b
), “
Pollen analysis of honey from Borana zone of Southern Ethiopia
”,
Journal of Apicultural Science
, Vol.
63
No.
2
, pp.
233
-
242
, doi: .
Bartholomée
,
O.
,
Aullo
,
A.
,
Becquet
,
J.
,
Vannier
,
C.
and
Lavorel
,
S.
(
2020
), “
Pollinator presence in orchards depends on landscape-scale habitats more than in-field flower resources
”,
Agriculture, Ecosystems and Environment
, Vol.
293
, p.
106806
, doi: .
Bertrand
,
R.
,
Lenoir
,
J.
,
Piedallu
,
C.
,
Riofrío-Dillon
,
G.
,
De Ruffray
,
P.
,
Vidal
,
C.
,
Pierrat
,
J.-C.
and
Gégout
,
J.-C.
(
2011
), “
Changes in plant community composition lag behind climate warming in lowland forests
”,
Nature
, Vol.
479
No.
7374
, pp.
517
-
520
, doi: .
Bond
,
J.K.
,
Hitaj
,
C.
,
Smith
,
D.
,
Hunt
,
K.
,
Perez
,
A.
and
Ferreira
,
G.
(
2021
), “
Honey bees on the move: from pollination to honey production and back
”, doi:
Brühl
,
C.A.
,
Bakanov
,
N.
,
Köthe
,
S.
,
Eichler
,
L.
,
Sorg
,
M.
,
Hörren
,
T.
,
Mühlethaler
,
R.
,
Meinel
,
G.
and
Lehmann
,
G.U.C.
(
2021
), “
Direct pesticide exposure of insects in nature conservation areas in Germany
”,
Scientific Reports
, Vol.
11
No.
1
, p.
24144
, doi: .
Buckley
,
J.J.
(
1985
), “
Fuzzy hierarchical analysis
”,
Fuzzy Sets and Systems
, Vol.
17
No.
3
, pp.
233
-
247
, doi: .
Chabert
,
S.
,
Requier
,
F.
,
Chadoeuf
,
J.
,
Guilbaud
,
L.
,
Morison
,
N.
and
Vaissière
,
B.E.
(
2021
), “
Rapid measurement of the adult worker population size in honey bees
”,
Ecological Indicators
, Vol.
122
, p.
107313
, doi: .
Chang
,
D.-Y.
(
1996
), “
Applications of the extent analysis method on fuzzy AHP
”,
European Journal of Operational Research
, Vol.
95
No.
3
, pp.
649
-
655
, doi: .
Clarke
,
D.
and
Robert
,
D.
(
2018
), “
Predictive modelling of honey bee foraging activity using local weather conditions
”,
Apidologie
, Vol.
49
No.
3
, pp.
386
-
396
, doi: .
Conrad
,
K.M.
,
Peters
,
V.E.
and
Rehan
,
S.M.
(
2021
), “
Tropical bee species abundance differs within a narrow elevational gradient
”,
Scientific Reports
, Vol.
11
No.
1
, p.
23368
, doi: .
Couvillon
,
M.J.
,
Walter
,
C.M.
,
Blows
,
E.M.
,
Czaczkes
,
T.J.
,
Alton
,
K.L.
and
Ratnieks
,
F.L.W.
(
2015
), “
Busy bees: Variation in insect flower-visiting rates across multiple plant species
”,
Psyche: A Journal of Entomology
, Vol.
2015
, pp.
1
-
7
, doi: .
Dietzel
,
S.
,
Rojas-Botero
,
S.
,
Kollmann
,
J.
and
Fischer
,
C.
(
2023
), “
Enhanced urban roadside vegetation increases pollinator abundance whereas landscape characteristics drive pollination
”,
Ecological Indicators
, Vol.
147
, p.
109980
, doi: .
Doherty
,
K.D.
,
Kuhlman
,
M.P.
,
Durham
,
R.A.
,
Ramsey
,
P.W.
and
Mummey
,
D.L.
(
2021
), “
Fine-grained topographic diversity data improve site prioritization outcomes for bees
”,
Ecological Indicators
, Vol.
132
, p.
108315
, doi: .
Dupont
,
L.M.
,
Zhao
,
X.
,
Charles
,
C.
,
Faith
,
J.T.
and
Braun
,
D.
(
2022
), “
Continuous vegetation record of the greater cape floristic region (South Africa) covering the past 300 000 years (IODP U1479)
”,
Climate of the Past
, Vol.
18
No.
1
, pp.
1
-
21
, doi: .
Fick
,
S.E.
and
Hijmans
,
R.J.
(
2017
), “
WorldClim 2: new 1-km spatial resolution climate surfaces for global land areas
”,
International Journal of Climatology
, Vol.
37
No.
12
, pp.
4302
-
4315
, doi: .
Fotso Kamga
,
G.A.
,
Bouroubi
,
Y.
,
Germain
,
M.
,
Mbom
,
A.M.
and
Chagnon
,
M.
(
2024
), “
Expert knowledge-based modelling approach for mapping beekeeping suitability area
”,
Ecological Informatics
, Vol.
80
, p.
102530
, doi: .
Frazier
,
M.
,
Muli
,
E.
and
Patch
,
H.
(
2024
), “
Ecology and management of African honey bees (Apis mellifera L
”,
Annual Review of Entomology
, Vol.
69
No.
1
, pp.
439
-
453
, doi: .
Gallardo-López
,
F.
,
Castellanos-Potenciano
,
B.P.
,
Díaz-Padilla
,
G.
,
Pérez-Vázquez
,
A.
,
Landeros-Sánchez
,
C.
and
Sol-Sánchez
,
Á.
(
2021
), “
Disonancia cognitiva ante el cambio climático en apicultores: Un caso de estudio en méxico
”,
Revista Mexicana de Ciencias Pecuarias
, Vol.
12
No.
1
, pp.
238
-
255
, doi: .
Gebremedhn
,
H.
,
Gebrewahid
,
Y.
,
Haile
,
G.G.
,
Hadgu
,
G.
,
Atsbha
,
T.
,
Hailu
,
T.G.
and
Bezabih
,
G.
(
2024
), “
Projecting the impact of climate change on honey bee plant habitat distribution in Northern Ethiopia
”,
Scientific Reports
, Vol.
14
No.
1
, p.
15866
, doi: .
Gebreyohans
,
K.W.
and
Gebremariam
,
T.T.
(
2017
), “
Beekeeping management practices and constraints in Eastern Tigray
”,
Ethiopia. Journal of Agriculture and Environment for International Development (JAEID)
, Vol.
111
No.
2
, doi: .
Hennessy
,
G.
,
Harris
,
C.
,
Eaton
,
C.
,
Wright
,
P.
,
Jackson
,
E.
,
Goulson
,
D.
and
Ratnieks
,
F.F.L.W.
(
2020
), “
Gone with the wind: effects of wind on honey bee visit rate and foraging behaviour
”,
Animal Behaviour
, Vol.
161
, pp.
23
-
31
, doi: .
Hilmi
,
M.
,
Bradbear
,
N.
, and
Mejía-Lorío
,
D.J.
(
2011
),
Beekeeping and Sustainable Livelihoods
, (2nd ed) .,
FAO
.
IPCC
(
2021
),
Climate Change 2021 – The Physical Science Basis: Working Group I Contribution to the Sixth Assessment Report of the Intergovernmental Panel on Climate Change
, (1st ed) .,
Cambridge University Press
, doi: .
Ipcc
,
I.
(
2014
), “
The IPCC’s fifth assessment report – what’s in it for Africa, executive summary, climate and development knowledge network (CDKN)
”.
Janousek
,
W.M.
,
Douglas
,
M.R.
,
Cannings
,
S.
,
Clément
,
M.A.
,
Delphia
,
C.M.
,
Everett
,
J.G.
,
Hatfield
,
R.G.
,
Keinath
,
D.A.
,
Koch
,
J.B.U.
,
McCabe
,
L.M.
,
Mola
,
J.M.
,
Ogilvie
,
J.E.
,
Rangwala
,
I.
,
Richardson
,
L.L.
,
Rohde
,
A.T.
,
Strange
,
J.P.
,
Tronstad
,
L.M.
and
Graves
,
T.A.
(
2023
), “
Recent and future declines of a historically widespread pollinator linked to climate, land cover, and pesticides
”,
Proceedings of the National Academy of Sciences
, Vol.
120
No.
5
, p.
e2211223120
, doi: .
Jimma
,
T.
,
Chemura
,
A.
,
Spillane
,
C.
,
Demissie
,
T.
,
Abera
,
W.
,
Ture
,
K.
,
Terefe
,
T.
,
Solomon
,
D.
and
Gleixner
,
S.
(
2024
), “
Coupled impacts of soil acidification and climate change on future crop suitability in Ethiopia
”,
Sustainability
, Vol.
16
No.
4
, p.
1468
, doi: .
Karbassioon
,
A.
,
Yearlsey
,
J.
,
Dirilgen
,
T.
,
Hodge
,
S.
,
Stout
,
J.C.
and
Stanley
,
D.A.
(
2023
), “
Responses in honeybee and bumblebee activity to changes in weather conditions
”,
Oecologia
, Vol.
201
No.
3
, pp.
689
-
701
, doi: .
Kim
,
Y.-U.
,
Webber
,
H.
,
Adiku
,
S.G.K.
,
Nóia Júnior
,
R.D.S.
,
Deswarte
,
J.-C.
,
Asseng
,
S.
and
Ewert
,
F.
(
2024
), “
Mechanisms and modelling approaches for excessive rainfall stress on cereals: waterlogging, submergence, lodging, pests and diseases
”,
Agricultural and Forest Meteorology
, Vol.
344
, p.
109819
, doi: .
Kogo
,
B.K.
,
Kumar
,
L.
,
Koech
,
R.
and
Kariyawasam
,
C.S.
(
2019
), “
Modelling climate suitability for rainfed maize cultivation in Kenya using a maximum entropy (MaxENT) approach
”,
Agronomy
, Vol.
9
No.
11
, p.
727
, doi: .
Komasilova
,
O.
,
Komasilovs
,
V.
,
Kviesis
,
A.
,
Bumanis
,
N.
,
Mellmann
,
H.
and
Zacepins
,
A.
(
2020
), “
Model for the bee apiary location evaluation [PDF]. 804.6Kb
”, doi: .
Leal Filho
,
W.
,
Nzengya
,
D.
,
Muasya
,
G.
,
Chemuliti
,
J.
and
Kalungu
,
J.W.
(
2017
), “
Climate change responses among the maasai community in Kenya
”,
Climatic Change
, Vol.
145
Nos
1-2
, pp.
71
-
83
, doi: .
Leponiemi
,
M.
,
Freitak
,
D.
,
Moreno-Torres
,
M.
,
Pferschy-Wenzig
,
E.-M.
,
Becker-Scarpitta
,
A.
,
Tiusanen
,
M.
,
Vesterinen
,
E.J.
and
Wirta
,
H.
(
2023
), “
Honeybees’ foraging choices for nectar and pollen revealed by DNA metabarcoding
”,
Scientific Reports
, Vol.
13
No.
1
, p.
14753
, doi: .
Liu
,
Y.
,
Eckert
,
C.M.
and
Earl
,
C.
(
2020
), “
A review of fuzzy AHP methods for decision-making with subjective judgements
”,
Expert Systems with Applications
, Vol.
161
, p.
113738
, doi: .
Marnasidis
,
S.
,
Kantartzis
,
A.
,
Malesios
,
C.
,
Hatjina
,
F.
,
Arabatzis
,
G.
and
Verikouki
,
E.
(
2021
), “
Mapping priority areas for apiculture development with the use of geographical information systems
”,
Agriculture
, Vol.
11
No.
2
, p.
182
, doi: .
Mengistu
,
F.
,
Hailu
,
B.T.
,
Abera
,
T.A.
,
Heiskanen
,
J.
,
Zeleke
,
T.T.
,
Johansson
,
T.
and
Pellikka
,
P.K.E.
(
2024
),
Improving the Accuracy of Honey Bee Habitat Mapping Using Ensemble Learning and Multi-Source Satellite Data in Google Earth Engine
, doi: .
Mishra
,
D.M.
,
Bhunia
,
P.
,
Shubham
,
S.
,
Sen
,
R.
,
Bhunia
,
R.
,
Gulia
,
J.
,
Mondal
,
T.
,
Zidane
,
Z.
,
Saha
,
T.
,
Chacko
,
A.
,
Raj
,
R.
,
S.
,
V.S.
and
Kaushal
,
L.
, (
2023
), “
The impact of weather change on honey bee populations and disease
”,
Journal of Advanced Zoology
, Vol.
44
No.
S7
, pp.
180
-
190
, doi: .
Navarro-Racines
,
C.
,
Tarapues
,
J.
,
Thornton
,
P.
,
Jarvis
,
A.
and
Ramirez-Villegas
,
J.
(
2020
), “
High-resolution and bias-corrected CMIP5 projections for climate change impact assessments
”,
Scientific Data
, Vol.
7
No.
1
, p.
7
, doi: .
Natamba
,
L.
,
Zhang
,
W.
,
Zhang
,
J.
and
Zhao
,
X.
(
2018
), “
Climate change causing food insecurity in east africa: traditional and non-traditional strategies to solve the problem
”,
Applied Ecology and Environmental Research
, Vol.
16
No.
3
, pp.
2233
-
2254
, doi: .
Nuhu
,
S.K.
,
Manan
,
Z.A.
,
Wan Alwi
,
S.R.
and
Md Reba
,
M.N.
(
2022
), “
Integrated modelling approach for an eco-industrial park site selection
”,
Journal of Cleaner Production
, Vol.
368
, p.
133141
, doi: .
Olliff‐Yang
,
R.L.
and
Ackerly
,
D.D.
(
2020
), “
Topographic heterogeneity lengthens the duration of pollinator resources
”,
Ecology and Evolution
, Vol.
10
No.
17
, pp.
9301
-
9312
, doi: .
Pande
,
R.
and
GI
,
R.
(
2018
), “
Diversification of Honey bees’ flora and bee flora calendar for Nagpur and Wardha districts of Maharashtra, India
”, Vol.
6
No.
2
, pp.
3102
-
3110
.
Parreño
,
M.A.
,
Alaux
,
C.
,
Brunet
,
J.-L.
,
Buydens
,
L.
,
Filipiak
,
M.
,
Henry
,
M.
,
Keller
,
A.
,
Klein
,
A.-M.
,
Kuhlmann
,
M.
,
Leroy
,
C.
,
Meeus
,
I.
,
Palmer-Young
,
E.
,
Piot
,
N.
,
Requier
,
F.
,
Ruedenauer
,
F.
,
Smagghe
,
G.
,
Stevenson
,
P.C.
and
Leonhardt
,
S.D.
(
2022
), “
Critical links between biodiversity and health in wild bee conservation
”,
Trends in Ecology and Evolution
, Vol.
37
No.
4
, pp.
309
-
321
, doi: .
Peano
,
D.
,
Lovato
,
T.
and
Materia
,
S.
(
2020
), “
CMCC CMCC-ESM2 model output prepared for CMIP6 LS3MIP (version 20230213) [application/x-netcdf]. earth system grid federation
”, doi: .
Pellikka
,
P.K.E.
,
Clark
,
B.J.F.
,
Gosa
,
A.G.
,
Himberg
,
N.
,
Hurskainen
,
P.
,
Maeda
,
E.
,
Mwang’ombe
,
J.
,
Omoro
,
L.M.A.
and
Siljander
,
M.
(
2013
), “Agricultural expansion and its consequences in the Taita hills, Kenya”,
In Developments in Earth Surface Processes
,
Elsevier
, Vol.
16
, pp.
165
-
179
, doi: .
Prodanović
,
R.
,
Brkić
,
I.
,
Soleša
,
K.
,
Ljubojević Pelić
,
D.
,
Pelić
,
M.
,
Bursić
,
V.
and
Vapa Tankosić
,
J.
(
2024
), “
Beekeeping as a tool for sustainable rural development
”,
Journal of Agronomy, Technology and Engineering Management (JATEM)
, Vol.
7
No.
2
, pp.
1054
-
1066
, doi: .
Ricigliano
,
V.A.
,
Mott
,
B.M.
,
Maes
,
P.W.
,
Floyd
,
A.S.
,
Fitz
,
W.
,
Copeland
,
D.C.
,
Meikle
,
W.G.
and
Anderson
,
K.E.
(
2019
), “
Honey bee colony performance and health are enhanced by apiary proximity to US conservation reserve program (CRP) lands
”,
Scientific Reports
, Vol.
9
No.
1
, p.
4894
, doi: .
Roberts
,
M.
(
2017
), “
MOHC HadGEM3-GC31-LL model output prepared for CMIP6 HighResMIP (version 20230220) [application/x-netcdf]. earth system grid federation
”, doi:
Sari
,
F.
,
Kandemir
,
İ.
,
Ceylan
,
D.A.
and
Gül
,
A.
(
2020
), “
Using AHP and PROMETHEE multi-criteria decision making methods to define suitable apiary locations
”,
Journal of Apicultural Research
, Vol.
59
No.
4
, pp.
546
-
557
, doi: .
Sarkar
,
B.
,
Das
,
P.
,
Islam
,
N.
,
Basak
,
A.
,
Debnath
,
M.
and
Roy
,
R.
(
2022
), “
Land suitability analysis for paddy crop using GIS-based Fuzzy-AHP (F-AHP) method in Koch Bihar district, West Bengal
”,
Geocarto International
, Vol.
37
No.
25
, pp.
8952
-
8978
, doi: .
Schupfner
,
M.
,
Wieners
,
K.-H.
,
Wachsmann
,
F.
,
Steger
,
C.
,
Bittner
,
M.
,
Jungclaus
,
J.
,
Früh
,
B.
,
Pankatz
,
K.
,
Giorgetta
,
M.
,
Reick
,
C.
,
Legutke
,
S.
,
Esch
,
M.
,
Gayler
,
V.
,
Haak
,
H.
,
de Vrese
,
P.
,
Raddatz
,
T.
,
Mauritsen
,
T.
,
von Storch
,
J.-S.
,
Behrens
,
J.
, …
Roeckner
,
E.
(
2019
), “
DKRZ MPI-ESM1.2-HR model output prepared for CMIP6 ScenarioMIP (version 20230220)
”,
Earth System Grid Federation
, doi: .
Simioni
,
L.C.
,
Mussury
,
R.M.
,
Mauad
,
M.
,
Dresh
,
D.M.
,
Pereira
,
F.F.
and
Scalon
,
S.P.Q.
(
2015
), “
Plant-pollinator interactions in crambe abyssinicaHochst. (brassicaceae) associated with environmental variables
”,
Anais da Academia Brasileira de Ciências
, Vol.
87
No.
1
, pp.
137
-
145
, doi: .
Souverijns
,
N.
,
Thiery
,
W.
,
Demuzere
,
M.
and
Lipzig
,
N.P.M.V.
(
2016
), “
Drivers of future changes in east african precipitation
”,
Environmental Research Letters
, Vol.
11
No.
11
, p.
114011
, doi: .
Tennakoon
,
S.
,
Apan
,
A.
,
Maraseni
,
T.
and
Altarez
,
R.D.D.
(
2023
), “
Decoding the impacts of space and time on honey bees: GIS based fuzzy AHP and fuzzy overlay to assess land suitability for apiary sites in Queensland, Australia
”,
Applied Geography
, Vol.
155
, p.
102951
, doi: .
Tian
,
B.
(
2016
),
Suitability Evaluation and Neighborhood Design for Pollinator Habitat, City of Madison, WI A Plan for Healthy and Pollinator-Friendly Urban Ommunity
,
Department of Urban and Regional Planning, University of WI Madison
.
Vuorinne
,
I.
,
Heiskanen
,
J.
and
Pellikka
,
P.K.E.
(
2021
), “
Assessing leaf biomass of agave sisalana using sentinel-2 vegetation indices
”,
Remote Sensing
, Vol.
13
No.
2
, p.
233
, doi: .
Wachiye
,
S.
,
Merbold
,
L.
,
Vesala
,
T.
,
Rinne
,
J.
,
Räsänen
,
M.
,
Leitner
,
S.
and
Pellikka
,
P.
(
2020
), “
Soil greenhouse gas emissions under different land-use types in savanna ecosystems of Kenya
”,
Biogeosciences
, Vol.
17
No.
8
, pp.
2149
-
2167
, doi: .
Wang
,
T.-C.
and
Chen
,
Y.-H.
(
2008
), “
Applying fuzzy linguistic preference relations to the improvement of consistency of fuzzy AHP
”,
Information Sciences
, Vol.
178
No.
19
, pp.
3755
-
3765
, doi: .
Yebeyen
,
D.
,
Nemomissa
,
S.
,
Hailu
,
B.T.
,
Zewdie
,
W.
,
Sileshi
,
G.W.
,
Rodríguez
,
R.L.
and
Woldie
,
T.M.
(
2022
), “
Modeling and mapping habitat suitability of highland bamboo under climate change in Ethiopia
”,
Forests
, Vol.
13
No.
6
, p.
859
, doi: .
Zamani-Sabzi
,
H.
,
King
,
J.P.
,
Gard
,
C.C.
and
Abudu
,
S.
(
2016
), “
Statistical and analytical comparison of multi-criteria decision-making techniques under fuzzy environment
”,
Operations Research Perspectives
, Vol.
3
, pp.
92
-
117
, doi: .
Zoccali
,
P.
,
Malacrinò
,
A.
,
Campolo
,
O.
,
Laudani
,
F.
,
Algeri
,
G.M.
,
Giunti
,
G.
,
Strano
,
C.P.
,
Benelli
,
G.
and
Palmeri
,
V.
(
2017
), “
A novel GIS-based approach to assess beekeeping suitability of mediterranean lands
”,
Saudi Journal of Biological Sciences
, Vol.
24
No.
5
, pp.
1045
-
1050
, doi: .
Saaty
,
R.W.
(
1987
), “
The analytic hierarchy process—what it is and how it is used
”,
Mathematical Modelling
, Vol.
9
Nos
3-5
, pp.
161
-
176
, doi: .

Languages

or Create an Account

Close subscription notice
Close access options