Skip to article sections
Purpose

The Vietnamese Mekong Delta (VMD), a vital agricultural region supporting millions, faces severe environmental threats from interacting anthropogenic pressures and climate change, profoundly altering its hydrology. A comprehensive, quantitative understanding of recent water level changes is lacking. This study aims to identify and quantify changes in annual flood peaks and key tidal water level characteristics (1980–2024), analyzing the combined drivers.

Design/methodology/approach

This paper analyzed long-term (1980–2024) daily/hourly water level records from strategic hydrometric stations. Time series analysis, including low-pass filtering and Mann–Kendall/Sen’s slope tests, identified significant changes in annual flood peaks, mean water levels (MWLs) and tidal range (TR).

Findings

Analysis reveals significant upstream flood peak decline (especially post-2010s, linked to hydropower). MWL decreased upstream post-2000 but rose substantially mid-delta/coastally, amplified beyond regional relative sea level rise by local factors. Most stations show marked lower low water decreases alongside significant TR increases, indicating enhanced tidal propagation and amplification, more pronounced along the Tien River than the Hau River.

Originality/value

This paper offers a quantitative, spatiotemporal assessment connecting flood and tidal regime changes to the interplay of multiple drivers during accelerating environmental change. It highlights escalating risks—reduced freshwater availability, increased tidal inundation, heightened salinity intrusion—providing crucial insights for developing robust water resource management and climate adaptation strategies essential for the VMD’s sustainability.

However, this vital socioecological system faces mounting pressures from interacting natural processes and rapidly escalating anthropogenic activities, jeopardizing its long-term sustainability (Kondolf et al., 2022). The Vietnamese Mekong Delta (VMD) stands as one of the world’s largest and most productive delta systems, serving as a crucial hub for agriculture, aquaculture and biodiversity, supporting the livelihoods of nearly 20 million inhabitants (Kondolf et al., 2022; Allison et al., 2017). Its global significance is underscored by substantial contributions to regional and global food security, particularly as a leading rice exporter. The regional climate is predominantly monsoonal, characterized by distinct wet (May–November) and dry seasons, with annual rainfall in coastal areas typically ranging from 1.500 to 2.500 mm and consistently high temperatures around 27°C (Dang et al., 2018; Nguyen et al., 2023). This monsoon pattern is a primary driver of the Mekong River’s hydrological cycle, and its interannual variability can be significantly influenced by large-scale climate phenomena such as the El Niño-Southern Oscillation, which can alter precipitation patterns and thus river discharge (Dang et al., 2018).

Over recent decades, particularly since the early 2000s, the VMD has undergone a dramatic transformation, experiencing severe stress from multiple drivers operating across various scales [IPCC (Intergovernmental Panel on Climate Change), 2019; Nguyen et al., 2023]. Upstream, the construction and operation of numerous large hydropower dams have significantly altered the Mekong River’s flow regime and trapped vast quantities of sediment (Kummu et al., 2010; Li et al., 2017). This sediment starvation deprives the delta of materials essential for land building, counteracting natural subsidence and contributing to coastal erosion (Kondolf et al., 2014; Li et al., 2017). Concurrently, intensive sand and gravel mining directly within the VMD’s river channels exacerbates sediment deficits, leading to widespread riverbed incision (deepening) and bank instability (Brunier et al., 2014; Binh et al., 2021). Riverbed incision, extensively documented in the cited literature (e.g. Brunier et al., 2014; Binh et al., 2021), refers to the lowering of the river bottom due to erosive forces exceeding sediment supply. This process, often intensified by reduced sediment loads from upstream dams and direct sand extraction, can lead to deeper channels, which in turn may alter tidal propagation dynamics and lower dry season water levels, impacting irrigation and exacerbating salinity intrusion. Furthermore, extensive groundwater extraction to meet burgeoning agricultural and domestic demands induces significant land subsidence across large parts of the delta plain (Erban et al., 2014; Minderhoud et al., 2017).

These local and regional anthropogenic pressures compound the effects of global climate change, most notably accelerating relative sea level rise (RSLR). RSLR is the combined effect of eustatic (global mean) sea level rise and local vertical land motion, which in the VMD is dominated by subsidence (Erban et al., 2014; Minderhoud et al., 2017). Consequently, rates of RSLR in parts of the VMD (recorded up to 13.5 mm/year in specific coastal areas) far exceed global mean rates (Allison et al., 2017; Nguyen et al., 2023). Evidence suggests these combined pressures caused the VMD to shift from a historically prograding (land-building) system to a retreating (shrinking) state around 2005, coinciding with a marked increase in upstream dam capacity (Li et al., 2017).

These interacting stressors profoundly impact the delta’s hydrological characteristics, altering water levels in complex ways (Eslami et al., 2019). While RSLR inherently raises baseline water levels, particularly near the coast, upstream flow regulation reduces the magnitude of the annual flood pulse (Hoang et al., 2019; Li et al., 2017). Simultaneously, sediment starvation and in-channel mining alter tidal propagation dynamics (Eslami et al., 2019; Nguyen et al., 2023). Deeper channels can reduce frictional resistance, allowing tides to penetrate further inland and potentially amplifying the tidal range (TR) (the difference between high and low tide levels) (Eslami et al., 2019; Nguyen et al., 2023). This enhanced tidal influence, coupled with reduced freshwater discharge during the dry season, significantly increases the risk of salinity intrusion (Dang et al., 2018; Loc et al., 2021). Previous studies have documented alarming rates of RSLR and associated coastal change (Hak et al., 2016; Takagi et al., 2016; Nguyen et al., 2023), analyzed trends at specific locations (Fujihara et al., 2016) or focused on modeling future scenarios (Dang et al., 2018; Hoang et al., 2019). However, a comprehensive, quantitative assessment of observed long-term changes in key water level characteristics – encompassing flood peaks, mean levels and tidal dynamics – across the VMD’s distinct hydro-environmental zones, explicitly linking these changes to the interplay of multiple drivers during the critical period of recent acceleration (post-2000), remains limited (Fujihara et al., 2016; Dang et al., 2018).

This study aims to fill this gap by identifying and quantifying changes in annual flood peak levels and key tidal water level characteristics across the VMD from 1980 to 2024. We analyze long-term water level records from strategically located stations representing upstream, mid-delta and coastal environments. Our objectives are to:

  • identify significant temporal trends and spatial variability in annual flood peaks, mean water level (MWL) and key tidal datums and ranges;

  • contrast trends before and after the major dam construction phase (pre- and post-2000); and

  • analyze the combined influence of altered river discharge, tidal dynamics, likely channel morphology changes (incision), subsidence and sea level rise on the observed water level patterns.

By disentangling these complex interactions, this paper provides a clearer, quantitative picture of the VMD’s evolving hydrodynamics, offering critical insights for sustainable delta management and adaptation planning.

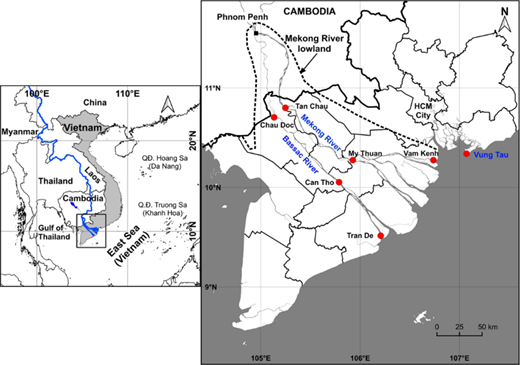
This study focuses on the VMD, a vast and intricate hydrological system formed by the Mekong River, which bifurcates into the Tien and Hau Rivers before branching into a dense network of distributaries discharging into the East Sea (Figure 1). Southern Vietnam consists of the southeast region and the VMD (Lee and Dang, 2020). The southern climate is strongly influenced by the southwest monsoon (Lee and Dang, 2021; Nguyen et al., 2023). The climate of this region is characterized by high temperatures all year round and sunny weather (Lee and Dang, 2020). The average annual temperatures in coastal areas are around 27°C (81°F), which is fairly uniform throughout the year with little difference between the rainy and dry season months of the year (Lee and Dang, 2020). The average annual rainfall in coastal areas is about 1,500–2,500 mm (59–98 in) with the rainy season being between May and November (Lee and Dang, 2020).

The VMD exhibits pronounced spatial gradients in hydrological controls, transitioning from primarily river-dominated conditions upstream near the Cambodian border (represented by the Tien and Hau Rivers) through a transitional tide-river interaction zone in the mid-delta (e.g. My Thuan on the Tien and Can Tho on the Hau) to strongly tide-dominated conditions near the river mouths and coast (e.g. Vam Kenh on a Tien distributary and My Thanh/Tran De on a Hau distributary) (Fujihara et al., 2016).

To capture this spatial variability and identify long-term hydro-environmental changes, we selected and analyzed long-term water level time series from established national hydrometric stations operated by the Southern Regional Hydro-meteorological Center. The selected stations (Table 1, Figure 1) represent the distinct hydrological zones:

Upstream zone: Tan Chau (Tien River) and Chau Doc (Hau River), located near the Cambodian border (∼197 km and ∼187 km from the coast, respectively), primarily reflect incoming river discharge dynamics.

Mid-delta zone: My Thuan (Tien River, ∼88 km) and Can Tho (Hau River, ∼81 km) are transitional region where fluvial and tidal influences.

Estuarine zone: Vam Kenh (Tien River distributary, ∼4 km) and My Thanh/Tran De (Hau River distributary, ∼1–5 km) monitor water levels near the river mouths, dominated by tidal dynamics.

Data acquisition focused primarily on the period 1980–2024 to ensure sufficient record length and reliability across the network for analyzing multidecadal trends. Note that the My Thanh station (Station ID II.1) ceased operation in late 2007 and was functionally replaced by the Tran De station (Station ID II.2), located slightly further inland; their data are treated separately as indicated in Table 1. We also included data from the Vung Tau coastal station (Station ID R), located southeast of the VMD proper, as a stable regional reference point largely unaffected by direct deltaic riverine processes, primarily reflecting regional sea level changes and offshore tidal dynamics (Nguyen et al., 2023).

To analyze the long-term water level records and identify significant changes and trends, we used a combination of time series processing and statistical techniques. Hourly water level data were the primary input for analyzing tidal characteristics and MWLs, while daily data (often derived from hourly records) were suitable for analyzing flood peaks after filtering.

2.2.1 Defining tidal water level characteristics.

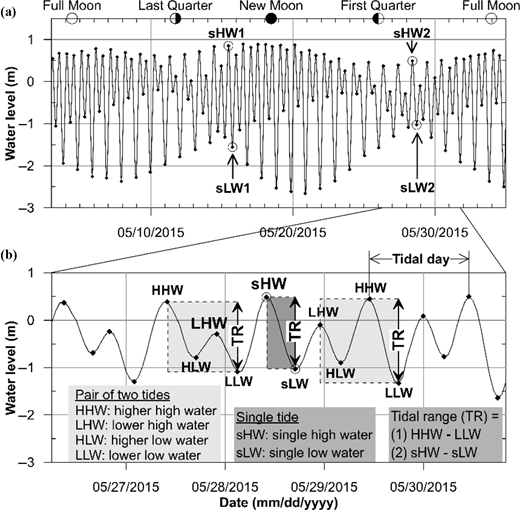
Water levels within the VMD result from the dynamic interaction between freshwater discharge from the Mekong River system and the mixed, predominantly semidiurnal tides propagating from the East Sea (Defant, 1960). This typically generates two high and two low tides within a lunar day (approximately 24.82 h, see Figure 2). Following standard tidal nomenclature [NOAA (National Oceanic and Atmospheric Administration), 2003; Nguyen et al., 2023], we extracted key tidal datums from the hourly water level records: higher high water (HHW), the higher of the two daily high tides; lower high water (LHW), the lower of the two daily high tides; higher low water (HLW), the higher of the two daily low tides; and lower low water (LLW), the lower of the two daily low tides. These datums provide a more detailed characterization of the tidal cycle than simple daily maximum/minimum values. The primary measure of tidal variability used in this study is the TR, calculated as the difference between HHW and LLW (TR = HHW − LLW) for each relevant tidal cycle [Defant, 1960; NOAA (National Oceanic and Atmospheric Administration), 2003]. While some Vietnamese studies equate tidal amplitude with range, technically, the range is twice the amplitude (Defant, 1960). We focus on the range as defined above.

2.2.2 Computation of mean water level.

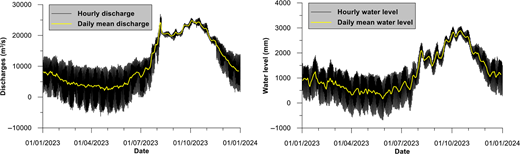
To investigate long-term trends in baseline water levels, which can indicate RSLR or changes in river base flow, we calculated monthly and annual MWL. Simple arithmetic averaging of hourly data can be biased by tidal signals. Therefore, to isolate the lower frequency variations (subtidal, seasonal, interannual and long-term trends), we applied a low-pass filter to the hourly water level data, a standard procedure in sea level research (Pugh and Woodworth, 2014; Caldwell, 2014). Specifically, we used the Doodson X0 filter, a 39-point symmetric filter designed to effectively remove principal diurnal and semidiurnal tidal components while preserving lower frequency signals (Pugh, 1987; Thanh and An, 2024). This filter is recognized for its computational efficiency and reliability in isolating nontidal water level variations (Pugh and Woodworth, 2014). The filtered MWL at time t represents the average water level after removing primary tidal oscillations and high frequency noise (e.g. storm surges), enabling clearer identification of underlying trends. The filter application follows [equation (1)], using the specific Doodson weights [equation (2)] where the sum of weights is 30 [Pugh and Woodworth, 2014; NOAA (National Oceanic and Atmospheric Administration), 2003]. Figure 3 illustrates the filter’s smoothing effect:

(1)
(2)

2.2.3 Trend analysis of water level features.

To objectively identify and quantify long-term trends in the derived water level features (annual flood peaks, MWL, TR and tidal datums), we applied the nonparametric Mann–Kendall test for trend detection and the Sen’s slope estimator for quantifying the trend magnitude (Lee and Dang, 2020, 2021). These methods are widely used in hydrological and climate studies due to their robustness; they do not require data to be normally distributed, are less sensitive to outliers than linear regression and can handle missing values (Lee and Dang, 2020; Nguyen et al., 2022). The Mann–Kendall test assesses whether a monotonic upward or downward trend exists (significant Zs statistic), while Sen’s slope provides the median slope of change over time [equations (3–6) provide the standard formulation]. A positive Zs indicates an upward trend, while a negative Zs indicates a downward trend (Lee and Dang, 2020). We applied these tests to the time series of annual flood peak levels, annual average MWL, annual maximum TR and annual average tidal datums for the overall period (1980–2024) and key subperiods (1980–1999 and 2000–2024) to discern changes coinciding with major anthropogenic shifts. Significance was typically assessed at the p < 0.05 level.

The Mann–Kendall test can be defined by equation (3):

(3)

where S = the test statistic; n = the total of observed annual rainfall variable and Xj, Xi = the observed data series of annual rainfall variables.

With sgn (Xj − Xi) is defined based on equation (4):

(4)

If n ≥ 10, sgn (Xj − Xi) is considered as a standard distribution.

When the statistics of the standard test, denoted as ZS and given by equation (5):

(5)

If ZS is a standard normal distribution, to assess the significance of the trend, a comparison can be made between the value of ZS and the critical value α associated with the specified significance level. This approach, founded on the premise of independence, is known as the original Mann–Kendall test.

When tied ranks occur, the variance of the sum of ranks (S) in equation (3) is defined by equation (6):

(6)

where m = the number of groups of ties; tj = the number of tied observations of each group and S = distribution of the sum of data ranks.

The ZS test is commonly employed to evaluate the significance of trends. If the ZS value is positive, the considered data series expresses an upward trend, while the ZS value is negative, the considered data series shows a downward trend (Lee and Dang, 2020).

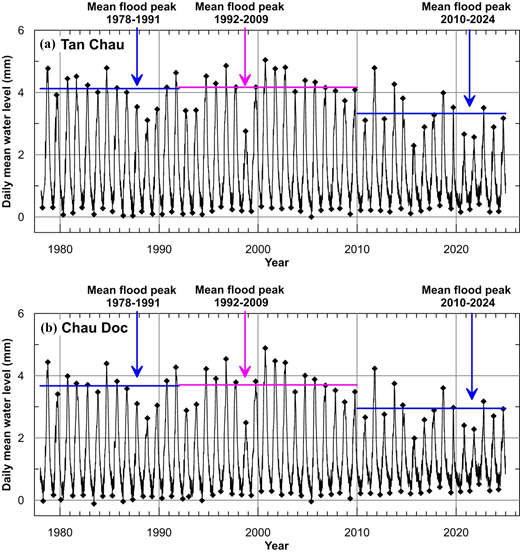
Analysis of annual flood peak levels at the primary upstream gauging stations reveals a statistically significant decrease in the fluvial regime entering the delta. Using daily MWLs filter to remove major tidal signals, we observed a distinct and statistically significant decrease in the magnitude of flood peaks over the 1980–2024 period (e.g. for Tan Chau, ZS = −2.85, p < 0.005; for Chau Doc, ZS = −3.10, p < 0.002) (Table 2). Figure 4 graphically illustrates this trend. This annual flood pulse, clearly visible in Figure 4, is primarily driven by the summer monsoon rainfall in the Mekong basin upstream of the delta. While considerable interannual variability persists, characteristic of the Mekong’s hydrology, a clear reduction in maximum water levels during the flood season is apparent. This decline is particularly evident when comparing the most recent period (2010–2024) to earlier decades.

For instance, at Tan Chau (Figure 4A), the average annual peak water level decreased from approximately 4.34 m (1978–1991) to about 3.69 m (1992–2009) and further declined to roughly 3.51 m (2010–2024). The exclusion of anomalous years for robustness involved identifying extreme outliers based on statistical deviations (e.g. >3.0 standard deviations from the period mean) or known exceptionally disruptive events not representative of the general trend, ensuring that the calculated averages for subperiods were not unduly skewed by such isolated occurrences; this check was applied consistently when defining representative period averages. A similar, although slightly less pronounced, decline occurred at Chau Doc (Figure 4B), with average peaks falling from roughly 4.04 m (1978–1991) to 3.63 m (1992–2009) and then to approximately 3.25 m (2010–2024). Notably high flood years like 1996 and 2000 stand in contrast to the generally lower peaks observed after 2010 (excepting 2011). This trend toward attenuated flood peaks exhibits a strong temporal correlation with the accelerated phase of major hydropower dam construction and operation in the upper Mekong basin, particularly post-2000 (Kondolf et al., 2014; Li et al., 2017).

While a specific statistical correlation value between dam capacity and flood peak reduction at these VMD stations was not calculated in this study, the literature widely documents the flow regulation effects of large dams, which include storing wet season flows and thereby reducing downstream flood magnitudes (e.g. Manh et al., 2014).

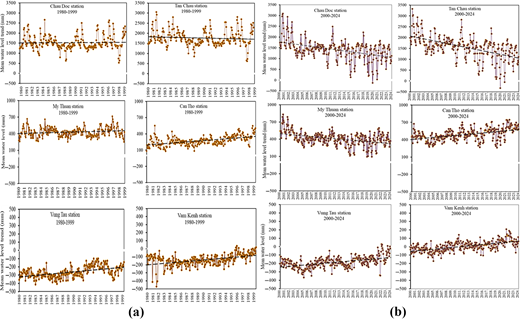
Analysis of MWL trends reveals a complex spatial pattern strongly influenced by the interplay of upstream regulation and downstream marine processes (Table 3, Figures 5A and B). At the upstream stations, MWL trends were statistically insignificant during the 1980–1999 period. However, post-2000, both stations experienced significantly (p < 0.0001) and rapid MWL decline (−33.0 mm/year at Tan Chau and −19.1 mm/year at Chau Doc). This dramatic drop strongly implicates upstream hydropower regulation and potential associated riverbed incision, dominating any local RSLR signal. In the mid-delta, My Thuan (Tien River) showed a modest MWL rise (+2.6 mm/year) pre-2000, which reversed to a significant decline (−6.1 mm/year) post-2000, suggesting downstream propagation of upstream impacts. Conversely, Can Tho (Hau River) exhibited significant MWL rise during both periods (+8.6 mm/year pre-2000 and +7.3 mm/year post-2000), indicating dominant marine influences (RSLR compounded by subsidence). The coastal station Vam Kenh mirrored Can Tho’s pattern, with significant rises (+5.5 mm/year pre-2000 and +4.9 mm/year post-2000). Comparing these trends to the Vung Tau reference station (+5.9 mm/year pre-2000, +4.3 mm/year post-2000 and +3.8 mm/year overall) highlights significant amplification of MWL rise within the delta at stations like Can Tho (+9.3 mm/year overall) and Vam Kenh (+6.0 mm/year overall). This amplification strongly suggests that local land subsidence significantly contributes to the observed RSLR within the delta plain (Erban et al., 2014).

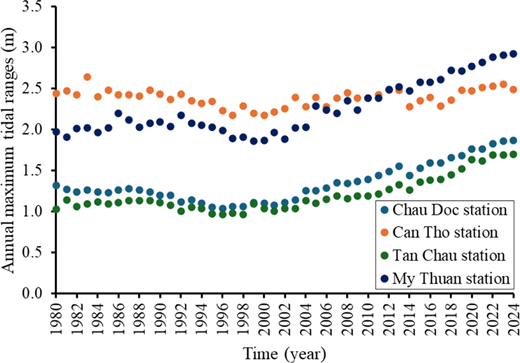
In contrast to the diminishing fluvial influence, tidal dynamics within the VMD have markedly intensified. Analysis of annual maximum TR reveals a significant and accelerating increase across the delta, particularly pronounced since the early 2000s (Figure 6). This amplification of tidal wave propagation has major implications for the delta’s hydrodynamics and environment. Consider the upstream stations, Tan Chau and Chau Doc, where river discharge historically imposes the strongest damping effect. During the 1980–1990 period, before major upstream hydropower impacts, the annual maximum TR typically fluctuated around 1.0–1.1 m at Tan Chau and 1.2–1.3 m at Chau Doc. However, in the post-2000 era (specifically 2000–2024), these ranges rose substantially. By the 2010s and early 2020s, maximum TR frequently exceeded 1.6–1.8 m at both stations – an increase of approximately 50%–60% compared to the earlier period. This dramatic upstream tidal amplification strongly suggests that reduced freshwater discharge allows the tidal wave to penetrate further inland with less opposition. Furthermore, widespread riverbed incision, as reported in literature (e.g. Binh et al., 2021; Eslami et al., 2019), likely deepens channels and reduces frictional resistance, further enhancing tidal wave propagation and increasing TR (Binh et al., 2021).

Moving downstream to the mid-delta stations, My Thuan and Can Tho, tidal influence is inherently stronger, yet these locations also exhibit substantial increases in TR, especially after 2000. At My Thuan, the maximum TR increased from roughly 2.0–2.1 m during the early stage (1980–1990) to consistently exceeding 2.5 m and reaching over 2.9 m in recent years (2020–2024), a substantial increase of roughly 0.8–0.9 m.

At Can Tho, while during the early stage (1980–1990) the range was higher (around 2.4 m), the increase has been less dramatic but still evident, reaching approximately 2.5–2.6 m recently. The more pronounced increase at My Thuan concurs with findings noted earlier suggesting faster hydrological changes along the Tien River. This downstream amplification likely results from combined upstream effects (reduced damping) and local factors like mineral mining, which contribute significantly to the observed drop in lower low water level (Eslami et al., 2019).

This study quantifies a profound and accelerating transformation of the VMD’s hydrological regime, revealing interconnected shifts in flood dynamics, MWLs and tidal characteristics driven by synergistic anthropogenic and climate-related pressures. The post-2000 period emerges as a critical era of change, marked by the intensified influence of upstream hydropower dams, ongoing RSLR, potentially significant land subsidence (Erban et al., 2014; Minderhoud et al., 2017) and likely widespread channel morphology adjustments due to sand mining and reduced sediment loads. The role of riverbed incision, driven by sediment trapping in upstream reservoirs (Kondolf et al., 2014) and extensive in-channel sand extraction within the delta (Brunier et al., 2014; Binh et al., 2021), is crucial in this transformation. While not directly measured in this study, the hydrological signatures observed, such as falling upstream MWL and increased TRs, are consistent with the effects of channel deepening reported in these prior investigations. Incision reduces frictional resistance, facilitating tidal wave propagation and amplification (Eslami et al., 2019; Nguyen et al., 2023), and also directly lowers LLW levels, mathematically increasing the TR.

The data clearly demonstrate the powerful, yet spatially distinct, impact of anthropogenic pressors. The significant post-2000 decline in both flood peaks and MWL at Tan Chau and Chau Doc directly correlates with increased upstream water storage and flow alteration (Manh et al., 2014; Li et al., 2017). This reduction in fluvial energy fundamentally alters the river-tide balance. Paradoxically, reduced freshwater flows allow the tide to propagate further upstream with less attenuation, contributing to the dramatic increase observed in TR (by 50%–60%) at these formerly river-dominated locations since 2000.

Concurrently, riverbed incision, driven by sediment trapping in upstream reservoirs (Kondolf et al., 2014) and extensive in-channel sand extraction within the delta (Brunier et al., 2014; Binh et al., 2021), likely plays a crucial role. Mineral mining reduces frictional resistance, further facilitating tidal wave propagation and amplification (Eslami et al., 2019; Nguyen et al., 2023). This incision also directly LLW, mathematically increasing the TR. While this study did not directly measure bathymetric change, the observed hydrological shifts – particularly the falling MWL and increasing TR upstream – strongly imply that mineral mining significantly contributes to the altered water levels.

Downstream, the hydrological signature reflects the complex interplay of these factors with RSLR and subsidence. The amplified rates of MWL rise observed at Can Tho and Vam Kenh compared to the regional RSLR benchmark underscore the critical role of land subsidence, primarily linked to groundwater extraction (Erban et al., 2014; Minderhoud et al., 2017), in exacerbating water level increases within the delta. The increasing TR in these areas results from the combined effects of less upstream damping, rising HHW driven by RSLR and falling LLW linked to mineral mining.

These interconnected hydrological shifts have severe implications. The combination of lower freshwater flows, rising sea levels and amplified TRs creates conditions highly favorable for enhanced saline intrusion, pushing saltwater further inland and threatening freshwater resources vital for the delta’s agriculture and population (Dang et al., 2018; Loc et al., 2021). Furthermore, the overall lowering of river water levels relative to the land surface in many areas, particularly the drop in LLW due to incision, presents significant challenges for existing irrigation infrastructure, potentially reducing water availability at intakes and requiring costly adaptations or changes in pumping schedules (Minderhoud et al., 2017). Finally, while upstream flood peaks decrease, rising mean sea levels and increased TRs heighten the risk of coastal and tidal inundation further downstream.

This paper provides a quantitative, spatiotemporal analysis of significant water level changes across the VMD from 1980 to 2024, revealing a system undergoing rapid transformation. Our findings document a clear decline in upstream flood peaks and MWLs, particularly after 2000, directly linked to anthropogenic pressors development.

Concurrently, we observed a delta-wide, accelerating increase in TR, driven by reduced freshwater damping and likely channel deepening due to sediment starvation and sand mining. Downstream MWLs show significant increases, amplified well beyond regional sea level rise rates by local land subsidence.

These interconnected changes – reduced fluvial discharge, rising baseline sea levels significantly amplified by subsidence and enhanced tidal propagation due to channel modification – signal a fundamental shift toward greater marine influence and heightened vulnerability within the VMD. The consequences include escalating risks of saline intrusion, increased tidal inundation and challenges to water resource management and agricultural irrigation.

The findings underscore the urgent need for integrated management strategies that address the compounding impacts of anthropogenic pressors, local pressures and sea level rise to foster adaptation and ensure a sustainable future for this critical delta region. Such strategies should consider several key interconnected domains.

Sediment management: Implement policies to manage sediment budgets more effectively. This could involve regulating sand mining within the delta, potentially restricting it to locations where impacts are minimized or exploring possibilities for sediment bypassing.

Coordinated dam operation: Foster transboundary cooperation for more coordinated operation of upstream hydropower dams, aiming to mimic more natural flow variations, particularly during critical periods for VMD ecology and agriculture.

Water-efficient agriculture and aquaculture: Promote and support the adoption of water-saving irrigation techniques, cultivation of salt-tolerant crop varieties and sustainable aquaculture practices that reduce freshwater demand and are resilient to increased salinity.

Groundwater management: Develop and enforce stricter regulations on groundwater extraction to mitigate land subsidence, coupled with investments in alternative freshwater sources and improved surface water storage and distribution systems.

Adaptive infrastructure and coastal protection: Invest in adaptive infrastructure, such as upgrading sluice gates and dyke systems to manage tidal inundation and salinity, alongside nature-based solutions for coastal protection where appropriate.

Enhanced monitoring and early warning systems: Strengthen hydro-meteorological monitoring networks and develop improved early warning systems for floods, droughts and salinity intrusion to support proactive decision-making.

Addressing these multifaceted challenges requires a holistic and adaptive management approach, integrating scientific understanding with socioeconomic considerations and robust governance frameworks.

The authors would like to thank the Southern Institute of Water Resources Research (SIWRR) and the Ministry of Science and Technology (MOST) for their support in providing the core database that was essential to developing the idea for this study.

Erratum: It has come to the attention of the publisher that the article: Cong Thanh N, Xuan Kha N, Nghia Hung N, Truong An D (2025), “Impacts of anthropogenic stressors and climate change on hydrology regime in the Vietnamese Mekong Delta”. International Journal of Climate Change Strategies and Management, Vol. 17 No. 1 pp. 963-979, doi: Link to Impacts of anthropogenic stressors and climate change on hydrology regime in the Vietnamese Mekong DeltaLink to the cited article failed to include the second affiliations for the following authors; Nguyen Cong Thanh, Nguyen Xuan Kha and Dang Truong An. Vietnam National University-Ho Chi Minh City, Ho Chi Minh City, Vietnam has now been included. This error occurred during the production process and has now been updated online.

The publisher sincerely apologises for this error and for any inconvenience caused.
Allison
,
M.A.
,
Weathers
,
H.D.
and
Meselhe
,
E.A.
(
2017
), “
Bottom morphology in the Song Hau distributary channel, Mekong River Delta, Vietnam
”,
Continental Shelf Research
, Vol.
147
, pp.
51
-
61
, doi: .
Binh
,
D.V.
,
Kantoush
,
S.A.
,
Sumi
,
T.
,
Mai
,
N.P.
,
Ngoc
,
T.A.
,
Trung
,
L.V.
and
An
,
T.D.
(
2021
), “
Effects of riverbed incision on the hydrology of the Vietnamese Mekong Delta
”,
Hydrological Processes
, Vol.
35
No.
2
, p.
e14030
, doi: .
Brunier
,
G.
,
Anthony
,
E.J.
,
Goichot
,
M.
,
Provansal
,
M.
and
Dussouillez
,
P.
(
2014
), “
Recent morphological changes in the Mekong and Bassac river channels, Mekong delta: the marked impact of river-bed mining and implications for delta destabilisation
”,
Geomorphology
, Vol.
224
, pp.
177
-
191
, doi: .
Caldwell
,
P.C.
(
2014
),
Hourly Sea Level Data Processing and Quality Control Software: updated for 64-Bit Microsoft Operating Systems, SLP64 User Manual, Version 4.0, JIMAR Contribution No. 14-389
,
University of HI Joint Institute for Marine and Atmospheric Research
,
Honolulu, HI
.
Dang
,
T.D.
,
Cochrane
,
T.A.
,
Arias
,
M.E.
and
Tri
,
V.P.D.
(
2018
), “
Future hydrological alterations in the Mekong delta under the impact of water resources development, land subsidence and sea level rise
”,
Journal of Hydrology: Regional Studies
, Vol.
15
, pp.
119
-
133
, doi: .
Defant
,
A.
(
1960
),
Physical Oceanography
,
Pergamon Press
,
Oxford
, Vol.
2
.
Erban
,
L.E.
,
Gorelick
,
S.M.
and
Zebker
,
H.A.
(
2014
), “
Groundwater extraction, land subsidence, and sea-level rise in the Mekong Delta, Vietnam
”,
Environmental Research Letters
, Vol.
9
No.
8
, p.
84010
, doi: .
Eslami
,
S.
,
Hoekstra
,
P.
,
Nguyen Trung
,
N.
,
Ahmed Kantoush
,
S.
,
Van Binh
,
D.
,
Duc Dung
,
D.
,
Tran Quang
,
T.
and
van der Vegt
,
M.
(
2019
), “
Tidal amplification and salt intrusion in the Mekong Delta driven by anthropogenic sediment starvation
”,
Scientific Reports
, Vol.
9
No.
1
, p.
18746
, doi: .
Fujihara
,
Y.
,
Hoshikawa
,
K.
,
Fujii
,
H.
,
Kotera
,
A.
,
Nagano
,
T.
and
Yokoyama
,
S.
(
2016
), “
Analysis and attribution of trends in water levels in the Vietnamese Mekong Delta
”,
Hydrological Processes
, Vol.
30
No.
6
, pp.
835
-
845
, doi: .
Hak
,
D.
,
Nadaoka
,
K.
,
Bernado
,
L.P.
,
Le Phu
,
V.
,
Nguyen
,
H.Q.
,
Tran
,
Q.T.
,
Nguyen
,
H.T.
,
Du
,
V.N.
and
Pham
,
D.T.
(
2016
), “
Spatio-temporal variations of sea level around the Mekong delta: their causes and consequences on the coastal environment
”,
Hydrological Research Letters
, Vol.
10
No.
2
, pp.
60
-
66
, doi: .
Hoang
,
L.P.
,
van Viet
,
M.T.H.
,
Kummu
,
M.
,
Lauri
,
H.
,
Koponen
,
J.
,
Supit
,
I.
,
Leemans
,
R.
,
Kabat
,
P.
and
Ludwig
,
F.
(
2019
), “
The Mekong’s future flows under multiple drivers: how climate change, hydropower developments and irrigation expansions drive hydrological changes
”,
Science of The Total Environment
, Vol.
649
, pp.
601
-
609
, doi: .
IPCC (Intergovernmental Panel on Climate Change)
(
2019
),
IPCC Special Report on the Ocean and Cryosphere in a Changing Climate
, in
Pörtner
,
H.-O.
,
Roberts
,
D.C.
,
Masson-Delmotte
,
V.
,
Zhai
,
P.
,
Tignor
,
M.
,
Poloczanska
,
E.
,
Mintenbeck
,
K.
,
Alegría
,
A.
,
Nicolai
,
M.
,
Okem
,
A.
,
Petzold
,
J.
,
Rama
,
B.
and
Weyer
,
N.M.
(Eds),
Cambridge University Press
,
Cambridge, UK and New York, NY
.
Kondolf
,
G.M.
,
Rubin
,
Z.K.
and
Minear
,
J.T.
(
2014
), “
Dams on the Mekong: cumulative sediment starvation
”,
Water Resources Research
, Vol.
50
No.
6
, pp.
5158
-
5169
, doi: .
Kondolf
,
G.M.
,
Schmitt
,
R.J.P.
,
Carling
,
P.
,
Goichot
,
M.
,
Keskinen
,
M.
,
Arias
,
M.E.
,
Bizzi
,
S.
,
Castelletti
,
A.
,
Cochrane
,
T.A.
,
Darby
,
S.E.
,
Kummu
,
M.
,
Minderhoud
,
P.S.J.
,
Nguyen
,
H.T.
,
Nguyen
,
T.D.
,
Oeurng
,
C.
,
Opperman
,
J.J.
,
Rubin
,
Z.
,
San
,
D.C.
,
Schmeier
,
S.
and
Wild
,
T.B.
(
2022
), “
Save the Mekong Delta from drowning
”,
Science
, Vol.
376
No.
6593
, pp.
583
-
585
, doi: .
Kummu
,
M.
,
Lu
,
X.X.
,
Wang
,
J.J.
and
Varis
,
O.
(
2010
), “
Basin-wide sediment trapping efficiency of emerging reservoirs along the Mekong
”,
Geomorphology
, Vol.
119
Nos
3-4
, pp.
181
-
197
, doi: .
Lee
,
S.K.
and
Dang
,
T.A.
(
2020
), “
Extreme rainfall trends over the Mekong Delta under the impacts of climate change
”,
International Journal of Climate Change Strategies and Management
, Vol.
12
No.
5
, pp.
639
-
652
, doi: .
Lee
,
S.K.
and
Dang
,
T.A.
(
2021
), “
Precipitation variability and trends over the Mekong Delta area of Vietnam
”,
Journal of Agrometeorology
, Vol.
21
No.
2
, pp.
217
-
219
, doi: .
Li
,
D.
,
Long
,
D.
,
Zhao
,
J.
,
Lu
,
H.
and
Hong
,
Y.
(
2017
), “
Observed changes in flow regimes in the Mekong river basin
”,
Journal of Hydrology
, Vol.
551
, pp.
217
-
232
, doi: .
Loc
,
H.H.
,
Van Binh
,
D.
,
Umetsu
,
C.
and
Minh
,
V.Q.
(
2021
), “
Intensifying saline water intrusion and drought in the Mekong Delta: from physical evidence to policy outlooks
”,
Ambio
, Vol.
50
, pp.
645
-
656
, doi: .
Manh
,
N.V.
,
Dung
,
N.V.
,
Hung
,
N.N.
,
Merz
,
B.
and
Apel
,
H.
(
2014
), “
Large-scale suspended sediment transport and sediment deposition in the Mekong Delta
”,
Hydrology and Earth System Sciences
, Vol.
18
No.
8
, pp.
3033
-
3053
, doi: .
Minderhoud
,
P.S.J.
,
Erkens
,
G.
,
Pham
,
V.H.
,
Bui
,
V.T.
,
Erban
,
L.
,
Kooi
,
H.
and
Stouthamer
,
E.
(
2017
), “
Impacts of 25 years of groundwater extraction on subsidence in the Mekong Delta, Vietnam
”,
Environmental Research Letters
, Vol.
12
No.
6
, p.
64006
, doi: .
Nguyen
,
C.T.
,
Schwarzer
,
K.
and
Ricklefs
,
K.
(
2023
), “
Water-level changes and subsidence rates along the Saigon-Dong Nai river estuary and the east sea coastline of the Mekong Delta
”,
Estuarine, Coastal and Shelf Science
, Vol.
283
, p.
108259
, doi: .
Nguyen
,
N.T.
,
Nguyen
,
T.A.
,
Nguyen
,
H.T.
,
Nguyen
,
C.T.
,
Marfai
,
M.A.
and
Dang
,
T.A.
(
2022
), “
Trend analysis of rainfall in the Mekong Delta, Vietnam
”,
Journal of Climate Change Science
, Vol.
6
No.
1
, pp.
1
-
10
.
NOAA (National Oceanic and Atmospheric Administration)
(
2003
), “Computational techniques for tidal datums handbook”,
Special Publication NOS CO-OPS 2
,
National Ocean Service
,
Silver Spring, MD
.
Pugh
,
D.
and
Woodworth
,
P.
(
2014
),
Sea-Level Science: Understanding Tides, Surges, Tsunamis and Mean Sea-Level Changes
,
Cambridge University Press
,
Cambridge
.
Pugh
,
D.T.
(
1987
),
Tides, Surges and Mean Sea-Level
,
John Wiley and Sons
,
Chichester
.
Takagi
,
H.
,
Thao
,
N.D.
,
Anh
,
L.T.
,
Quang
,
N.X.
,
Anh
,
N.L.
and
Anh
,
L.T.
(
2016
), “
Sea-level rise and land subsidence: impacts on flood projections for the Mekong Delta’s largest city
”,
Sustainability
, Vol.
8
No.
9
, p.
959
, doi: .
Thanh
,
N.C.
and
An
,
D.T.
(
2024
), “
Assessing water level variability in the Mekong Delta under the impacts of anthropogenic and climatic factors
”,
Journal of Environmental and Earth Sciences
, Vol.
7
No.
1
, pp.
123
-
131
, doi: .
Codiga
,
D.L.
(
2011
),
Unified Tidal Analysis and Prediction Using the UTide Matlab Functions
,
Technical Report 2011-01
Graduate School of Oceanography, University of RI
,
Narragansett, RI
.
Dunn
,
F.E.
and
Minderhoud
,
P.S.J.
(
2022
), “
Sedimentation strategies provide effective but limited mitigation of relative sea-level rise in the Mekong Delta
”,
Communications Earth and Environment
, Vol.
3
No.
1
, doi: .
Kendall
,
M.G.
(
1975
),
Rank Correlation Methods
, (4th ed) .,
Charles Griffin
,
London
.
Pawlowicz
,
R.
,
Beardsley
,
B.
and
Lentz
,
S.
(
2002
), “
Classical tidal harmonic analysis including error estimates in MATLAB using T_TIDE
”,
Computers and Geosciences
, Vol.
28
No.
8
, pp.
929
-
937
.
Sen
,
P.K.
(
1968
), “
Estimates of the regression coefficient based on Kendall’s Tau
”,
Journal of the American Statistical Association
, Vol.
63
No.
324
, pp.
1379
-
1389
.
Published by Emerald Publishing Limited. This article is published under the Creative Commons Attribution (CC BY 4.0) licence. Anyone may reproduce, distribute, translate and create derivative works of this article (for both commercial and non-commercial purposes), subject to full attribution to the original publication and authors. The full terms of this licence may be seen at http://creativecommons.org/licences/by/4.0/

Data & Figures

Figure 1.
A map showing Vietnam and parts of Cambodia, highlighting the Mekong River and key locations like Vung Tau and Can Tho.The map illustrates the geography of Vietnam and a portion of Cambodia, emphasizing the Mekong River and its tributaries. The names of countries, major rivers, and cities are clearly labelled, with particular focus on cities like Phnom Penh, Vung Tau, Can Tho, and others, indicated by red dots. The map includes geographical markers such as meridians at ten-degree intervals, a scale bar indicating distance, and directional north arrow at the top. Additional features include dashed outlines indicating lowland areas and river paths, which enhance the understanding of the region's landscape.

Map of the study area showing the VMD and locations of the national hydrometric stations used for water level analysis. The dotted line indicates the Mekong River lowland.

Figure 1.
A map showing Vietnam and parts of Cambodia, highlighting the Mekong River and key locations like Vung Tau and Can Tho.The map illustrates the geography of Vietnam and a portion of Cambodia, emphasizing the Mekong River and its tributaries. The names of countries, major rivers, and cities are clearly labelled, with particular focus on cities like Phnom Penh, Vung Tau, Can Tho, and others, indicated by red dots. The map includes geographical markers such as meridians at ten-degree intervals, a scale bar indicating distance, and directional north arrow at the top. Additional features include dashed outlines indicating lowland areas and river paths, which enhance the understanding of the region's landscape.

Map of the study area showing the VMD and locations of the national hydrometric stations used for water level analysis. The dotted line indicates the Mekong River lowland.

Close modal
Figure 2.
Two graphs present water level variations during May 2015, with annotations for tidal stages, high and low water types, celestial events, and tidal ranges.The figure displays two graphs charting water level changes over May 2015. Graph (a) plots water level in meters against dates, marking new moon and full moon phases. It highlights significant tidal points labelled s H W 1, s L W 1, s H W 2, and s L W 2, connected by a continuous fluctuating line. Graph (b) emphasises tidal structure, identifying higher high water, lower high water, higher low water, and lower low water. Both paired tides and single tide scenarios are shown, with shaded areas indicating tidal ranges. The horizontal axis shows days of May 2015, and the vertical axis provides consistent water level scale. The presentation clearly demonstrates tidal fluctuations and stages in relation to lunar phases, aiding comparative interpretation of tidal behaviour across the period.

Illustration of typical tidal water level fluctuations in the VMD, showing the mixed semidiurnal tide with two high and two low tides within a tidal day (approx. 24.8 h). Panel (a) shows variations over several weeks including springneap cycles. Panel (b) details the definition of tidal datums and tidal range over a few days

Source: Nguyen et al. (2023) 

Figure 2.
Two graphs present water level variations during May 2015, with annotations for tidal stages, high and low water types, celestial events, and tidal ranges.The figure displays two graphs charting water level changes over May 2015. Graph (a) plots water level in meters against dates, marking new moon and full moon phases. It highlights significant tidal points labelled s H W 1, s L W 1, s H W 2, and s L W 2, connected by a continuous fluctuating line. Graph (b) emphasises tidal structure, identifying higher high water, lower high water, higher low water, and lower low water. Both paired tides and single tide scenarios are shown, with shaded areas indicating tidal ranges. The horizontal axis shows days of May 2015, and the vertical axis provides consistent water level scale. The presentation clearly demonstrates tidal fluctuations and stages in relation to lunar phases, aiding comparative interpretation of tidal behaviour across the period.

Illustration of typical tidal water level fluctuations in the VMD, showing the mixed semidiurnal tide with two high and two low tides within a tidal day (approx. 24.8 h). Panel (a) shows variations over several weeks including springneap cycles. Panel (b) details the definition of tidal datums and tidal range over a few days

Source: Nguyen et al. (2023) 

Close modal
Figure 3.
Two graphs compare hourly and daily mean values of discharge and water level from January 2023 to January 2024.The figure presents two time series graphs covering January 2023 to January 2024. The left graph plots discharge in cubic metres per second, showing hourly discharge as a fluctuating line and daily mean discharge as a smoother line. Discharge values peak around mid-2023 and again in late 2023, exceeding 20000 cubic metres per second. The right graph plots water level in millimetres, with hourly water level shown as a fluctuating line and daily mean water level as a smoother line. Water levels remain below 1000 millimetres until mid-2023, then rise sharply with peaks in late 2023 above 3000 millimetres. Both graphs indicate strong seasonal variations with synchronised peaks in discharge and water level, highlighting periods of increased flow and flooding risk.

Example of hourly measured water level and discharge (flow) data series at Tan Chau station during 2023, before (black line) and after (yellow line) application of the 39-point Doodson X0 low-pass filter to remove tidal signals and reveal underlying seasonal variations

Source: Created by authors

Figure 3.
Two graphs compare hourly and daily mean values of discharge and water level from January 2023 to January 2024.The figure presents two time series graphs covering January 2023 to January 2024. The left graph plots discharge in cubic metres per second, showing hourly discharge as a fluctuating line and daily mean discharge as a smoother line. Discharge values peak around mid-2023 and again in late 2023, exceeding 20000 cubic metres per second. The right graph plots water level in millimetres, with hourly water level shown as a fluctuating line and daily mean water level as a smoother line. Water levels remain below 1000 millimetres until mid-2023, then rise sharply with peaks in late 2023 above 3000 millimetres. Both graphs indicate strong seasonal variations with synchronised peaks in discharge and water level, highlighting periods of increased flow and flooding risk.

Example of hourly measured water level and discharge (flow) data series at Tan Chau station during 2023, before (black line) and after (yellow line) application of the 39-point Doodson X0 low-pass filter to remove tidal signals and reveal underlying seasonal variations

Source: Created by authors

Close modal
Figure 4.
Two graphs show daily mean water levels from 1978 to 2024 for Tan Chau and Chau Doc, with mean flood peaks marked for 1978 to 1991, 1992 to 2009, and 2010 to 2024.The figure presents two line graphs of daily mean water levels in millimetres from 1978 to 2024. Graph (a) depicts Tan Chau and graph (b) depicts Chau Doc. The vertical axis ranges from 0 to 6 millimetres, and the horizontal axis represents years. Black diamond points joined by lines illustrate seasonal fluctuations and flood peaks. Horizontal reference lines denote mean flood peaks for three time spans: 1978 to 1991, 1992 to 2009, and 2010 to 2024, each marked with arrows. The data indicates high flood peaks during earlier decades, with reduced levels during the most recent period, allowing comparison between the two locations across the defined intervals.

Time series of annual flood peak levels (m) at (a) Tan Chau station and (b) Chau Doc station for the period 1978–2024. Data represent daily MWLs after applying the Doodson X0 filter to remove tidal signals. Horizontal lines indicate average peak levels for the specified subperiods

Source: Created by authors

Figure 4.
Two graphs show daily mean water levels from 1978 to 2024 for Tan Chau and Chau Doc, with mean flood peaks marked for 1978 to 1991, 1992 to 2009, and 2010 to 2024.The figure presents two line graphs of daily mean water levels in millimetres from 1978 to 2024. Graph (a) depicts Tan Chau and graph (b) depicts Chau Doc. The vertical axis ranges from 0 to 6 millimetres, and the horizontal axis represents years. Black diamond points joined by lines illustrate seasonal fluctuations and flood peaks. Horizontal reference lines denote mean flood peaks for three time spans: 1978 to 1991, 1992 to 2009, and 2010 to 2024, each marked with arrows. The data indicates high flood peaks during earlier decades, with reduced levels during the most recent period, allowing comparison between the two locations across the defined intervals.

Time series of annual flood peak levels (m) at (a) Tan Chau station and (b) Chau Doc station for the period 1978–2024. Data represent daily MWLs after applying the Doodson X0 filter to remove tidal signals. Horizontal lines indicate average peak levels for the specified subperiods

Source: Created by authors

Close modal
Figure 5.
A series of graphs illustrating mean water levels at various stations over two decades, displaying trends from 1980 to 1999 and 2000 to 2024.The image features multiple graphs arranged in a 2 by 4 grid showing mean water levels at different stations over two time periods: 1980 to 1999 and 2000 to 2024. Each graph plots years on the horizontal axis with increments from 1980 to 1999 and from 2000 to 2024, while the vertical axis represents mean water levels in millimeters, ranging significantly across the stations. The data points are represented with circles and connected by lines, demonstrating fluctuations in water levels over time. Each station has its own graph, clearly labeled above, including Chau Doc, Tan Chau, My Thuan, Can Tho, Vung Tau, and Vam Kenh. The graphs illustrate trends, with error bars showing variability. The layout is organized so that 1980-1999 data is in the top row, and 2000-2024 data in the bottom row for direct comparison.

Trends in annual mean water level (mm) at observation stations during (a) the early stage 1980–1999 and (b) the later stage 2000–2024

Source: Created by authors

Figure 5.
A series of graphs illustrating mean water levels at various stations over two decades, displaying trends from 1980 to 1999 and 2000 to 2024.The image features multiple graphs arranged in a 2 by 4 grid showing mean water levels at different stations over two time periods: 1980 to 1999 and 2000 to 2024. Each graph plots years on the horizontal axis with increments from 1980 to 1999 and from 2000 to 2024, while the vertical axis represents mean water levels in millimeters, ranging significantly across the stations. The data points are represented with circles and connected by lines, demonstrating fluctuations in water levels over time. Each station has its own graph, clearly labeled above, including Chau Doc, Tan Chau, My Thuan, Can Tho, Vung Tau, and Vam Kenh. The graphs illustrate trends, with error bars showing variability. The layout is organized so that 1980-1999 data is in the top row, and 2000-2024 data in the bottom row for direct comparison.

Trends in annual mean water level (mm) at observation stations during (a) the early stage 1980–1999 and (b) the later stage 2000–2024

Source: Created by authors

Close modal
Figure 6.
A line graph illustrating annual maximum tidal ranges from 1980 to 2024 at four stations, showing variations in tidal ranges with different coloured markers for each station.This line graph displays the annual maximum tidal ranges measured in metres from the year 1980 to 2024 across four different stations: Chau Doc, Can Tho, Tan Chau, and My Thuan. The vertical axis represents tidal ranges measured in metres, ranging from zero to three and a half metres, while the horizontal axis denotes the years from 1980 to 2024. Each station is represented by a distinct colour: blue for Chau Doc station, orange for Can Tho station, green for Tan Chau station, and dark blue for My Thuan station. The graph features individual data points plotted for each year, with some data points connected by lines to show trends. The legend is positioned on the right side of the graph, detailing the colour coding for each station.

Time series of annual maximum tidal ranges (m) at Tan Chau, Chau Doc, Can Tho and My Thuan stations for the period 1980–2024

Source: Created by authors

Figure 6.
A line graph illustrating annual maximum tidal ranges from 1980 to 2024 at four stations, showing variations in tidal ranges with different coloured markers for each station.This line graph displays the annual maximum tidal ranges measured in metres from the year 1980 to 2024 across four different stations: Chau Doc, Can Tho, Tan Chau, and My Thuan. The vertical axis represents tidal ranges measured in metres, ranging from zero to three and a half metres, while the horizontal axis denotes the years from 1980 to 2024. Each station is represented by a distinct colour: blue for Chau Doc station, orange for Can Tho station, green for Tan Chau station, and dark blue for My Thuan station. The graph features individual data points plotted for each year, with some data points connected by lines to show trends. The legend is positioned on the right side of the graph, detailing the colour coding for each station.

Time series of annual maximum tidal ranges (m) at Tan Chau, Chau Doc, Can Tho and My Thuan stations for the period 1980–2024

Source: Created by authors

Close modal
Table 1.

Basic information on water level monitoring stations used in the analysis

Station IDNameRiverLatitudeLongitudeDistance from river mouth (km)Duration (year)
I.1Vam KenhTien10.274444106.73722241980–2024
I.2My ThuanTien10.275000105.926389881980–2024
I.3Tan ChauTien10.800556105.2477781971980–2024
II.1–1My Thanh*Hau9.424778106.17091711981–2004
II.1–2Tran De*Hau9.515000106.20694452008–2024
II.2Can ThoHau10.052778105.787222811980–2024
II.3Chau DocHau10.705278105.1336111871980–2024
RVung Tau**East Sea10.339444107.0711111980–2024
Source(s): Created by authors
Table 2.

Annual flood peak water levels (m) at Tan Chau and Chau Doc stations, 1978–2024

Tan Chau stationChau Doc station
DatePeak level (m)DatePeak level (m)DatePeak level (m)DatePeak level (m)
09/10/19784.77430/09/20024.80609/10/19784.43701/10/20024.419
22/08/19793.92226/09/20034.02609/10/19793.40930/09/20033.479
29/09/19804.44428/09/20044.38706/10/19803.98730/09/20044.005
24/08/19814.51605/10/20054.33029/08/19813.75221/09/20053.882
13/10/19824.23317/10/20064.15517/10/19823.70523/10/20063.688
22/10/19834.00823/10/20074.05329/10/19833.47524/10/20073.528
13/09/19844.78602/10/20083.73514/09/19844.39002/10/20083.153
29/09/19854.14711/10/20094.08605/10/19853.81712/10/20093.482
22/09/19864.00324/10/20103.10406/10/19863.58528/10/20102.663
11/10/19873.53830/09/20114.79011/10/19873.10112/10/20114.229
25/10/19883.11001/10/20123.15030/10/19882.63603/10/20122.757
21/10/19893.46203/10/20134.26625/10/19893.04409/10/20133.747
10/10/19904.16513/08/20143.81111/10/19903.83315/08/20143.053
13/09/19914.63519/09/20152.29216/09/19914.26917/10/20151.991
03/09/19923.41519/10/20162.89005/10/19922.88318/10/20162.582
20/09/19933.42909/10/20173.27411/10/19933.07809/10/20172.889
04/10/19944.52412/09/20183.98706/10/19944.22011/09/20183.604
20/09/19954.28917/09/20193.52029/09/19953.90625/09/20192.976
05/10/19964.85922/10/20202.65807/10/19964.53822/10/20202.403
05/10/19974.17123/10/20212.56606/10/19973.78623/10/20212.278
26/09/19982.75612/10/20223.50710/10/19982.49013/10/20223.174
08/10/19994.17116/10/20232.88807/10/19993.81917/10/20232.703
23/09/20005.04506/10/20243.17023/09/20004.88606/10/20242.932
20/09/20014.76523/09/20014.472
Source(s): Created by authors
Table 3.

Trends in annual mean water level at selected stations for different stages

Station IDNamePeriodDuration (year)Mann– Kendall taup-valueSen’s slope (mm/year)
I.1Vam Kenh1980–1999200.302<0.00015.5
2000–2024250.411<0.00014.9
1980–2024450.630<0.00016.0
I.4My Thuan1980–1999200.1050.0162.6
2000–202425−0.266<0.0001−6.1
1980–202445−0.116<0.0001−1.3
I.6Tan Chau1980–199920−0.0760.081*−6.2
2000–202425−0.379<0.0001−33.0
1980–202445−0.235<0.0001−10.7
II.1My Thanh1990–2007170.615<0.000113.5
Tran De2008–2024160.537<0.000110.3
II.4Can Tho1980–1999200.371<0.00018.6
2000–2024250.345<0.00017.3
1980–2024450.614<0.00019.3
II.6Chau Doc1980–199920−0.0060.893*−0.3
2000–202425−0.245<0.0001−19.1
1980–202445−0.122<0.0001−4.8
R.Vung Tau1980–1999200.335<0.00015.9
2000–2024250.330<0.00014.3
1980–2024450.456<0.00013.8
Source(s): Created by authors

Supplements

References

Allison
,
M.A.
,
Weathers
,
H.D.
and
Meselhe
,
E.A.
(
2017
), “
Bottom morphology in the Song Hau distributary channel, Mekong River Delta, Vietnam
”,
Continental Shelf Research
, Vol.
147
, pp.
51
-
61
, doi: .
Binh
,
D.V.
,
Kantoush
,
S.A.
,
Sumi
,
T.
,
Mai
,
N.P.
,
Ngoc
,
T.A.
,
Trung
,
L.V.
and
An
,
T.D.
(
2021
), “
Effects of riverbed incision on the hydrology of the Vietnamese Mekong Delta
”,
Hydrological Processes
, Vol.
35
No.
2
, p.
e14030
, doi: .
Brunier
,
G.
,
Anthony
,
E.J.
,
Goichot
,
M.
,
Provansal
,
M.
and
Dussouillez
,
P.
(
2014
), “
Recent morphological changes in the Mekong and Bassac river channels, Mekong delta: the marked impact of river-bed mining and implications for delta destabilisation
”,
Geomorphology
, Vol.
224
, pp.
177
-
191
, doi: .
Caldwell
,
P.C.
(
2014
),
Hourly Sea Level Data Processing and Quality Control Software: updated for 64-Bit Microsoft Operating Systems, SLP64 User Manual, Version 4.0, JIMAR Contribution No. 14-389
,
University of HI Joint Institute for Marine and Atmospheric Research
,
Honolulu, HI
.
Dang
,
T.D.
,
Cochrane
,
T.A.
,
Arias
,
M.E.
and
Tri
,
V.P.D.
(
2018
), “
Future hydrological alterations in the Mekong delta under the impact of water resources development, land subsidence and sea level rise
”,
Journal of Hydrology: Regional Studies
, Vol.
15
, pp.
119
-
133
, doi: .
Defant
,
A.
(
1960
),
Physical Oceanography
,
Pergamon Press
,
Oxford
, Vol.
2
.
Erban
,
L.E.
,
Gorelick
,
S.M.
and
Zebker
,
H.A.
(
2014
), “
Groundwater extraction, land subsidence, and sea-level rise in the Mekong Delta, Vietnam
”,
Environmental Research Letters
, Vol.
9
No.
8
, p.
84010
, doi: .
Eslami
,
S.
,
Hoekstra
,
P.
,
Nguyen Trung
,
N.
,
Ahmed Kantoush
,
S.
,
Van Binh
,
D.
,
Duc Dung
,
D.
,
Tran Quang
,
T.
and
van der Vegt
,
M.
(
2019
), “
Tidal amplification and salt intrusion in the Mekong Delta driven by anthropogenic sediment starvation
”,
Scientific Reports
, Vol.
9
No.
1
, p.
18746
, doi: .
Fujihara
,
Y.
,
Hoshikawa
,
K.
,
Fujii
,
H.
,
Kotera
,
A.
,
Nagano
,
T.
and
Yokoyama
,
S.
(
2016
), “
Analysis and attribution of trends in water levels in the Vietnamese Mekong Delta
”,
Hydrological Processes
, Vol.
30
No.
6
, pp.
835
-
845
, doi: .
Hak
,
D.
,
Nadaoka
,
K.
,
Bernado
,
L.P.
,
Le Phu
,
V.
,
Nguyen
,
H.Q.
,
Tran
,
Q.T.
,
Nguyen
,
H.T.
,
Du
,
V.N.
and
Pham
,
D.T.
(
2016
), “
Spatio-temporal variations of sea level around the Mekong delta: their causes and consequences on the coastal environment
”,
Hydrological Research Letters
, Vol.
10
No.
2
, pp.
60
-
66
, doi: .
Hoang
,
L.P.
,
van Viet
,
M.T.H.
,
Kummu
,
M.
,
Lauri
,
H.
,
Koponen
,
J.
,
Supit
,
I.
,
Leemans
,
R.
,
Kabat
,
P.
and
Ludwig
,
F.
(
2019
), “
The Mekong’s future flows under multiple drivers: how climate change, hydropower developments and irrigation expansions drive hydrological changes
”,
Science of The Total Environment
, Vol.
649
, pp.
601
-
609
, doi: .
IPCC (Intergovernmental Panel on Climate Change)
(
2019
),
IPCC Special Report on the Ocean and Cryosphere in a Changing Climate
, in
Pörtner
,
H.-O.
,
Roberts
,
D.C.
,
Masson-Delmotte
,
V.
,
Zhai
,
P.
,
Tignor
,
M.
,
Poloczanska
,
E.
,
Mintenbeck
,
K.
,
Alegría
,
A.
,
Nicolai
,
M.
,
Okem
,
A.
,
Petzold
,
J.
,
Rama
,
B.
and
Weyer
,
N.M.
(Eds),
Cambridge University Press
,
Cambridge, UK and New York, NY
.
Kondolf
,
G.M.
,
Rubin
,
Z.K.
and
Minear
,
J.T.
(
2014
), “
Dams on the Mekong: cumulative sediment starvation
”,
Water Resources Research
, Vol.
50
No.
6
, pp.
5158
-
5169
, doi: .
Kondolf
,
G.M.
,
Schmitt
,
R.J.P.
,
Carling
,
P.
,
Goichot
,
M.
,
Keskinen
,
M.
,
Arias
,
M.E.
,
Bizzi
,
S.
,
Castelletti
,
A.
,
Cochrane
,
T.A.
,
Darby
,
S.E.
,
Kummu
,
M.
,
Minderhoud
,
P.S.J.
,
Nguyen
,
H.T.
,
Nguyen
,
T.D.
,
Oeurng
,
C.
,
Opperman
,
J.J.
,
Rubin
,
Z.
,
San
,
D.C.
,
Schmeier
,
S.
and
Wild
,
T.B.
(
2022
), “
Save the Mekong Delta from drowning
”,
Science
, Vol.
376
No.
6593
, pp.
583
-
585
, doi: .
Kummu
,
M.
,
Lu
,
X.X.
,
Wang
,
J.J.
and
Varis
,
O.
(
2010
), “
Basin-wide sediment trapping efficiency of emerging reservoirs along the Mekong
”,
Geomorphology
, Vol.
119
Nos
3-4
, pp.
181
-
197
, doi: .
Lee
,
S.K.
and
Dang
,
T.A.
(
2020
), “
Extreme rainfall trends over the Mekong Delta under the impacts of climate change
”,
International Journal of Climate Change Strategies and Management
, Vol.
12
No.
5
, pp.
639
-
652
, doi: .
Lee
,
S.K.
and
Dang
,
T.A.
(
2021
), “
Precipitation variability and trends over the Mekong Delta area of Vietnam
”,
Journal of Agrometeorology
, Vol.
21
No.
2
, pp.
217
-
219
, doi: .
Li
,
D.
,
Long
,
D.
,
Zhao
,
J.
,
Lu
,
H.
and
Hong
,
Y.
(
2017
), “
Observed changes in flow regimes in the Mekong river basin
”,
Journal of Hydrology
, Vol.
551
, pp.
217
-
232
, doi: .
Loc
,
H.H.
,
Van Binh
,
D.
,
Umetsu
,
C.
and
Minh
,
V.Q.
(
2021
), “
Intensifying saline water intrusion and drought in the Mekong Delta: from physical evidence to policy outlooks
”,
Ambio
, Vol.
50
, pp.
645
-
656
, doi: .
Manh
,
N.V.
,
Dung
,
N.V.
,
Hung
,
N.N.
,
Merz
,
B.
and
Apel
,
H.
(
2014
), “
Large-scale suspended sediment transport and sediment deposition in the Mekong Delta
”,
Hydrology and Earth System Sciences
, Vol.
18
No.
8
, pp.
3033
-
3053
, doi: .
Minderhoud
,
P.S.J.
,
Erkens
,
G.
,
Pham
,
V.H.
,
Bui
,
V.T.
,
Erban
,
L.
,
Kooi
,
H.
and
Stouthamer
,
E.
(
2017
), “
Impacts of 25 years of groundwater extraction on subsidence in the Mekong Delta, Vietnam
”,
Environmental Research Letters
, Vol.
12
No.
6
, p.
64006
, doi: .
Nguyen
,
C.T.
,
Schwarzer
,
K.
and
Ricklefs
,
K.
(
2023
), “
Water-level changes and subsidence rates along the Saigon-Dong Nai river estuary and the east sea coastline of the Mekong Delta
”,
Estuarine, Coastal and Shelf Science
, Vol.
283
, p.
108259
, doi: .
Nguyen
,
N.T.
,
Nguyen
,
T.A.
,
Nguyen
,
H.T.
,
Nguyen
,
C.T.
,
Marfai
,
M.A.
and
Dang
,
T.A.
(
2022
), “
Trend analysis of rainfall in the Mekong Delta, Vietnam
”,
Journal of Climate Change Science
, Vol.
6
No.
1
, pp.
1
-
10
.
NOAA (National Oceanic and Atmospheric Administration)
(
2003
), “Computational techniques for tidal datums handbook”,
Special Publication NOS CO-OPS 2
,
National Ocean Service
,
Silver Spring, MD
.
Pugh
,
D.
and
Woodworth
,
P.
(
2014
),
Sea-Level Science: Understanding Tides, Surges, Tsunamis and Mean Sea-Level Changes
,
Cambridge University Press
,
Cambridge
.
Pugh
,
D.T.
(
1987
),
Tides, Surges and Mean Sea-Level
,
John Wiley and Sons
,
Chichester
.
Takagi
,
H.
,
Thao
,
N.D.
,
Anh
,
L.T.
,
Quang
,
N.X.
,
Anh
,
N.L.
and
Anh
,
L.T.
(
2016
), “
Sea-level rise and land subsidence: impacts on flood projections for the Mekong Delta’s largest city
”,
Sustainability
, Vol.
8
No.
9
, p.
959
, doi: .
Thanh
,
N.C.
and
An
,
D.T.
(
2024
), “
Assessing water level variability in the Mekong Delta under the impacts of anthropogenic and climatic factors
”,
Journal of Environmental and Earth Sciences
, Vol.
7
No.
1
, pp.
123
-
131
, doi: .
Codiga
,
D.L.
(
2011
),
Unified Tidal Analysis and Prediction Using the UTide Matlab Functions
,
Technical Report 2011-01
Graduate School of Oceanography, University of RI
,
Narragansett, RI
.
Dunn
,
F.E.
and
Minderhoud
,
P.S.J.
(
2022
), “
Sedimentation strategies provide effective but limited mitigation of relative sea-level rise in the Mekong Delta
”,
Communications Earth and Environment
, Vol.
3
No.
1
, doi: .
Kendall
,
M.G.
(
1975
),
Rank Correlation Methods
, (4th ed) .,
Charles Griffin
,
London
.
Pawlowicz
,
R.
,
Beardsley
,
B.
and
Lentz
,
S.
(
2002
), “
Classical tidal harmonic analysis including error estimates in MATLAB using T_TIDE
”,
Computers and Geosciences
, Vol.
28
No.
8
, pp.
929
-
937
.
Sen
,
P.K.
(
1968
), “
Estimates of the regression coefficient based on Kendall’s Tau
”,
Journal of the American Statistical Association
, Vol.
63
No.
324
, pp.
1379
-
1389
.

Languages

or Create an Account

Close Modal
Close Modal