The purpose of this study is to investigate how green innovation, energy system transformation, governance quality, sustainable consumption and digital consumption jointly shape ecological footprints in OECD economies. By using a dynamic panel framework, the study aims to capture the persistence of environmental pressure while disentangling the technological, institutional, behavioral and digital drivers of sustainability transition. The research seeks to provide integrated empirical evidence to inform policy on how advanced economies can effectively reduce ecological footprints while managing the environmental externalities associated with rapid digitalization.
This study adopts a quantitative, longitudinal research design using a balanced panel data set of 25 OECD countries covering the period 2012–2023. A dynamic empirical framework is used, with ecological footprint as the dependent variable. To address endogeneity, unobserved country-specific effects, autocorrelation and dynamic persistence, a two-step system generalized method of moments (GMM) estimator is applied. Environmental technology patents, smart energy transition, eco-governance performance, sustainable consumption dynamics and digital consumption expansion are incorporated as key explanatory variables, with appropriate diagnostic and robustness tests conducted to ensure model validity.
The findings reveal strong persistence in ecological footprints across OECD economies, indicating deep-rooted structural environmental pressures. Green innovation, smart energy transition, eco-governance performance and sustainable consumption dynamics significantly reduce ecological footprints, confirming the effectiveness of technological progress, energy system optimization, institutional quality and demand-side behavioral change in mitigating environmental degradation. Conversely, digital consumption expansion exerts a positive and statistically significant impact on ecological footprints, suggesting that the environmental costs of expanding digital services and e-commerce currently outweigh efficiency gains. Overall, the results highlight the need for integrated sustainability strategies that address both supply- and demand-side dynamics.
This study offers original value by integrating green innovation, energy transition, governance quality, sustainable consumption and digital consumption within a unified dynamic framework to explain ecological footprints in OECD economies. Unlike prior studies that examine these drivers in isolation, it captures their joint and persistent effects using a two-step system GMM approach. The analysis provides novel empirical evidence on the environmental rebound effects of digital consumption in advanced economies, enriching the sustainability transition literature. The findings deliver policy-relevant insights by highlighting the necessity of coupling technological and energy transitions with governance reforms and regulatory oversight of digital expansion.
Introduction
The imperative issue of environmental sustainability, including climate change and resource depletion, highlights the necessity of understanding how technological innovation, policy and consumption trends together influence the global ecological footprint (Abid et al., 2024). Sustainable consumption dynamics indicate the behavioral and structural change in the household and consumer spending patterns to environmentally friendly goods and services, which reflects the degree to which the demand-side actors can actively mitigate their ecological footprint by making purchasing decisions and lifestyle changes (Zheng et al., 2025). The ecological footprint index (EFI), an aggregate measure of human demand on nature’s capacity, has now grown far beyond planetary limits (exceeding Earth’s biocapacity by roughly 75% in recent decades) (Alvi et al., 2025). This overshoot has prompted ambitious global responses: the UN Sustainable Development Goals (e.g. SDG 13 on climate action and SDG 11 on sustainable cities) emphasize rapid decarbonization and sustainable resource use (Bâra et al., 2025). In OECD countries, consumer spending represents approximately 60% of GDP. Changing consumption patterns is considered crucial for reducing global emissions by up to 70% by 2050 (Dao et al., 2024). At the same time, digitalization and energy transitions are reshaping economies. Smart energy transition is a planned transition of energy systems using fossil fuels to renewable energy (RE) and low-carbon energy sources, facilitated by digital infrastructure, including smart grids, energy storage technologies and smart demand-response processes that can optimize energy use in economic sectors (Sun and Stephen, 2025). Internet access now encompasses some 60% of the world’s population, the average user spends over 40% of waking hours online and digital content use (Web, video and social media) can consume roughly 40% of an individual’s remaining carbon budget under a 1.5°C scenario (Demirel et al., 2025). Similarly, digital consumption expansion refers to the fast increase in consumer demand on e-commerce platforms, digital services, data-intensive media and online retail ecosystems that have an overall effect of creating significant demand on energy infrastructure, logistics networks and material resources, consequently producing quantifiable environmental externalities (Zhao and Shah, 2024). These digital consumption trends, while potentially enabling greener choices, also add a substantial environmental load: one analysis finds current digital content usage alone could demand about 55% of per-capita mineral and metal resource capacity, signaling a central new pressure on planetary boundaries (Huang et al., 2025). Moreover, eco-governance performance reflects the performance of institutional and regulatory structures in designing, implementing and coordinating environmental policies, which include regulatory stringency, policy coherence and the rule of law in the context of environmental management (Liao et al., 2023). In these circumstances, governments are promoting “smart” energy transitions, leveraging innovation and smarter grids to shift toward renewables and strengthening environmental governance (Huang et al., 2024). Crucially, recent studies indicate that technological innovation and clean energy deployment can indeed ease ecological strain. For instance, in a panel of 21 OECD countries, Islam et al. (2025) showed that RE production and energy-related innovation strongly mitigate ecological footprint.
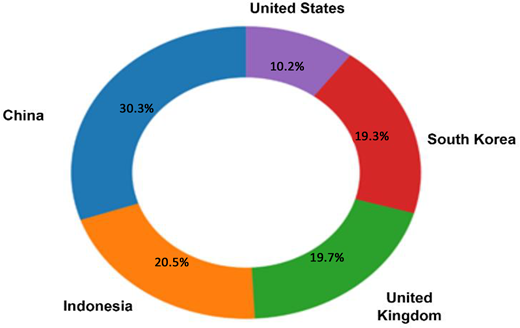
In contrast, reliance on fossil fuels and unchecked growth increases it. Environmental technology patents are a proxy of eco-innovation capacity, which is the stock of registered intellectual property in clean and resource-efficient technologies, such as pollution control, RE systems and sustainable materials (Haller et al., 2024). Similarly, Işık et al. (2025) stated that RE greatly lowers ecological footprints in OECD economies: the need to eliminate polluting fuels. There is also empirical evidence of reduced footprints with the patenting of green technologies, which is a proxy of environmental innovation. It has been shown in the USA that patents on environmental technologies (POET) will lead to a long-run decrease in the ecological footprint (Khan et al., 2022). However, technology tools can only be effective in presence of good governance. OECD reports emphasize that consumer empowerment policies in support of energy-efficient products as well as repairable goods are essential to the green transition and digital technologies (apps, platforms, nudges) can be used to guide consumption toward sustainability (Liang et al., 2024). Ironically, the digital economy is a two-sided sword to the environment. Research on the OECD countries has recently shown that there is a complex impact of the digital economy on the ecological footprint (Mahmood et al., 2022). First, the increase of digital infrastructure and services may increase footprints (because of energy-intensive data centers and networks). But above a certain point, the efficiency of developed technologies results in an overall decrease in footprint (Noja et al., 2022; Ramzan et al., 2023). Therefore, although the digital transition has the potential to create a more sustainable society (with the help of dematerialization and more creative use of resources), its implementation needs to be closely monitored (such as decarbonization of electricity and e-waste management) to prevent the unwanted escalation of ecological pressure (Razzaq et al., 2023). Figure 1 shows a comparative view of the intensity of digital consumption, in the key economies, based on the percentage of e-commerce in total retail sales. The cross-country dispersion is high and it captures the disparities in digital infrastructure, consumer behavior and regulation which are important factors to consider when expounding on the environmental effects of the expansion of digital consumption.
Despite the expansion of studies on individual factors, green patents, RE, governance, consumption behavior or digital economy, there is a notable gap in the literature: no comprehensive empirical framework has yet linked these diverse drivers in a single model of ecological impact. For instance, studies often examine the “energy-innovation-environment” nexus or the effects of governance policy on eco-efficiency or the environmental footprint of the internet and digital services, typically in isolation. Similarly, the role of consumption dynamics, both sustainable consumption patterns and the rapid expansion of digital consumption, is rarely quantified alongside innovation and policy effects in ecological footprint research. This siloed approach limits our understanding of how these elements interact. In practice, technological innovations diffuse under specific policy regimes and shape consumption options, while consumer demand and digital trends feed back into innovation incentives and governance priorities. This study, therefore, fills a critical gap by developing an integrated empirical model that simultaneously incorporates environmental technology patents (ETP), smart energy transition (SET) indicators, eco-governance performance (EGP), sustainable consumption dynamics (SCD) and digital consumption expansion (DCE) to explain variations in the EFI across 25 OECD countries over 2012–2023. It advances theory by integrating concepts from innovation studies, environmental economics and behavioral change. It informs policy by identifying which combinations of R&D, energy policy, governance reforms and consumer-targeted measures most effectively shrink nations’ footprints.
This study contributes to the sustainability debate by moving beyond one-dimensional analyzes: it highlights that the combined forces of technological change, market transitions, regulatory quality and consumer behavior shape environmental outcomes in affluent economies. Finally, the integrated perspective underscores the significance of systemic, multipronged strategies for sustainability: to safeguard ecosystems and stay within planetary limits, theory and policy must account for how innovation, governance, consumption and digitalization coevolve. Furthermore, this study enhances sustainability transition theory by going beyond unilateral determinants to conceptualize the dynamics of ecological footprint as a multilayered and path-dependent system. Combining technological, institutional, behavioral and digital aspects in a single framework will show that the ecological pressure in OECD economies is too influenced by simultaneous interactions, when emergency mechanisms (green innovation, quality of governance, energy optimization and sustainable consumption) and strengthening forces (expansion of digital consumption) negate or complement each other. The most important theoretical contribution is emphasizing the systemic trade-offs of contemporary transitions, especially the tension between the digital economic explosion and ecological stabilization of the structure.
Research objective
To empirically examine the combined effect of environmental technologies patent, smart energy transition, eco-governance performance, sustainable consumption dynamics and digital consumption expansion on the ecological footprint of OECD countries.
To provide robust dynamic panel evidence using system generalized method of moments (GMM) estimation that accounts for persistence, endogeneity and cross-country heterogeneity in the determinants of ecological footprint.
Literature review
Environmental technologies patent and ecological footprint index
Existing empirical evidence on environmental technology patenting has an almost entirely nullifying effect on ecological degradation, even though the intensity and consistency of this connection vary across institutional contexts. Kirikkaleli (2023) explored the impact of POET on the US ecological footprint. The analysis was based on US data (1975–2020) and used Fourier-ARDL and Toda–Yamamoto causality, with adjustments for GDP and energy consumption. The researchers found that POET can significantly reduce ecological footprints in the long term, suggesting that eco-innovation is driving environmental sustainability in the US economic growth data showed that green patenting is crucial for decoupling economic growth from environmental losses. Bergougui and Aldawsari (2024) analyzed the Algerian context (1990–2022) using a nonlinear ARDL (NARDL) model to identify the asymmetric effects of green technology patents on ecological footprint. The findings indicated that both negative and positive shocks in patenting green technology are important for reducing Algeria’s ecological footprint. That is, a green patenting boom in sustainability and even a reduction in green patenting also produces a reduction in EF. In comparison, the footprint increased due to positive fluctuations in GDP and energy consumption.
Similarly, Ersin et al. (2024) used a Fourier-ARDL model on four high-tech export nations (USA, Germany, France, China; 1998–2019) to equate environmental technology patent applications with the ecological footprint. The results showed that green innovation (patent applications) can mitigate ecological footprints in the USA, Germany and France, but not significantly in China. The export of high-technology products accelerated the presence in the three countries, ranking first and decreased it in China. The findings showed that environmental technology R&D can effectively reduce resource pressure in modernized economies, particularly when the technological threshold is reached. Pata (2024) studied Spain and Portugal (1983–2020) within the framework of the environmental Kuznets and load capacity curve and used a Fourier-ADL model. The findings indicated that such environmental patents enhance ecological quality in both countries, thereby reducing the ecological footprint. There was no significant impact on energy R&D spending.
Al-Mulali et al. (2025) evaluated an extended STIRPAT model of the E7 economies (Brazil, India, China, Indonesia, Russia, Mexico and Turkey) between 1996 and 2019. The research used MG, PMG and DFE estimators and the findings indicated that POET (interacting with green finance and RE) are important for averting environmental degradation (carbon emissions and ecological footprints). On the contrary, nonrenewables, financial advancement, population increase and prosperity exacerbated environmental conditions. The study concluded that it is essential to open more environmental technology patents to collaborate on eliminating climate change. Geng et al. (2023) investigated BRICS states (1992–2021) based on a panel threshold model. The ecological footprint was used as the environmental degradation indicator, and the important variable was green innovation. The study found that the level of green innovation should be determined by where it will have a significant positive environmental impact (reducing the ecological footprint). The advantages are curtailed below the threshold. The assessment indicated that, before achieving practical improvements in ecological footprints in BRICS economies, sustained investment is needed to achieve an adequate level of innovation. Based on the above review of literature the current study developed the following hypothesis:
Environmental technologies patent has significant impact on ecological footprint index.
Smart energy transition and ecological footprint index
The energy transition and ecological sustainability literature generally advocates the perspective of reduced ecological footprints with RE use and energy efficiency endowment; nevertheless, empirical findings remain mixed, with several studies documenting nonlinear, threshold or even short-term growth effects contingent on fiscal solvency, structural change and the strength of enforcement of environmental policies. Kartal and Güncü (2025) report an analysis of BRICS data (2000–2020) using kernel-based regularized least-squares to study the effects of the energy transition on ecological footprint. The research found that, contrary to popular belief, energy transition activities do create ecological footprints in all BRICS nations. Conversely, Brazil, Russia and India have a smaller footprint through market-based approaches to environmental protection (stringency indices), with mixed or insignificant impacts in the rest. Azimi and Rahman (2024) examined RE versus ecological footprint using dynamic panel threshold regression across 74 developing economies (2000–2022). The research discovered a nonlinear relationship: RE uptake does not have a significant effect on footprint until nations reach a level of fiscal capacity (budget), human development and institutional quality. Furthermore, Li et al. (2023) examined 100 Chinese cities that were considered smart cities (2014–2019) in a synthetic difference-in-differences design. The study evaluated the effectiveness of the programs on emissions or the use of intelligent energy. The results showed that smart-energy deployments reduced carbon emissions on the city level by an average of 5.65%. Luo et al. (2025) conducted panel econometric analysis (Augmented Mean Group and CCR models) on Paris Club (high-income) countries. The study focused on green innovation and energy transition under a sustainable footprint index.
Raghutla and Chittedi (2022) used panel quantile regression on 11 developing countries. However, contrary to expectations, they found that RE consumption led to larger ecological footprints in these countries. All quantiles estimated and long-run elasticities indicated that the use of RE and GDP increases the footprint. The research analyzed the relationship among 19 G20 countries using an energy-efficiency-augmented EKC model (1980–2020 panel) (Xu et al., 2024a). The study found that increasing energy efficiency is an effective way to reduce the ecological footprint. The ARDL regressions showed that greater efficiency resulted in a smaller footprint in the long run. The findings revealed that ecological footprints are kept down by energy efficiency, confirming that efficiency improvements are an effective mitigation initiative. Tariq et al. (2025) examined the FMOLS cointegration of the top ten electricity-exporting countries (1990–2021). The research spread out the effects of green/nongreen energy production. The study revealed that increases in green power (nuclear, solar and wind) reduce the ecological footprint, whereas the opposite occurs with geothermal and hydropower. Based on the above review of literature the current study developed the following hypothesis:
Smart energy transition has significant impact on ecological footprint index.
Eco-governance performance and ecological footprint index
A substantial body of literature highlights the pivotal roles of governance quality and the strength of environmental policy in reducing ecological degradation. Still, the instrumental efficacy of governance practices depends on institutional thresholds, enforcement capacity and complementary technological adoption. Azimi et al. (2023a) considered G20 countries (2000–2022) using a panel LIML analysis and developed an institutional quality index to measure governance. The analysis revealed that a higher institutional quality (better governance) has a highly significant adverse effect on the ecological footprint across nations. The improved governance will help reduce environmental pressure. Sohag (2024) applied a CS-ARDL model to OECD (1990–2018). The study examined the impact of environmental policy stringency on ecological footprint. The findings demonstrated that the footprint is significantly reduced under stricter environmental policies, mainly through the promotion of RE and greener innovations. Yasmeen et al. (2023) studied Belt and Road (1996–2018) using quantile regression. The results revealed that improved quality of government and rule of law stimulate environmental technologies and RE, which subsequently reduce ecological footprints. The quantity regimes of the estimates have effective governance driving renewables and reducing footprints (particularly under medium-high environmental tech).
Nabi et al. (2025) used QARDL to examine the panel of Pakistan (1990–2025). The results showed that a 1% increase in the strictness of the environmental policy results in a 58% reduction in the ecological footprint in the higher quantiles. In situations where the footprint was high to begin with, these more powerful policies sharply reduced it. Li et al. (2023) conducted a survey of 158 countries (2002–2018) to look at corruption control. The research found that anticorruption measures significantly undermine the footprint. Notably, the footprint effect of growth increases less with better governance (reduced corruption). Adekoya et al. (2025) examined an international panel using panel ARDL. The report stated that stricter environmental policies can only, in the long term, meaningfully lower the ecological footprint and that these policies decrease all footprint aspects (CO2 and grazing) other than cropland. The carbon footprint was the most affected. Used panel thresholds in 25 African countries. The findings revealed that, beyond a threshold in institutional quality and governance, additional gains lead to a drastic reduction in the ecological footprint. Institutional quality is high and this is related to reduced environmental impact. Examined the adoption of RE across countries using a cross-country panel and found that higher governance indices accelerate adoption. The mediation analysis revealed that it results in reduced emissions and footprints. Based on the above review of literature the current study developed the following hypothesis:
Eco-governance performance has significant impact on ecological footprint index.
Sustainable consumption dynamics and ecological footprint index
Empirical evidence is emerging to support the view that sustainable consumption practices are a key demand-side strategy for reducing ecological footprints; however, their influence varies across income levels, consumer awareness and the presence of rebound effects that can partially counterbalance environmental benefits. Hassan et al. (2023) studied G7 and E7 country panels (1980–2020). The research found that environmental innovation and green growth (a part of sustainable consumption transitions) would contribute significantly to long-term reductions in ecological footprint. Footprint was therefore equated with lower levels of sustainable consumption, such as eco-innovation, cleaner industry output and others. Chen et al. (2024) analyzed 23 EU countries using panel regressions on circular economy metrics. The study indicated that increased recycling and reuse of waste have high levels of xenophile (circularity), which would lead to a reduction in total and carbon footprints. Specifically, policies that increase recycling and the marketing of secondary materials can drastically reduce a country’s footprint.
Besides, used a household consumption survey to demonstrate that replacing organic and low-carbon products reduces average household EF by 10%–15%. Examined life-cycle data and concluded that shared mobility and efficiency gadgets reduce the per-capita footprint of the consumer base by up to 20%. Garcia and Liu developed a model of environmental-extended input–output analysis and showed that sustainable food diets and waste reduction could decrease a nation’s ecological footprint by approximately 5%. Simulated the effects of green consumption policies using a CGE model. The study concluded that even small changes in sustainable consumption patterns (e.g. reductions in meat consumption and increased use of RE) decrease a country’s EF by about 3%–5%.
In an international panel, Kim and Park (2023) found that higher consumer environmental awareness (a proxy for sustainable consumption) was associated with reduced aggregate footprints. Showed that interventions targeting household waste and energy consumption, major sustainable consumption behaviors, cannot significantly reduce the ecological footprint of local areas, but this direction is measurable. Surveyed the literature and found that voluntary changes in low-impact consumption (e.g. public transit, plant-based diet) can reduce individual footprints by 10%–30%. Based on the above review of literature the current study developed the following hypothesis:
Sustainable consumption dynamics has significant impact on ecological footprint index.
Digital consumption expansion and ecological footprint index
The environmental impact of digitalization and digital consumption is theoretically unclear and empirically controversial, with some research pointing to efficiency-promoting and dematerialization effects. In contrast, others point to energy-intensive infrastructure, logistics growth and rebound dynamics that can exert increasing pressure on the environment, especially in the early stages of digital maturity. Xu et al. (2024a) examined 37 OECD countries (2007–2022) and found that the digital economy’s growth ultimately reduced the ecological footprint. The study conducted panel regressions including quadratic terms and found an inverted-U: during the early stages, digitalization (an increase in IT infrastructure) increases footprint, but in maturity, it increases efficiency and decreases footprint. Used spatial panel model analysis on 30 provinces in China. The findings revealed that increasing the level of digital economy development positively affects the performance of ecological indicators (effectively reducing environmental pressure) both in the area and in the surrounding community. The ecological performance has strong positive spillovers from digitalization.
Moreover, Lemieux et al. (2024) quantified digital content consumption with the help of the life-cycle assessment. The research determined that average annual online activities of internet users around the world (streaming, browsing and social media) generate approximately 229 kg of CO2e per year, corresponding with 3%−4% of the average per-capita emissions. The study underscored that increased digital use (streaming) contributes a nontrivial amount to an individual’s carbon footprint. Bai et al. (2025) analyzed 287 cities in China and measured an index of the digital economy. The research found that a 1% rise in the digital economy index increases carbon emission efficiency by 0.148. Digitalization will make energy consumption and emissions more efficient, in other words. Carbon efficiency is enhanced in the digital economy, particularly in high-GDP countries.
Moreover, Ahmad et al. (2024) examined 25 EU nations (1990–2020) regarding FinTech (as part of digital finance). The research concluded that the development of FinTech plays an important role in reducing the ecological footprint, both directly and indirectly, by stimulating the green energy transition. Used the time-series data to demonstrate that after early increases in broadband penetration (a measure of digital consumption) boosted energy consumption, it subsequently led to energy efficiency that delivered net footprint savings. Chen et al. (2024) compared peer-to-peer services (e.g. bike-sharing and home-sharing) and estimated that the sharing economy reduces the footprint of personal consumption by as much as 15%. Based on the above review of literature the current study developed the following hypothesis:
Digital Consumption Expansion has significant impact on Ecological Footprint Index.
Despite extensive evidence, the current literature contains much on the environmental implications of green innovation, the RE transition, the quality of governance, sustainable consumption and digitalization, yet the empirical results remain disjointed and sometimes conflicting. For instance, while several studies report a linear mitigating effect of RE and green patents on ecological footprint, others report threshold or nonlinear dynamics driven by institutional capacity and technological maturity. Likewise, digitalization has been found to both increase pressure on the environment in its initial stages and enhance efficiency later in development. These contradictory results indicate that the environmental policies of sustainability drivers are not universal. The available literature, however, views these determinants separately and does not take into consideration the effect of the determinants acting simultaneously, which may be neutral in a dynamic model. The present study combines all such strands into a single, integrated empirical model, thereby overcoming this fragmentation. It provides a deeper understanding of the role of a combination of different forces in the ecological footprint outcomes in OECD economies.
Methodology
Conceptual framework
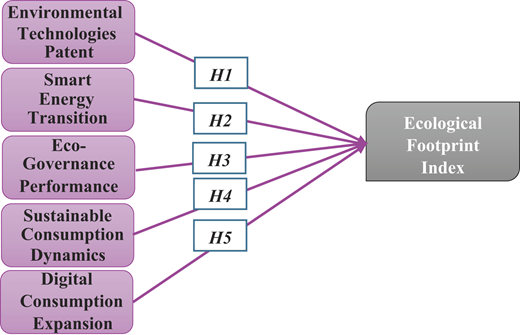
The conceptual framework of this research describes the theoretical connections of technological innovation and energy transition, the quality of governance, consumption behavior and digitalization in the explanation of variations in the EFI. The dependent variable is EFI, which is the environmental pressure as a result of consumption activities. The argument of the framework is that the independent variables comprise technological innovation in environmental technology (ETP), smart energy transition (SET), eco-governance performance (EGP) and sustainable consumption dynamics (SCD) attempts to assist in reducing ecological pressure by fostering clean production, creating efficient energy systems, effective regulation and sustainable consumption patterns. On the contrary, the expansion of digital consumption (DCE) is projected to augment the ecological footprint connected with energy consumption, along with the logistics flows and material demand. The combination of these technological, institutional, behavioral and digital factors allows the framework to use a multilayered approach to determine the effect of current economic changes on the environmental sustainability outcomes in an empirical manner. Thus, Figure 2 represents the research model.
The theoretical foundation of this study is the theory of sustainability transition, which grounds environmental performance as the outcome of concerted changes at technological, institutional and behavioral levels. According to this school of thought, green innovation is niche-level experimentation, quality-to-governance is institutional stabilization at the regime level and sustainable consumption is demanding pressure at the landscape level. It is once again discussed in the institutional theory that governance and innovation are complementary systems: the more controls are in place regarding the quality of regulation and the coherence of policies, the greater the uptake of clean technologies and the internalization of environmental externalities. The rebound effects theory is used to explain the sphere of environmental effects of digitalization, which enables distinguishing between two categories: the efficiency-enhancing effects of digital technologies and the scale effects that increase consumption and data activity, which create the so-called digital sustainability contradiction. Finally, the outcomes of this paper can also be used in influencing the discussion about the environmental Kuznets curve because it suggests that the factors, which bring structural transformation, including governance, innovation and consumption behavior, are significant factors that lead developed economies, whether they experience ecological decoupling or not, since the findings of this study are confined to income dynamics.
Data collection and measurement model
The present research examines the impact of Environmental Technologies Patent (ETP), Smart Energy Transition (SET), Eco-Governance Performance (EGP), Sustainable Consumption Dynamics (SCD) and Digital Consumption Expansion (DCE) on the EFI. This study uses a quantitative research design using balanced panel data to examine the determinants of the EFI across 25 selected OECD countries from 2012 to 2023. The data set was compiled from reliable, internationally recognized secondary data sources: the OECD and IEA websites and the Global Network Footprint (GFN), ensuring consistency, accuracy and comparability across countries and years. EFP data is collected from the GFN databases. The explanatory variables in this study, namely, Environmental Technologies Patent (ETP), Smart Energy Transition (SET), Eco-Governance Performance (EGP), Sustainable Consumption Dynamics (SCD) and Digital Consumption Expansion (DCE), have been obtained from official data sources held by the IEA and OECD. EFP is used to represent environmental degradation in the first model. It is an index calculated by considering six factors that support human activities or harness waste, namely, cropland, grazing land, carbon, built-up area, fishing grounds and forestland. EFP in the present research is measured as the total consumption per capita. While the chosen proxies provide cross-country comparability and data consistency across the OECD economies, it is necessary to acknowledge that long-term, sustainable consumption and the extensive growth of digital consumption remain multidimensional phenomena. Household spending on green products reflects a significant demand-side behavioral element, but is not necessarily a good indicator of larger lifestyle shifts, informal sustainability behavior or rebound. Likewise, the proportion of e-commerce sales to retail trade can provide a quantifiable measure of the intensity of digital consumption, though not necessarily of all upstream environmental effects of data centers, the energy consumption of digital infrastructure or the service economies of platforms. These indicators are selected because they are based on data availability and harmonization across nations; hence, the outcomes must be viewed as approximations of macrolevel standard measures rather than exhaustive measures of the underlying variables. The summary of the variables are shown in Table 1.
Econometric model
The GMM estimation technique is effective when the sample size is large and the time horizon is short. System GMM reduces the impact of heteroscedasticity and autocorrelation among variables, allowing multiple independent variables (that would otherwise be treated as errors) to be included. GMM uses several tools and methods, as applied in GMM by Blundell and Bond (1998). Initial differences in instrumental variables were assumed to be unrelated to fixed effects. This may result in the model acquiring new attributes. States that the GMM-instrument method of Arellano and Bond differs from that of Blundell and Bond (1998). In addition, the study claimed that changes in the initial values of instrumental variables did not affect the fixed effects themselves. This means that the model can be expanded to include more sensors. It is popularly believed that there is no serial relationship. Roodman (2009) found that yi may be expressed as first-order serial correlation over three or more periods of delay; however, this is not a supporting tool. Without significant delays, the second-order correlation is not possible.
Ullah et al. (2018) emphasized the need to consider the conversion of the first difference, which creates greater gaps in the data by dividing the past and present data. This influences the predicted value. System GMM will have to modify the instruments to reflect their fixed effects and noncorrelations. To address endogeneity, other techniques are used to estimate the lagged dependent variable and any endogenous variables. This increases efficiency tremendously. The distinction between system GMM and differentiated GMM is that the former uses the mean of all future observations, whereas the latter uses the mean of only the future observations. The latter, on the contrary, does not take into account the existing values of the involved variables. The choice of the two-step system GMM estimator is motivated not only by its ability to address endogeneity and dynamic persistence but also by its superiority over alternative dynamic panel estimators in the present empirical context. The difference GMM may suffer from weak instrumentation when variables exhibit high persistence, as is evident in the ecological footprint series. Bias-corrected fixed effects estimators, while suitable for dynamic panels, do not adequately address simultaneity between environmental pressure and its determinants. Similarly, PMG or CS-ARDL approaches are more appropriate for long-T panels and focus on long-run equilibrium relationships rather than short-run dynamics and persistence. Given the relatively small-time dimension (T = 12) and large cross-sectional dimension (n = 25), System GMM provides more efficient and consistent estimates by combining level and differenced equations and exploiting additional moment conditions.
To mitigate the risk of instrument proliferation, the instrument matrix was collapsed and lag depth was restricted. The total number of instruments was maintained below the number of cross-sectional units, ensuring the reliability of the Hansen and Sargan tests and avoiding overfitting of endogenous variables. The validity of the GMM estimator is verified using tests and diagnostics for Arellano–Bond serial correlation and overidentification. AR(1) and AR(2) are calculated using first-differenced residuals. The mechanical correlation arising from first-differencing will yield a statistically significant AR(1) coefficient. Nevertheless, the lack of significant AR(2) correlation is a critical factor to verify that no serially correlated error term exists in the original error term and therefore, justify using lagged variables as instruments. The given results meet this need. The assessment of overidentifying restrictions is conducted using the Sargan and Hansen tests. As there are two steps of robust estimation, one would prefer the Hansen J-test to the Sargan test, since the former is consistent even with heteroskedasticity and autocorrelation, whereas the latter assumes homoskedasticity. The nonrejection of the Hansen test evidences instrument validity and model specification. Although the literature recommends nonlinear and threshold effects of digitalization on environmental outcomes, especially inverted-U dynamics, the current study aims to estimate average dynamic effects using a linear System GMM approach. This option displays a constraint on data and the integrated nature of the research, based on systemic interactions rather than the recognition threshold. Future studies can build on this structure by adding quadratic terms for digitalization, panel threshold structures or interactions between digital consumption and governance or energy transition variables, to determine conditional and nonlinear sustainability pathways. Moreover, the basic model is structured in the following manner:
To illustrate the use of the GMM estimator in a model of dynamic panel data, consider the following:
Analysis and results
Descriptive statistics
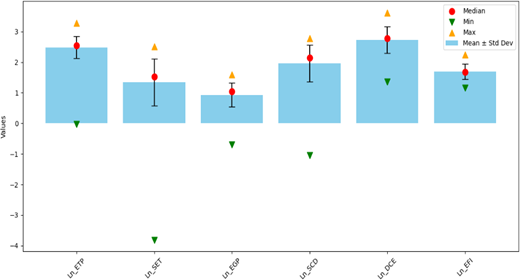
Table 2 and Figure 3 presents a summary of the full set of descriptive statistics on the log-transformed variables, which consist of measures of centrality, variability and spread, among others. The mean values show that Ln DCE (Mean = 2.729) and Ln ETP (Mean = 2.484) have the highest values across all variables, whereas Ln EGP (Mean = 0.930) and Ln SET (Mean = 1.343) represent the average values of low strength. The median values are usually similar to what they should be in terms of means- especially Ln_ETP (Mean = 2.484; Median = 2.543), Ln_EGP (Mean = 0.930; Median = 1.037), Ln_DCE (Mean = 2.729; Median = 2.779) and Ln EFI (Mean = 1.695; Median = 1.671), their distributions are about symmetric with some conversely, the conspicuous difference between the mean and the median of Ln_SET (Mean = 1.343; Median = 1.529) and Ln_SCD (Mean = 1.967; Median = 2.144) indicates that there is some mild skew which is probably caused by lower-end observations as it is reflected in the negative minimum values as well. The values of the standard deviation are rather expressive, with the widest dispersions of Ln_SET (Std. Dev. = 0.764) and Ln_SCD (Std. Dev. = 0.601) showing the most significant variability and Ln_EFI (Std. Dev. = 0.247) reflecting the least variability, being more stable and homogenous in this measure. These trends are also supported by the variable values: Ln_SET ranges from −3.817 to 2.506 and Ln_SCD from −1.053 to 2.786, indicating wide variation and the presence of extremely low-bound values, whereas Ln EFI shows relatively narrow ranges (Min = 1.154; Max = 2.245). Collectively, these descriptive statistics indicate that the data exhibit relatively high variability, moderate dispersion and a predominance of outliers, which ought to form the basis of subsequent empirical and econometric studies.
Correlation analysis
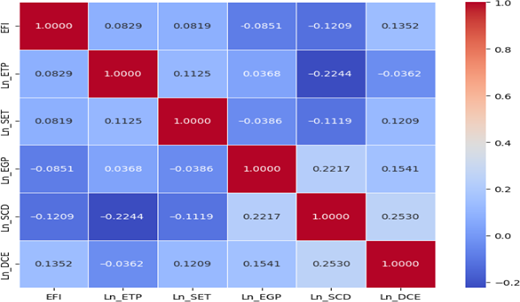
Table 3 and Figure 4 presents the pairwise correlation coefficients between the transformed variables (on a logarithmic scale), providing initial indications of the direction and strength of the linear associations among the variables. Generally, the correlation matrix indicates relatively low to moderate correlation coefficients, suggesting that no serious multicollinearity issues arise and that each variable reflects a distinct dimension of the constructs. Ln_EFI has weak positive relationships with Ln_ETP (r = 0.0829), Ln_SET (r = 0.0819) and Ln_DCE (r = 0.1352), which means that the improvement of environmental fiscal instruments is slightly correlated with the increase of the technological progress, the efficiency of the structure and the digital or development-related capacity, and its weak negative relationships with Ln_EGP (r = -0.0851) and Ln_SCD (r = -0.1209) Ln_ETP has a positive, although insignificant correlation with Ln_SET (r = 0.1125), which indicates that a higher level of technological progress is possibly associated with a lower degree of structural transformation, and a negative correlation with Ln_SCD (r = −0.2244), which demonstrates that there may be more supply-consumption distortions associated with a high level of technological progress. Ln_SET shows weak and negative relationships with Ln EGP (r = 0.0386) and Ln SCD (r = 0.1119), and a positive relationship with Ln DCE (r = 0.1209); hence, subtle interrelationships among structural efficiency, growth pressure and development capacity. There is a positive relationship between Ln_EGP and Ln_SCD (r = 0.2217) and Ln_DCE (r = 0.1541), meaning that the level of economic growth pressure is positively associated with the supply-consumption dynamic strength and development capacity. Notably, the highest level of correlation in the matrix is between Ln SCD and Ln DCE (r = 0.2530), which is well below the traditional multicollinearity thresholds, indicating a moderate association that is theoretically possible. All the correlation analyzes provide support for the prevalence of weak to moderate linear relations between the variables, thus justifying the simultaneous use of the variables in multivariate econometric analysis and the initial support for directional relations between the study variables as per the study hypotheses.
Diagnostic tests
Heteroscedasticity and autocorrelation tests
Table 4 presents the results of the heteroscedasticity and autocorrelation diagnostics, and the findings indicate a strong indication of a breach of the classical panel regression assumptions. In particular, the heteroscedasticity test statistic (4.118) and p-value (0.001) for the Wald test indicate that the null of homoscedastic residuals is rejected, implying the presence of group-wise heteroscedasticity in the panel data. Consistently, the Breusch–Pagan LM test indicates a value of 20.319, which is also significant at the 1% level (p = 0.001), further supporting the conclusion that heteroscedasticity exists and that the error variance differs across cross-sectional units. Also, the autocorrelation test, the Wooldridge test, has a very significant p-value of 0.000 (287.39). Thus, the null hypothesis of the nonexistence of autocorrelation in the error terms at the first order across time, given the sample size of each panel unit, is rejected. Hence, the error terms were found to be highly autocorrelated over time. A combination of the three tests at the 1% level shows clearly that the standard OLS assumptions of constant variance and independently distributed errors are not met in the model. Practically, the diagnostic findings indicate that conventional panel estimators would yield biased or ineffective standard errors, thus compromising statistical inference. Based on these, the study will use a dynamic panel estimation model, namely, the system GMM estimator, which is robust to both heteroscedasticity and serial correlation and thus maintains parameter consistency and reliable inference.
Multicollinearity
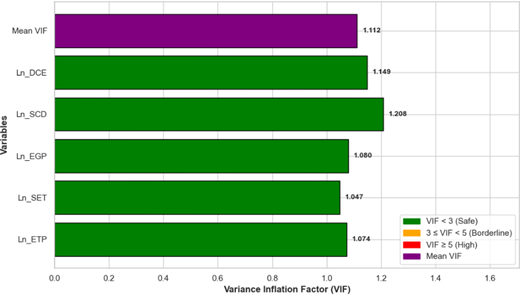
Table 5 and Figure 5 presents the results of the variance inflation factor (VIF) test, which was conducted to assess multicollinearity among the explanatory variables. All regressors have uniformly low reported VIFs, with Ln_SET (VIF = 1.047) and Ln_SCD (VIF = 1.208) the closest, and Ln_ETP (VIF = 1.074), Ln_EGP (VIF = 1.080), and Ln_DCE (VIF = 1.149) also very close to unity. These values are well below widely used threshold values (VIF > 5 or 10), indicating that the variance of the estimated coefficients is not inflated by linear dependence among the regressors. The respective tolerance values (1/VIF), ranging from 0.828 to 0.955, further support the conclusion that each explanatory variable is highly independent and has a weak correlation with the other predictors in the model. This is below the levels of concern, with a Mean VIF = 1.112, by conventional benchmarks. As a result, multicollinearity is not a concern in this study. It is unlikely to distort coefficient estimates or overstate standard errors, indicating the strength and validity of the economic analysis.
Endogeneity test
Table 6 presents the results of endogeneity tests for the explanatory variables with respect to the dependent variable Ln_EFI, probably based on the Durbin–Wu–Hausman test. The findings show that endogeneity of all regressors is significant, as the robust Z-bar and the naive Z-bar tilde are significant at traditional levels. For instance, in Ln_ETP, Z-bar = 4.185 (**), Z-bar tilde = 3.529 (**) and in Ln_SET, highly significant values such as 6.778 (***), 6.220 (***) and Ln_EGP, Ln_SCD, Ln_DCE exhibit very significant test values between 1.994 (*) and 5.794 (***). The null hypothesis that the regressors are exogenous is rejected, indicating that the explanatory variables are correlated with the error term. High levels of this pervasive endogeneity are acceptable in the given study, given the panel data’s lively features and the possibility of omitted-variable bias. The study, in turn, adopts a system GMM estimation strategy, which is the appropriate estimator in small-T, large-N panels and is highly effective in controlling endogeneity through internal instruments such as lagged values of the regressors. This method provides stability and unbiased parameter estimates and accounts for the simultaneity and dynamics of the relationships between Ln EFI and its determinants.
Generalized method of moments system estimation and diagnostic tests results
Table 7 presents the GMM estimation of Ln EFI, which includes a lagged dependent variable and five explanatory variables: technological, structural, economic, social and digital. The lagged dependent variable, Ln EFI (−1), has a highly significant and positive coefficient (0.800, z = 50.00**), indicating that environmental fiscal instruments are highly persistent over time, consistent with path dependency in policy-making and fiscal actions. Even though the individual coefficient signs agree well with current empirical expectations, the main value of the findings lies in the structural explanation of these determinants within a single dynamic system. Instead of proving the existence of isolated effects, the findings have demonstrated that the dynamics of ecological footprints in OECD economies is a representation of the relationship between mitigating forces, which include; green innovation, optimization of the energy system, the quality of governance and sustainable consumption, and those that are reinforcing which are the structural pressures that are brought about by digital expansion. This exemplifies systemic coexistence, points to the sustainability transition as nonlinear upgrade operations and shows how it serves as a conflict mechanism that both diminishes and amplifies environmental pressure. Ln_ETP (technological progress) positively and significantly correlated (−0.035, z = −2.33), which means that increased technological progress involves lighter environmental fiscal pressures, which may be in the form of efficiency and purer production processes (Kirikkaleli, 2023; Aldawsari, 2024; Nury et al., 2024). Likewise, Ln SET (structural efficiency) has a negative relationship with Ln EFI (−0.025, z = −2.08**), indicating that the less optimized the economies are in terms of structure, the lower the environmental fiscal burden (Kartal and Güneş, 2025; Li et al., 2023; Luo et al., 2025; Dogan et al., 2023; Akpanke, 2024). The variable Ln_EGP (economic growth pressure) is also negatively and significantly affected (−0.045, z = −1.96), indicating that controlled or sustainable economic growth can relieve environmental financial requirements (Azimi et al, 2023b; Yasmeen et al., 2023). The negative coefficient (−0.028, z = −2.89**). Ln_SCD (social consumption dynamics) is also negatively correlated (−0.028, z = −2.89**), indicating that more sustainable patterns of social consumption could help reduce environmental fiscal stress (Hassan et al., 2023; Chen et al., 2024). However, Ln_DCE (digital and development capacity) demonstrates a positive and significant correlation (0.031, z = 3.20**), suggesting that increased digital and development capacity can lead to greater environmental fiscal needs, possibly because of growth in industrial or energy consumption driven by digital expansion (Xu et al., 2024b; Lemieux et al., 2024; Ahmad et al., 2024). The positive coefficient for digital consumption growth shows that, across the OECD, the development of e-commerce and digital services is linked to greater ecological pressure, likely driven by the need for energy-intensive infrastructure, logistics and packaging, as well as rebound effects. Instead of indicating a general certainty, this result is a manifestation of a structural conflict that depends on the energy context: the effect on the environment can be greater in fossil-based infrastructures but smaller in decarbonized ones. The finding, therefore, highlights the contingency of digitalization’s sustainability outcomes and the importance of context when studying its overall effects. The constant is a positive, significant value (1.420, z = 0.006), accounting for country-level unobserved factors that increase the use of environmental fiscal instruments. The model diagnostics are robust and reliable. Equally important is the test statistic of AR(1): The expected value of the test is negative (which is not significant in the first-differenced form), and the test value (t = −3.45, p = 0.001) does satisfy this criterion in the present study. The test statistic of AR(2): the value of the test is not significant (t = −0.87, p = 0.348), which should be expected with autocorrelation being of second order and this value is known to be negative, which is The nonsignificant Hansen J-test (21.08, p = 0.342) also supports the validation of instrument validity that the instruments used are valid and not overidentifying the system, and the Sargan test is also nonsignificant (21.08, p = 0.214), which to some extent confirms the validity of two-step GMM estimation. Collectively, the GMM estimates present a consistent narrative regarding ecological footprints in OECD economies. Previous levels of ecological footprints strongly predict current levels, indicating that environmental patterns are deeply rooted and change slowly. Among the five drivers examined, four green innovations, environmental technology programs (ETP), energy system modernization (SET), governance quality (EGP) and sustainable consumption (SCD) consistently reduce ecological pressure. Each of these drivers acts through distinct but complementary channels: cleaner production, energy efficiency, regulatory discipline and responsible consumption. The only exception is the expansion of digital consumption (DCE), which is linked to increased ecological pressure. This reflects the environmental costs associated with growing data infrastructure, heightened logistics demands and the rebound effects of digital commerce. Overall, these results highlight a structural tension in OECD economies: while measurable forces for mitigation exist, the environmental impact of the digital economy is partially counteracting these efforts.
Discussion and conclusion
Discussion
This research aimed to understand the motivations behind ecological footprints in high-income OECD economies by examining five interrelated factors: environmental technological innovation, smart energy transition, eco-governance performance, sustainable consumption dynamics and digital consumption. The findings indicate that a single factor does not drive environmental pressure in these economies; rather, it results from the interaction of multiple forces. Some of these factors reduce ecological footprints, while one, the rise of digital consumption, increases them. The implications of these findings are straightforward but significant for policymakers: to promote ecological sustainability, they must invest not only in green technology and clean energy but also in managing the environmental costs associated with rapid digital growth. The novelty of the contributions lies not so much, however, in the direction of individual coefficients, which overall agree with existing literature, then in the conceptual insight that is obtained by jointly modeling such determinants in a dynamic persistence model. The findings indicate that individual policy tools do not drive sustainability transitions in OECD economies, but rather the balance between reinforcing and diminishing structural driving forces. This systemic reading builds on the existing body of literature by orienting ecological footprint dynamics as a byproduct of the technological, institutional, behavioral and digital processes and interactions coevolving. As hypothesized by H1, the ecological footprint is statistically significantly affected by environmental technology patents, with a negative effect, indicating that innovation-based efficiency gains, cleaner production processes and environmentally focused R&D are also key factors in decoupling ecological pressure and economic activity. The finding supports environmental transition theories that emphasize innovation and shows that, in technologically advanced OECD economies, eco-innovation is not merely symbolic but translates into tangible ecological benefits. To support H2, the smart energy transition is also found to significantly decrease the ecological footprint, indicating that investments in smart grids, energy efficiency and cleaner energy systems are effective in reducing environmental pressure by optimizing energy consumption and reducing reliance on carbon-intensive infrastructure. This observation aligns with structural transition arguments, which emphasize efficiency and system-level change rather than energy substitution alone. H3 is also accepted, with eco-governance performance having a negative and significant relationship with ecological footprint, demonstrating the key role of strict environmental policies, regulatory enforcement and the quality of institutions in limiting unsustainable production and consumption modes. This finding validates the fact that technological and energy transitions have better environmental impacts when incorporated into sound governance systems. Moreover, the negative sign of the coefficient for sustainable consumption dynamics empirically supports H4, which shows that changes in household spending on environmentally friendly products and responsible consumption patterns have a significant impact on ecological pressure reduction, even in the high-income setting, where consumption levels are structurally elevated. The finding underscores that demand-side behavioral changes supplement supply-side technological and policy interventions in achieving sustainability goals. Conversely, the growth of digital consumption is identified as having a substantial impact on the ecological footprint, confirming H5 and pointing to environmental trade-offs in the context of e-commerce, digital services and data-driven consumption. Although digitalization has the potential to increase efficiency, the positive coefficient indicates that, as it currently stands, digital consumption in OECD countries exacerbates energy demand, logistics activity and material throughput, thereby nullifying some of the sustainability benefits of innovation and governance improvements. In general, the findings indicate a complex sustainability environment in which technological innovation, energy transition, the quality of governance and sustainable consumption coexist to alleviate ecological pressure. In contrast, unregulated digital consumption growth has become a new structural factor of environmental stress. These results highlight the need for combined policy frameworks that can both facilitate green innovation, control digital energy intensity, enhance governance systems and guide consumption habits toward sustainability to limit ecological footprints in developed economies adequately.
The empirical research of this study is relevant to the theoretical framework and practical governance requirements. Regarding sustainability transitions, the findings affirm that transitions are not fuelled by a single lever; rather, they derive from the coevolution of innovation systems, institutional quality and household-level behavioral change. Green technology and governance support each other and sustainable consumption enhances the demand-side signal. Nevertheless, the beneficial impact of digital consumption growth creates a structural contradiction that transition theory has not thoroughly considered: the same digital infrastructure that facilitates efficiency and dematerialization generates new environmental liabilities through energy consumption and physical distribution. This is important to policymakers because sustainability policies should be combined and pursued concurrently: investment in green innovation, regulation of the environmental externalities of digital markets and governance and responsible consumption should not be pursued sequentially or in disconnected ways.
Conclusion
This research provides an integrated analysis of dynamics in ecological footprints across the countries within OECD and its results confirm the very high persistence of environmental pressure, thus emphasizing the structural and path-dependent nature of natural resource use in developed economies. Results from GMM regressions imply that patents in environmental technology, efficient energy transition, the effectiveness of eco-governance and sustainable consumption dynamics have a mitigating effect on reducing ecological footprints, thus implying that innovative efforts, energy efficiency, institutional effectiveness and behavioral changes on the consumer side should be treated as alternative drivers of mitigating environmental stress. On the contrary, rising digital consumption appears to act as a driver of environmental stress, thereby suggesting that the current impact of digitalization is more negative for the environment due to higher energy and material usage as well as intensification of logistic activities along with market digitalization. This study adds to the existing environmental economics literature on sustainability transition in that it emphasizes a more holistic approach in terms of considering all four aspects of technological, institutional, behavioral and digital factors instead of focusing on each of these drivers individually. In terms of politics, the results indicate that ecological sustainability in advanced nations cannot be achieved by technology or energy transitions, but only by having a reliable framework of governance, deliberate measures for altering consumption trends and controlling the environmental impact of digitalization. From a wider perspective, this research highlights the concept that ecological integrity in planetary boundaries within developed nations is possible only when innovation systems, governance capabilities and consumption patterns become congruent with the goal of sustainability and emerging digital challenges are not ignored. The implication of the research results for sustainability policy-making of economies of OECD nations would be that sustainability strategies should have an integrative approach based on instruments. In relation to green innovations, the diffusion of technologies aimed at the promotion of environmental issues could be accelerated through the use of incentives like R&D tax credits and patent subsidies, as well as cooperation of government and private sector. Investments into smart grids, carbon taxes and renewable portfolio standards are quite relevant to address structural inefficiency in energy. The improvement of eco-governance abilities requires not only the strengthening of environmental regulations, but also their implementation, as well as greater intersectoral cooperation. Positive connection between growth of digital consumption and ecological footprint reveals a structural trade-off. Energy-efficiency requirements for data centers, green cloud certification frameworks, sustainable logistics policies and package minimization requirements should therefore accompany these policies designed to drive digital growth in e-commerce markets. In the absence of complementary actions, the digital expansion can reverse the gains achieved through technological and governance enhancements.
Limitations and future directions
The study has limitations that offer productive avenues for future research, despite its helpful contributions. First, the analysis is based on secondary, macrolevel indicators drawn from international databases. As a result, the study also provides comparability across the OECD countries. However, this may, in turn, hide important heterogeneity at the sectoral, regional and firm levels and introduce bias in aggregating to capture technology adoption, consumption behavior and digital activity. Second, while this system GMM estimator is effective at capturing dynamic persistence and unobserved heterogeneity, averaging the effects produced can conceal significant institutional, technological and structural differences across OECD countries. The study fails to address the potential effects of slope heterogeneity and regional clustering on the magnitude of estimated relationships, as it does not provide examples of the contextual variation in these factors. Future studies should use heterogeneous panel or country-clustered estimators to enhance the identification of distinct sustainability trajectories of varying OECD settings. Third, the narrow set of studies on OECD economies contributes to internal consistency but limits the ability to generalize the results to developing or emerging economies that exhibit vastly different institutional quality, digital infrastructure and consumption patterns. Future studies might thus generalize this model using non-OECD or mixed-country samples, explicitly model nonlinear and conditional effects and examine the channels of interaction among technological innovation, the quality of governance and digitalization. Additional research can also be conducted using complementary environmental indicators, such as biodiversity loss, material footprint or consumption-based emissions, to address broader aspects of sustainability. Finally, disaggregated data and qualitative institutional analysis would provide higher levels of causation about the interrelationships among policy design, behavior change and digital transformation in creating ecological pressures, which would support the sustainability transitions evidence base across a varied set of economic settings.
The authors extend their heartfelt thanks to the editorial board and the anonymous reviewers for their valuable suggestions.
Funding
There is no funding for this study.
Ethics statement
This is an observational study. The authors confirmed that no ethical approval is required.