The purpose of this paper is to identify and analyze the link between climate change and agricultural growth in Malaysia, and pursue three sub‐objectives: to determine and analyze the link between agricultural growth rate and climate change score; to determine and analyze the link between per capita CO2 emissions and agricultural production index; and to determine and analyze the link between per capita agricultural production index and per capita CO2 emissions.
Relevant time series data compiled from several online sources including the Germanwatch, Ministry of Finance, Malaysia, and the United Nations database were used. The data for agricultural growth rate and climate change score for Malaysia were found to be available only for the four recent years from 2006 to 2009. The data for other variables such as per capita agricultural production index and per capita CO2 emissions have been standardized covering the period from 1990 to 2004. The ordinary least squares methods were employed to estimate the parameters in the three linear regression models.
The empirical results of the study reveal three important observations for Malaysia: the link between agricultural growth rate and climate change score is proven to be negative, but insignificant (p>0.1); the link between per capita CO2 emissions and agricultural production index is found to be direct and highly significant (p<0.01); and the link between per capita agricultural production index and per capita CO2 emissions is proven to be positive and highly significant (p<0.01). Also, an increasing level of per capita CO2 emissions in the country is proven to have both detrimental and beneficial effects on its agricultural growth. For instance, agricultural growth in Malaysia is found to produce significant effects on climate change, primarily through the production and release of CO2.
The paper recommends that the two‐way link between climate change and agricultural growth depends on the balance of the effects and that an in‐depth assessment of such effects might help the appropriate authority to anticipate the effects more accurately. The paper will be useful to researchers wishing to conduct research and develop models on the nexus between climate change and agriculture.
Introduction
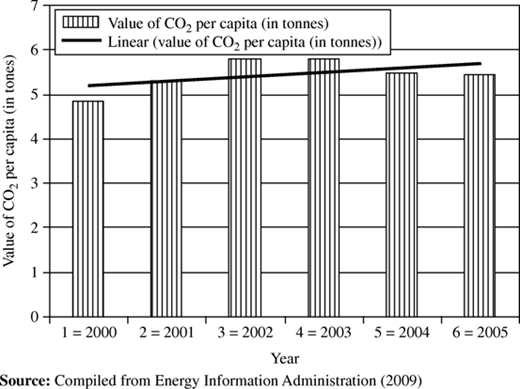
Malaysia has ratified the United Nations Framework Convention on Climate Change and Kyoto Protocol, which aim to reduce the amount of greenhouse gases (GHGs) in order to deal with global warming. Malaysia is, as a non‐annex I country, not obligated to reduce its GHG emissions. This is due to the fact that the total amount of carbon dioxide CO2 emission in the country is still much lower than most developed countries. Malaysia has undertaken a number of measures to reduce GHG emissions such as by improving public transportation and introducing cleaner fuels such as natural gas and bio‐fuels. The country is also actively participating in the clean development mechanism under the Kyoto Protocol. Malaysia has developed programs to increase renewable energy share in its energy mix for energy supply security (Yen et al., 2008). At present, there are nine companies involved in energy generation using biomass and one involved in fuel switching. The emission reductions from these projects were estimated to be 1,615,972 tones equivalent CO2 per year (UNDP, 2006). Also the country has programs to adopt low CO2 emission measures and technologies such as replacing oil and coal with natural gas and adopting clean coal technologies. Malaysia provides various fiscal incentives to encourage the use of renewable energy and to improve energy efficiency. The companies providing energy conservation services can apply for pioneer status with tax exemption of 70 percent of statutory income for a period of five years or an investment tax allowance of 60 percent on the qualifying capital expenditure incurred within a five year period. The companies are also given import duty and sales tax exemption for equipment used in related projects, which are not produced locally. Equipment purchased from local manufacturers is given sales tax exemption. For companies which incur capital expenditure for conserving energy for their own consumption, the incentives provided are accelerated capital allowance on related equipment that can fully be given up for lost within a period of one year and import duty and sales tax exemption for equipment used in energy conservation. The implementation of the above measures and strategies, however, has enabled Malaysia to see a significant decline in its per capita CO2 emissions starting from 2004 (Figure 1).
According to the United Nations Development Report, during the period of 1990 to 2003 emissions of carbon dioxide increased in Malaysia by 221 percent. This growth rate stands among the 30 biggest GHG emitters. Curb Global Warming (2007) quoted from the Associated Press (AP) “this rapid growth in emissions has occurred even though Malaysia ratified the Kyoto Protocol and has taken several initiatives to use renewable energy as well as ways to cut emissions”. With a population of about 27 million, Malaysia ranks as the 26th largest GHG emitter in the world. Based on its growth rate of emissions it appears likely to move up the list quickly, and therefore Malaysia, in the fight against global warming, seems to be a country that needs to closely watch the sources of its GHG emissions.
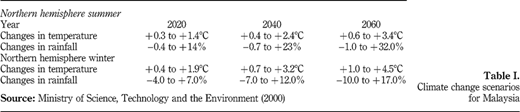
Malaysia experiences relatively uniform temperatures throughout the year. The temperature changes in Malaysia ranging from+0.3°C to+4.5°C and rainfall changes ranging from −30 to+30 percent and the mean temperature in the lowlands ranges between 26°C and 28°C, with little variation in the different months or across different latitudes (Table I). Although the annual variation of the daily mean temperature may be small (about 2°C‐3°C) the diurnal variation may be as large as 12°C. The average lowland station can record temperatures from about 20°C‐32°C in a day. Air temperatures of 38°C and above have very rarely been recorded. Since climate change can reduce crop yield areas prone to drought agricultural lands can become marginal or unsuitable for the cultivation of some of the crops, such as, rubber, oil palm, cocoa, and rice, thus posing a potential threat to national food security and export earnings. As much as 6 percent of land planted with oil palm and 4 percent of land under rubber may be flooded and abandoned as a result of sea level rise (Ministry of Science, Technology and the Environment, 2000).
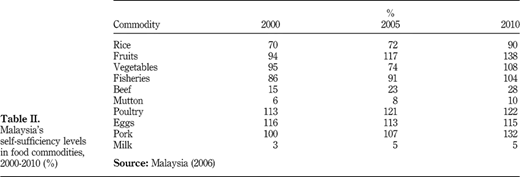
The agricultural sector of Malaysia has had experienced several problems and challenges in the 1980s. The land problem was then considered as foremost, because more agricultural land was taken over for industrial, infrastructural, and housing purposes. During the same decade there was also less market protection for agriculture sector as it enjoyed very little in contrast to the manufacturing sector. Export taxes had been imposed on palm oil, rubber, and pepper and agricultural production had declined as the result. On the other hand, trade protection for manufacturing sector enhanced the credit worthiness, made manufacturing sector easier to obtain financing. With such advantages in manufacturing sector, it was not difficult to observe why there had been a persistent outflow of resources from agricultural sector to manufacturing sector, thus exploiting agricultural growth. Worth noting that manufacturing sector was then able to offer higher wages and better conditions of work. As a result agricultural workers were then discouraged and the sector had to offer higher wages merely to mitigate the outflow. Agricultural employment in 1990 was almost at the same level as in 1985 despite a larger workforce in the country. The agricultural sector also experienced challenges of natural problems as it never had comparative advantage in the production of food. Production of beef and mutton, for example, suffered from a lack of grazing land, low production through reduced food intake by animals as a result of the hot and humid climate, and the high import costs of animals. The production of rice has continued to fall short of a series of successively lower targets. Table II depicts actual estimations for 2000 and 2005 and projected estimation for 2010, which were carried out in 2006 and show that until 2005 Malaysia did not have self‐sufficiency in many important food commodities including rice, vegetables, fish, beef, mutton, and milk.
Upon realizing shortfalls and inefficiencies of the agricultural sector the Second National Agricultural Policy (1992‐1997) was revised in 1998 and subsequently the Third National Agricultural Policy (1998‐2010) was introduced. This new agricultural policy was founded on a vision of sustainable development of a dynamic agricultural sector in the way that the growth of agriculture was to be market‐led, commercialized, efficient and competitive. The principal aim was to maximize income through optimal utilization of resources. However, the objectives of this new policy were to achieve a balanced development between agriculture and the other sectors of the economy; to enhance the economic/structural integration of the sector with the rest of the economy, and in particular with the manufacturing sector; to achieve a higher level of expansion and development of the food industry sub sector; to achieve a wider and more effective representation and participation of the Bumiputra (indigenous) community in modern and commercial agriculture, agribusiness and agricultural trade; and to ensure sustainable development in agriculture.
Agriculture of any country as well as Malaysia has an important role in the carbon cycle. Evidences suggest that Malaysian agriculture has been associated with some unsustainable practices as well as land clearance, which may lead to substantial carbon emissions in the country. In fact, agriculture affects the storage of carbon in the soils and unsustainable agricultural practices may lead to the direct release of GHGs, specifically methane and nitrogen emissions. So agriculture can be affected by climate change and climate can also be affected by agricultural practices. This study is thus an effort to explore the two‐way link between climate change and agricultural growth in Malaysia.
Literature review
It is widely accepted that an increasing variations in global climate change will have substantial impacts on agriculture and the environment, including water resources, fisheries, forests, wildlife, and ecosystems. Scientists predict that the enhanced greenhouse effect could intensify climate variability. For the agriculture sector, changes in temperature and/or rainfall could significantly affect production of agricultural farms. The predicted change in climate will directly affect the management of both crop and livestock in terms of decisions regarding seedling dates, crop variety choices, pests and diseases, livestock, water and other important factors. For example, higher levels of organic matter in soil translate into better plant nutrient content, increased water preservation capacity and better structure – eventually leading to higher yields and greater resilience. Since carbon is a main ingredient in organic matter, there are strong connections among increased production, climate change mitigation and adaptation through sequestering this carbon in the soil. This combined with the fact that GHG emissions change with the type of farming operations and within individual farms, resulting in another challenge to managing the rapidly changing agricultural industry in a sustainable manner. Agricultural practices that improve land use and management, through increasing and maintaining soil carbon stocks can, if properly implemented, generate multiple benefits: climate change mitigation, increased agricultural and food production, pro‐poor income generation, environmental services and improved resilience/adaptive capacity of farming systems. This constitutes an enormous opportunity for meeting a number of key global and national goals. The challenge is to ensure that the enabling means embodied in a new climate change agreement will encourage the agriculture sector and its farmers to generate these benefits under increasingly adverse conditions shaped by global financial, food and fuel insecurity.
The agriculture sector is a key source of global GHG emissions (14 percent or 6.8 Gt of CO2 equation), but with a high technical mitigation potential (5.5‐6 Gt of CO2 equation per year by 2030) (Mueller, 2009). It is revealed that 74 percent of emissions from agriculture are in developing countries. Mueller (2009) further reveals that agriculture is a sector where mitigation action has strong potential co‐benefits for sustainable development (food security, poverty reduction among the 70 percent of the poor living in rural areas, environmental services) and climate change adaptation (improving agro‐ecosystem resilience). The preceding study also reveals that most of the mitigation potential from agriculture could be achieved through soil carbon sequestration (89 percent) and roughly 70 percent could be realized in developing countries. There is also potential to decrease emissions of other non‐carbon GHGs (N2O and CH4) through more efficient use of fertilizers and improved rice and livestock systems. The FAO (2006) reported that livestock and livestock‐related activities such as deforestation and increasingly fuel‐intensive farming practices are responsible for over 18 percent of human‐made GHG emissions, including: 9 percent of global carbon dioxide emissions, 35‐40 percent of global methane emissions (chiefly due to enteric fermentation and manure), and 64 percent of global nitrous oxide emissions (chiefly due to fertilizer use). The preceding study also reported that worldwide, livestock production occupies 70 percent of all land used for agriculture, or 30 percent of the land surface of the earth.
A study by The Netherlands Environmental Assessment Agency (2005) reveals that the relative fraction of man‐made GHGs is coming from eight categories of sources, as estimated by the Emission Database for Global Atmospheric Research. The value for each fraction is intended to provide a picture of global annual GHG emissions in the year 2000. Rohde (2000) reveals that activities relating to agricultural byproducts and land use and biomass burning, two categories among eight, are contributing 22.5 percent to global GHG emissions. Studies have also shown that higher CO2 levels lead to reduced plant uptake of nitrogen (and a smaller number showing the same for trace elements such as zinc) resulting in crops with lower nutritional value. This would primarily impact on populations in poorer countries less able to compensate by eating more food, more varied diets, or possibly taking supplements. Reduced nitrogen content in grazing plants has also been shown to reduce animal productivity in sheep, which depend on microbes in their gut to digest plants, which in turn depend on nitrogen intake. According to the IPCC (2001), “The importance of climate change impacts on grain and forage quality emerges from new research”. Cooked rice grain from plants grown in high‐CO2 environments would be firmer than that from today's plants. However, concentrations of iron and zinc, which are important for human nutrition, would be lower (Seneweera and Conroy, 1997). Moreover, the protein content of the grain decreases under combined increases of temperature and CO2 (Ziska et al., 1997; IPCC, 2003).
Climate change may increase the amount of arable land in high‐latitude region by reduction of the amount of frozen lands. A 2005 study reports that temperature in Siberia has increased 3°C in average since 1960 (much more than the rest of the world). However, reports by Kokorin and Gritsevich (2007) about the impact of global warming on Russian agriculture indicate conflicting probable effects: while they expect a northward extension of farmable lands, they also warn of possible productivity losses and increased risk of drought (Pearce, 2003). Sea levels are also expected to get up to one meter higher by 2100, though this projection is disputed. A rise in the sea level would result in an agricultural land loss, in particular in areas such as South and South East Asia. Erosion, submergence of shorelines, salinity of the water table due to the increased sea levels, could mainly affect agriculture through flooding of low‐lying lands. Low lying areas such as Bangladesh, India and Vietnam will experience major loss of rice crop if sea levels are expected to rise by the end of the century. Vietnam for example relies heavily on its southern tip, where the Mekong Delta lies, for rice planting, and thus any rise in sea level of no more than a meter will drown several sq. km. of rice paddies, rendering Vietnam incapable of producing its main staple and export of rice (IRRI, 2007).
Materials and methods
This study has developed three linear regression models in order to attain the objectives. The first linear regression model was developed to determine and analyze the link between agricultural growth rate and climate change score while the second model was developed to determine and analyze the link between per capita CO2 emissions (in metric tons) and agricultural production index. The third model was developed to determine and analyze the link between per capita agricultural production index and per capita CO2 emissions (in metric tons). The relevant data for Malaysia have been compiled from several online sources including the Germanwatch (2009), Ministry of Finance (2009), and the UN database (2009). The data for agricultural growth rate and climate change score for Malaysia were found to be available only for the four recent years from 2006 to 2009. The most recent data for agricultural production index and per capita CO2 emissions (in metric tons) for Malaysia were not found and thus this study is considering such data from 1980 to 2004. Even though per capita agricultural production indices for Malaysia were found to be available from 1990 until 2006, per capita CO2 emissions (in metric tons) for the country are found to be available from 1980 until 2004. This study has thus standardized data for both per capita agricultural production indices and per capita CO2 emissions (in metric tons) by covering the period from 1990 to 2004. As such the above three linear regression models consist of quantitative variables only. The ordinary least squares (OLS) methods were employed to estimate the parameters in the linear regression model. The significant relationships between dependent and independent variables were examined from the value of the correlation coefficient (R) in two variable cases; and t‐values, adjusted R2‐values and F‐values in the multivariate cases. In addition, the conventional goodness of fit indicators such as R2 and adjusted R2 were also employed. The F statistic was used to test the significance of the R2 statistic in the linear regression model. This is because the study also aims to know whether there is any significant strength of the association or co‐variation between variables. In fact, in the standard linear regression model, R2 can range in value between 0 and 1, with a value of close to 1 indicating a good fit of the model developed. The t‐statistic has been employed in all the developed models as a guide to indicate the importance of a variable in the regression model.
However, the use of the (OLS) methods in the present study is basically consistent with some other recent studies conducted on the similar fields. For example, Patt et al. (2010) used the OLS methods for estimating 23 least‐developed countries' vulnerability to climate‐related extreme events over the next 50 years, given the influence of projected socio‐economic development. Akpalu et al. (2008) also used OLS method to identify and analyze the link between climate variability and maize yield in South Africa. Lobell and Field (2008) conducted an empirical study titled “estimation of the carbon dioxide (CO2) fertilization effect using growth rate anomalies of CO2 and crop yields in all Northern Hemisphere countries since 1961. For each country and crop, however, the preceding authors have used the OLS linear regression to estimate the effect of elevated carbon dioxide (CO2) on crop yields. Using a Ricardian approach and employing the OLS estimation Maddison et al. (2006) assessed the economic impacts of climate change on agriculture and the farming communities in Africa. One of the main reasons for using the OLS estimation by the preceding authors is, as they mentioned, if the measurement errors are uncorrelated with the explanatory variables, OLS still produces unbiased and consistent estimators.
Results and discussion
Link between agricultural growth rate and climate change score
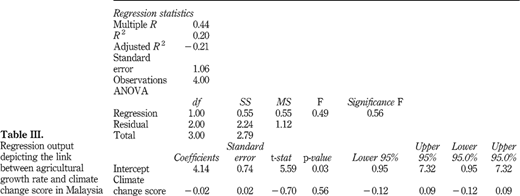
Most agronomists believe that agricultural growth will be mostly affected by the severity and pace of climate change. Rapid climate change could harm agriculture in many countries, especially those that are already suffering from rather poor soil and climate conditions, because there is less time for optimum natural selection and adaption. Climate plays a key role in determining agricultural growth. Within a climatic zone, the weather, as expressed by the amount of rainfall, sunshine hours, temperature, relative humidity and length of the drought period, results in year‐to‐year variability of agricultural production. In Malaysia, the primary concern related to climate change is the potential threat it poses to national food security and export earnings from plantation crops. Therefore, any unfavorable climate will negatively affect agricultural growth. This study has developed a linear regression model to identify and analyze the link between agricultural growth rate and climate change score in Malaysia. The model considered agricultural growth rate as the dependent variable while climate change score as the independent variable. The model has produced an interesting output, which is presented in Table III.
The regression output (Table III) shows that the link between agricultural growth rate and climate change score in Malaysia is proven to be negative, but insignificant (p>0.1). This simply means that a decrease in climate change score will result in higher agricultural growth for Malaysia, assuming other factors remain constant. This finding is compatible with the widely voiced assertion that climate change impacts the agricultural growth and its sustainability negatively. While considering the low and negative value of adjusted R2 (−0.21) and the level of significance produced by the model, it can reasonably be argued that the observed negative relationship between agricultural growth rate and climate change score has not yet reached an attention‐craving situation in Malaysia. This is argued based on the four following facts:
- 1.
the model has produced a negative adjusted R2 value, which is resulted from too low of a ratio of observations to regressors;
- 2.
the R2 (0.20) of the model is less than its adjusted R2 (0.21) in absolute value;
- 3.
the model has considered climate change score as the only independent variable; and
- 4.
the observations covered a limited time period from 2006 to 2009, which may not be sufficient for determining the actual link between agricultural growth rate and climate change score.
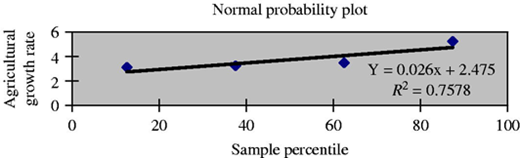
While looking at the model's normal probability plot, which is a graphical technique for assessing whether or not a data set is approximately normally distributed, we can argue that data considered in the analysis are normally distributed and that model's dependent variable (agricultural growth rate) and independent variable (climate change score) are linearly correlated (Figure 2). Also with a higher R2‐value (0.7578) of the normal probability plot it can be argued that the model's correlation coefficient (0.026) may be more important than its regression coefficient (2.475).
Link between per capita CO2 emissions (in metric tons) and agricultural production index
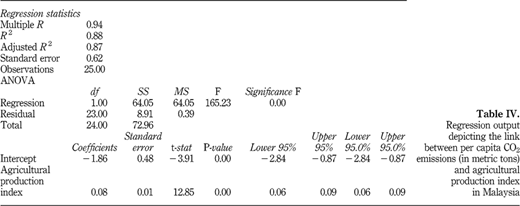
Agricultural practices are sources of and make potential sink for GHGs and thus it is expected that agriculture sector, along with others, can play an important role in trying to limit the per capita CO2 emissions. For example, the per capita CO2 emissions from agriculture can be lowered by encouraging additional measures to reduce energy consumption in agriculture or by reducing rates of soil oxidation. In addition, more energy efficient farm equipment, less mechanical crop drying, less use of agricultural chemicals, less irrigation, and minimum tillage would all save CO2 emissions. This study has developed another linear regression model to identify and analyze the link between per capita CO2 emissions and agricultural production index in Malaysia. The model considered per capita CO2 emissions as the dependent variable while agricultural production index as the independent variable. The model's output is presented in Table IV.
The regression output (Table IV) reveals that there is a direct and significant link between per capita CO2 emissions and agricultural production index in Malaysia. This finding indicates clearly that higher agricultural production is associated with and causing more per capita CO2 emissions in the country, assuming all other relevant factors remain constant. Worth noting that this finding is compatible with the finding we got for the previous model, which postulated that a decrease in climate change score will result in higher agricultural growth. This observation is also strongly supported as the relationship between per capita CO2 emissions and agricultural production index has also been proven to be highly significant (p<0.01). In addition, the model has produced a higher adjusted R2 value (0.87), which is a statistical measure of how well a regression line approximates real data points. Therefore, we can strongly argue that this model has the greater ability to predict the factual link between per capita CO2 emissions and agricultural production index in Malaysia.
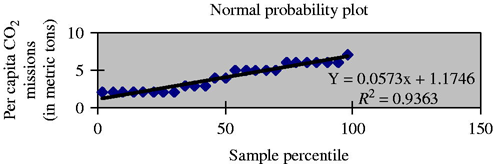
Since the model's normal probability plot is approximately normally distributed, we can argue that data considered in the analysis are normally distributed and that model's dependent variable (per capita CO2 emissions) and independent variable (agricultural production index) are linearly correlated (Figure 3). This is also strongly supported by the fact that the figure of the normal probability plot has produced a higher R2 value (0.9363). Hence, we can reasonably argue that that the model's correlation coefficient (0.0573) may be more important than its regression coefficient (1.1746).
Link between per capita agricultural production index and per capita CO2 emissions (in metric tons)
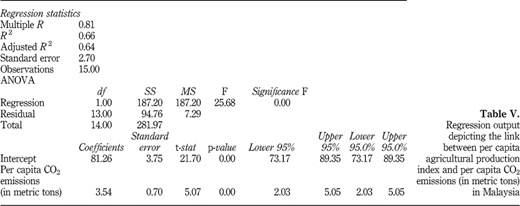
Carbon dioxide is essential to plant growth. Rising CO2 concentration in the atmosphere can have both positive and negative consequences. As discussed earlier per capita CO2 emissions can be the function of agricultural production index. Conversely, per capita agricultural production index can also be the function of per capita CO2 emissions. For example, CO2 is one of the elements necessary for agricultural plants and trees at least for their normal growth. Without absorbing necessary CO2 agricultural plants and trees cannot be grown well and efficiently and this situation will adversely affect the agricultural production. Studies indicate that crops will benefit from higher levels of CO2 (Reilly et al., 1996; Allen et al., 1996; van de Guijin et al., 1996). In fact, the higher levels of CO2 are expected to help plants cope with the higher temperatures. The increase in CO2 will consequently mitigate the potential damage of warming and may lead to an overall increase in crop yields. This study has thus taken an effort to explore and analyze this relationship using a linear regression model. The study considered per capita agricultural production index as the dependent variable while per capita CO2 emissions as the independent variable. The empirical output of the model is shown in Table V.
As per the output table (Table V) above, the model generated a positive coefficient value (3.54) for per capita CO2 emissions with a highly significant probability value (p<0.01). This simply means that the link between per capita agricultural production index and per capita CO2 emissions is proven to be positive in Malaysia. It is interesting that this finding does not contradict with the observations we have had in the previous two models. As the model reveals and it is also very likely that an increase in per capita CO2 emissions, which is necessary for agricultural growth, may increase per capita agricultural production index. This observation is strongly supported by the facts that the proportion of the variation in the dependent variable is little and that the model has produced a considerably higher adjusted R2‐value (0.64).
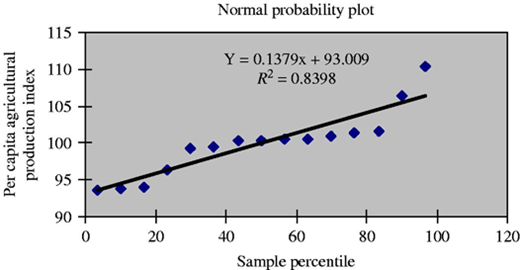
What is more interesting is that the model's normal probability plot is approximately normally distributed (Figure 4). As data considered in the analysis are normally distributed, we can reasonably argue that model's dependent variable (per capita agricultural production index) and independent variable (per capita CO2 emissions) are linearly correlated. This observation is also strongly supported by the fact that the figure of the normal probability plot has produced a higher R2‐value (0.8398), which is the fraction of the variance in the data that is explained by a regression. Therefore, as similar with previous two models, the model's correlation coefficient (0.1379) may be more important than its regression coefficient (93.009).
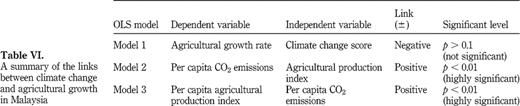
The findings obtained from the above three regression models reveal that agricultural growth in Malaysia is being impacted by climate change phenomenon, and that agricultural growth is also believed to be connected with the release of CO2 emissions in the country. While the nature, scale, frequency, and outcome of such impacts differ significantly among countries as well as areas within a country, a summary of the links between climate change and agricultural growth in Malaysia is presented in Table VI.
Conclusions
The estimations obtained above give evidence to the effect that climate change and agricultural growth are negatively linked in Malaysia. The estimations also reveal a positive link between per capita CO2 emissions and agricultural production index for the country. The same link has also been evident between per capita agricultural production index and per capita CO2 emissions for Malaysia. In effect, an increasing level of per capita CO2 emissions in the country is proven to have both detrimental and beneficial effects on its agricultural growth. For example, the link between per capita agricultural production index and per capita CO2 emissions is proven to be positive, but an increasing level of per capita CO2 emissions in the country is proven to have detrimental effects on the agricultural growth. This may happen due to the fact, among others, that agricultural growth driven by an excessive use of chemicals and fertilizer can produce negative effects on climate change, primarily through the production and release of CO2. Land use change such as deforestation and desertification, together with use of fossil fuels, are the major anthropogenic sources of carbon dioxide; agriculture itself is the major contributor to increasing methane and nitrous oxide concentrations in earth's atmosphere (UN, 2007). The overall effect of climate change on Malaysian agricultural growth will actually depend on the balance of these effects. An assessment of the effects of climate change on Malaysian agricultural growth might help the appropriate authority to anticipate the real effects more accurately. Recent evidences suggest that Malaysia's agricultural trade has grown in recent years, and the country can now provide significant amounts of food to the nation and its major importing countries. The international aspect of trade and security in terms of food implies the need for Malaysia to consider the effects of climate change on a global scale.
Since climate change is universal and we all believe in its indefinite existence, adaptation to and mitigation of damages from climate change will be the best ways to deal with its effects in the short run. Therefore, the agricultural stakeholders need to adapt to and find ways to mitigate the damages of climatic variations in order for them to sustain agricultural productivity and attain food security. While the nexus between climate change and agriculture is being debated widely, a solid and universal conclusion of what causes what and why and how they are mutually causal does require an in‐depth investigation using multidisciplinary approaches at the level where the primary stakeholders practically face the both phenomenon. Thus, the present study does bear some limitations which were beyond our ability to overcome. As mentioned earlier, except for agricultural growth rate and climate change score, data for all other variables were standardized which has eventually resulted in for an inclusion of data in the models from 1990 to 2004. Also, the data for agricultural growth rate and climate change score were found to be available only from 2006 to 2009. Nevertheless, this study would bring worth to those of novice researchers wishing to conduct research and develop models on the nexus between climate change and agriculture.
References
About the authors
Md. Wahid Murad is presently a Senior Lecturer at the Department of Economics, University of Malaysia Terengganu (UMT), Malaysia. He also holds the position of Adjunct Research Fellow at the Institute for Environment and Development (LESTARI), National University of Malaysia, from where he earned his PhD in Environment and Development in 2002. Before joining the present university he served the Multimedia University as a faculty, Head of Economics Unit, and Associate Dean of the Faculty of Business and Law for five years. He taught economics at both undergraduate and postgraduate (MBA and MSc) levels and supervised numerous postgraduate research students including PhDs. He has completed a number of funded research projects (both internal and external) at different capacities and was appointed as consultant to some private EIA firms and government agencies. He has published 20 research papers in scholarly international journals and presented papers at over 30 international conferences. His research areas include environmental and natural resource economics; particularly relating to poverty and environment, socio‐economics, sustainable agriculture, and climate change. Md. Wahid Murad is the corresponding author and can be contacted at: mwmurad@gmail.com
Rafiqul Islam Molla has a 48‐year long successful teaching career serving various universities in Bangladesh, Kenya, Nigeria, Uganda, and Malaysia as a faculty, Head of Department, Dean of Faculty, etc. He retired as a Professor of Economics from North South University, Bangladesh, before joining the Multimedia University of Malaysia as a specialist in economics in 2006. He obtained the B.Com (Honors) and M.Com. degrees from Dhaka University, Bangladesh, and enjoyed talent scholarship. He earned PhD in Agricultural Economics from Texas A & M University, USA, in January 1970 and enjoyed USAID Scholarship. Again with USAID Scholarship he attended a three‐month long intensive summer course at the International Marketing Institute, Harvard University Campus, USA. Recently, he received a one‐month EU fellowship award at University of Trento, Italy. He is the founder of Bangladesh Association for Total Social Advancement with its two arms: Forum for Faith‐based Intellectualism and Activism (an intellectual forum) and Sheba Polly (a rural service centre) for providing six categories of services on a charity scheme. He has published a large number of research papers in various reputed national and international journals. The most recent ones are published in European Journal of Scientific Research, Euro‐Asian Journal of Applied Sciences, The Global Economy Journal, Journal of Business and Behavioral Science, Journal of Comparative International Management, and Challenge – The Magazine of Economic Affairs.
Mazlin Bin Mokhtar is currently the Director of the Institute for Environment and Development (LESTARI), National University of Malaysia. He also holds the positions of Professor and Principal Research Fellow at LESTARI. He obtained his PhD in Analytical and Environmental Chemistry from the University of Queensland in 1988. He has been teaching, conducting research, and consulting in the areas of sustainability science and chemical governance, environmental and analytical chemistry including eco‐toxicology, integrated water resource management, integrated river basin management, climate change, and environmental health. He is the author or co‐author of more than 130 articles in environmental chemistry and related areas.
Md. Abdur Raquib is a Lecturer of Accounting and Finance at the Faculty of Business and Law, Multimedia University, Melaka Campus, Malaysia. He is an MBA graduate from the Indiana University of Pennsylvania, USA. He also holds a Masters of Commerce and a Bachelors of Commerce with Honors in Finance from the University of Dhaka, Bangladesh. He has presented papers in the international conferences in nine countries and so far published 25 papers in the conferences and journals. Beside his own fields, his interest also spreads among the most emerging issues, such as empowering workforce, environmental accounting, high performance work cultures, and corporate governance.