


This paper aims to understand the vulnerability of community livelihoods (human, social, financial, natural and physical assets) at a coastal environment in southern Mozambique, considering the level of exposure, sensitivity and adaptive capacity to climate change.
The study adopted the sustainable livelihoods approach. Data were collected through distribution of a structured questionnaire to 476 randomly selected households at the municipality of Inhambane. The questionnaire assessed all capital assets, covering 14 indicators and 43 sub-indicators of vulnerability, derived from published literature.
Results indicate that overall community vulnerability is largely derived from the vulnerability of physical, financial and social capitals, illustrated by declared food shortage, low nutrition levels, weak social networks, high level of biomass utilization and lack of financial resources due to unemployment. These aspects largely influence the noticed reduced adaptive capacity of surveyed households.
The study identified the need to improve the overall process of natural resources appropriation and utilization and the improvement of the governance capacity at the local targeting infrastructure, community structure and networks and capacity building that might enhance community livelihoods in changing scenarios.
The study is a contribution to the overall understanding of how livelihoods are exposed to climate change and variability in coastal settings.
1. Introduction
Climate change and variability has been considered the major issue of concern in the past decades, especially when integrated into economic development and human livelihoods (Maru et al., 2014, Williams et al., 2008). Indeed, climate change may have dramatic effects on the planning process of economic development (Ford and Smit, 2004; Weaver, 2003), can influence community livelihoods (Adger, 2003) and may disrupt community and individuals’ abilities to undergo their normal course of live (Artur and Hilhorst, 2012). Following this, attempts have been developed all over the world to understand how individuals and communities will be affected by projected climate change trends (McClanahan et al., 2009; Handmer et al., 1999).
Hence, the process of determining how climate change may affect economic processes and community daily life is a complex and uncertain endeavor (Adger and Kelly, 1999) and is a result of the uncertainty associated to climate variability. Across several approaches to understand the societal impacts of climate change – risk-based approach (Gaichas et al., 2014); participatory community-based strategies (Leonard et al., 2013); contextual approach (Gundersen et al., 2016); deductive, inductive and normative approaches (Hinkel, 2011); role and stakeholder expert (Tonmoy et al., 2014); and multicriteria outranking approach (El-Zein and Tonmoy, 2015) – the vulnerability component has been outlined as the major component (Huang et al., 2012; Kelly and Adger, 2000), as it is used to describe systems’ susceptibility to the adverse impacts of climate change (Füssel and Klein, 2006), focusing on systems, impacts and mechanisms (IPCC, 2007). This term, coined from several disciplines (Fussel, 2007; Füssel and Klein, 2006), has been described as having multiple meanings, mainly as a result of its ability to indicate major areas or issues of concern (Timmermann, 1981), being compared to resilience, marginality, susceptibility, adaptability, fragility and risk (Liverman, 1990) or exposure, sensitivity, coping capacity and robustness (Fussel, 2007).
In the context of climate change, vulnerability has been considered the exposure of groups or individuals to stress as a result of social and environmental change, with stress referring to unexpected changes and disruption to livelihoods (Adger and Kelly, 1999; Bohle et al., 1994). As such, vulnerability assessments can be broad or specific. Broad assessments target multiple sectors or globally defined policy areas, while specific assessments target identified problems to recommend specific interventions aimed at reducing vulnerability (Hughes et al., 2012; Ionescu et al., 2009; Leurs, 2005). This is the case of this study in which it is attempted to understand vulnerability at the local level in Mozambique with an aim to support policy intervention.
Since 2000, Mozambique has been a hotspot of climate change incidents in southern Africa (Arndt et al., 2010; INGC, 2009, World Bank, 2009), although since long, the country has suffered from uninterrupted cycles of droughts and floods associated to damaging consequences for the social and economic development. The most significant events were recorded in 1981-1984, 1991-1992 and 1994-1995 (droughts) and 1977-1978, 1985, 1988, 1999-2000 and more recently in 2007-2008 (floods). Apart from droughts and floods, Mozambique is often hit by cyclones, as since 1970, Mozambique has been hit by 34 significant cyclones or tropical depressions. These events exacerbate flooding events, as exemplified by the 2000 floods that were a result of a combination of torrential rains and tropical cyclones that resulted in the most devastating floods in the history of Mozambique, killing 700 and causing circa US$600m in damages (McBean and Henstra, 2003; Kundzewick et al., 2001).
With projections indicating an increase in the frequency and intensity of cyclones, shortening of the extent and intensity of the rainy season and increasing temperatures for the next years (IPCC, 2012; Arndt et al., 2010; INGC, 2009), coastal communities in Mozambique already need to adapt to ensure that climate change does not severely impact their lives (Artur and Hilhorst, 2012; Osbahr et al., 2010; Hahn et al., 2009). Coastal communities are particularly vulnerable to environmental changes as they are dependent on the natural resource base such as poor agricultural soils and reducing fisheries for their survival (Allison et al., 2009; Mimura et al., 2007; Hassan et al., 2005). As the risk of habitat degradation increases with climate change, these communities might see their livelihoods severely affected, requiring flexibility of individual or community resource-users to act (Forster et al., 2014 after Fraser et al., 2003).
Several studies have been implemented to understand the impact of climate on the coastal area of Mozambique (Broto et al., 2015; Blythe et al., 2014; Blythe et al., 2015; Palalane et al., 2016; Cabral et al., 2017); however, they mostly focus on the structural dimensions (sea level rise, exposure to cyclones and coastal erosion) of the phenomenon and lack the humanitarian perspective of effective adaptation at a household scale (Artur and Hilhorst, 2012; but see Blythe et al., 2014, 2015). Understanding that climate change is a challenge to actual and future livelihood strategies mainly at the community level (Bohle et al., 1994), and that it is unlikely to be cost effective to protect the vast majority of coastal regions of Mozambique, as relatively small levels of sea level rise dramatically increase the probability of severe storm surge events (Arndt et al., 2010). This paper outlines results of a study that aimed at quantifying the vulnerability of community livelihoods to climate change in the Inhambane Municipality, a small coastal town in southern Mozambique, to ensure effective adaptation at the household and community levels, assuming no change in the intensity and frequency of climate associated events. It adopts the Livelihoods Community Index (Hahn et al., 2009) designed as a practical tool to understand how demographic, social and health factors contribute to climate vulnerability at a community level by providing not only an overall composite index but also sectoral vulnerability scores that can be segregated to identify areas for intervention (Krishnamurthy et al., 2014; Huang et al., 2012; Hahn et al., 2009).
2. Material and methods
2.1 Study area: the municipality of Inhambane, southern Mozambique
The study was developed at the municipality of Inhambane (Figure 1), located at the southern coastal region of Mozambique. As the majority of urban areas in the country, the municipality of Inhambane is characterized by a dual spatial structure, concentrated as the urban area, per si, and an extended peripheral and rural area that is administratively associated to it (Araújo, 2003). As such, this municipality is mostly rural and its economic structure is accordingly, with households not only employed in formal institutions but also engaged in rural associated activities such as agriculture, pastoralism and artisanal fisheries (Fernando, 2012; Azevedo and Bias, 2011; Zavale, 2011).
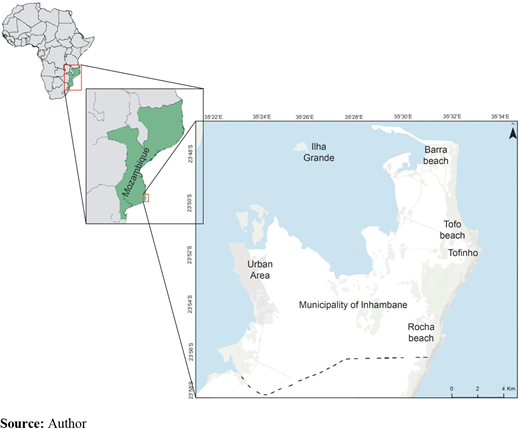
This area is located on the western coast of the Inhambane peninsula. Its eastern coast is an extensive line of beaches along the Indian Ocean, which are preferred tourism destination for many tourists and visitors. According to Nhantumbo (2009), it is located between the southern latitudes of 23°45’50” and 23°58’15” and eastern longitudes of 35°22’12” and 35°33’20”, covering a total area of 192 km2. The area is located in a subtropical zone, having peculiar characteristics because of factors inherent in the atmospheric general circulation and local factors (continentality, altitude and latitude). In this sense, climate of the municipality of Inhambane is tropical, characterized by a cold and dry season (April-August) and a warm and rainy season (September-March). The maximum monthly average temperature is 26.97°C and the minimum is 20.3°C, with an annual average rainfall of 926.8 mm. Prevailing winds are southern, occurring most frequently between December and July (Azevedo, 2009), reaching 5-8 km/h top speed, except when there are critical events such as cyclones, when the windspeed increases to circa 75 and 140 km/h (Nhantumbo, 2009).
The geographic location of the study area can be considered, itself, the major source of vulnerability because of its exposure to cyclones and tropical storms that heavily hit the area in summer. For example, in the past 20 years, the area was hit by several cyclones with speed around 120 km/h [National Institute for Disaster Reduction (INGC), 2011]. A study developed as part of the national adaptation strategy in Mozambique has outlined that because of climate change and variability, the sea level is rising in the area by at least 0.6 cm each year, with estimates that by 2050, large amounts of land might be eroded or facing severe erosion (INGC, 2009, INGC, 2011). Considering these factors, and associating with the large amount of households living under the poverty line at the municipality (van der Boom, 2011), available scenarios of climate change raise increased concerns, as soils might be eroded, agricultural profits might be reduced and fisheries might collapse, deteriorating the quality of life in the area (Fiege et al., 2003).
2.2 The conceptual framework applied
The study adopted the principles derived from the sustainable livelihoods approach (SLA) adapted from Prain (2018) and Serrat (2017) (Figure 2). The adoption of these principles stems from the idea that is it one of a number of conceptual approaches that take an asset/vulnerability approach to analyze the vulnerability of poor people (Norton and Foster, 2001), representing a way of thinking by explicitly recognizing that livelihoods are multi-sectorial, that all aspects of people’s lives will impact on the livelihood choices that they make and that livelihoods are embedded within institutional contexts (Toner, 2003). The livelihoods approach seeks to improve development policy and practice by recognizing the seasonal and cyclical complexity of livelihood strategies, helping to remove access constraints to assets and activities that complement existing patterns and identifying ways of making livelihoods as a whole more able to cope with adverse trend or sudden shocks (Allison and Horemans, 2006; Arce, 2003; Brocklesby and Fisher, 2003; Simpson, 2007).
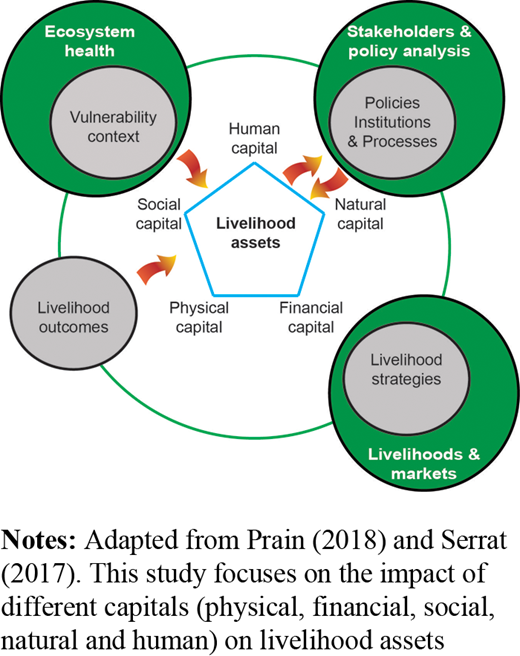
Considering that the concept of vulnerability to environmental change is an interactive phenomenon involving both nature and society, and particularly inequality and a lack of buffering against environmental threats (Kasperson et al., 2001 cited by Hahn et al., 2009), and that poor (subsistence and smallholder) livelihood systems currently experience a number of interlocking stressors other than climate change and climate variability (Morton, 2007), there is a need to understand not only the climate science but also place climate projections in the context of human societies, political systems, social hierarchies and underlying health profiles to appreciate the complex network of issues that may arise in different populations as a result of climate change. In this context, application of the SLA in this study is a strategy to identify what the poor have rather than what they do not have (Moser, 1998), centering the links between individual and households assets, the activities in which households can engage with a given asset profile and the mediating institutions that govern access to assets and to alternative activities (Doward et al., 2003; Bebbington, 1999).
2.3 Data collection and analysis
Data were collected using quantitative methods, based on a structured questionnaire designed to assess the vulnerability of all five capital assets (social, human, natural, financial and physical), covering 14 indicators and 43 sub-indicators (Table I). The questionnaire was designed based on a review of the literature on community vulnerability, with indicators extracted and/or adapted from previous research (Piya et al., 2012; Hahn et al., 2009; Sadik and Rahman, 2009; Vincent, 2004; Adger et al., 2004; Leichenko and O’Brien, 2002).
Capital system, indicators and sub-indicators used for the assessment of community vulnerability at the municipality of Inhambane
| Capital | Component | Indicators |
|---|---|---|
| Human | Health | Average time to get to the nearest health facility |
| Percentage of households indicating the existence of at least one member suffering from chronic disease | ||
| Percentage of households where at least one household member has failed job or school due to illness | ||
| Percentage of households where at least one member suffers from infectious or transmitted diseases | ||
| Percentage of aggregates indicating that at least one member died due to weather phenomena | ||
| Percentage of households where at least one member has suffered injury due to weather events | ||
| Inverse of life expectancy | ||
| Food and nutrition | Average period (in months) of food shortage | |
| Inverse of the crop diversification index | ||
| Knowledge and skills | Inverse of the education index | |
| Percentage of households that have no television at home | ||
| Percentage of households that have no radio at home | ||
| Percentage of households where no member has formal/ vocational training | ||
| Social | Demography | Dependency ratio |
| Percentage of women headed households | ||
| Average number of household members | ||
| Networks and relationships | Percentage of households that received no support | |
| Percentage of households that did not give any kind of support | ||
| Percentage of households that did not request support or assistance to government entities | ||
| Percentage of respondents who did not vote in the last elections | ||
| Percentage of households not affiliated with community-based organizations | ||
| Physical | Electricity | Percentage of households reporting not having access to electricity at home |
| Communication | Percentage of households reporting not having access to phone at home | |
| Average time to the nearest bus station | ||
| Sanitation | Percentage of households reporting not having access to latrines at home | |
| Natural | Land resources | Ratio of the percentage of households that have land for agriculture and those who have not |
| Percentage of households reporting degradation of farmland due to climatic factors | ||
| Biomass utilization | Percentage of households that use energy of the biomass to cook | |
| Average time to find fuelwood | ||
| Percentage of households reporting a reduction of fuelwood | ||
| Percentage of households using traditional stoves for cooking | ||
| Water | Percentage of households reporting hearing conflicts related to water in the community | |
| Percentage of households who collect water directly from the river or well | ||
| Percentage of households without daily water supply | ||
| Average time for water collection | ||
| Inverse of the water collection and conservation index | ||
| Climate variability and natural disasters | Average number of extreme weather events in the last 30 years | |
| Mean deviation of average daily maximum temperature per month | ||
| Mean deviation of the average daily minimum temperature per month | ||
| Mean deviation of daily precipitation per month | ||
| Percentage of households indicating that at least one member died due to weather phenomena | ||
| Percentage of households where at least one member has suffered injury due to weather events | ||
| Financial | Assets | Inverse of the land tenure index |
| Inverse of the diversity index of livelihoods associated with agriculture | ||
| Finances | Percentage of households that reported having unpaid debts | |
| Percentage of households without access to credit at any financial institution | ||
| Households that do not have members living in other relatively more developed places |
Additional information that could not be generated through household surveys, mainly climate information, was collected at different institutions (climate data from National Institute of Meteorology; agricultural data from Agricultural Provincial Directorate; and fisheries data from Provincial Fisheries Department) and through review of available reports (population data from National Institute of Statistics). The sample size calculated at a 95 per cent confidence interval and ±5 per cent precision resulted in 475 households. In October and November 2016, a team composed of the main researcher and four trained research assistants interviewed, in a random procedure, the head of each household and when not possible, any person aged 18 or above. No preference was given to the gender of the head of the household, and interviews were addressed to the available person, whether man or woman. Data were analyzed by applying the Livelihoods Vulnerability Index (LVI), developed by Hahn et al. (2009) and applied elsewhere (Northern Ghana, Etwire et al., 2013; Philippines, Orencio and Fujii, 2013; Trinidad and Tobago, Shah et al., 2013), to determine:
the vulnerability of each capital assets; and
community vulnerability as described by the Intergovernmental Panel for Climate Change (IPCC) vulnerability context.
Under this index, vulnerability is determined following three main steps, namely:
standardization of sub-components to conversion into indexes [equation (1)];
averaging to major components [equation (2)]; and
conversion of the components into an average capital index [equation (3)].
Differently from the approach followed by Hahn et al. (2009), in this study, the vulnerability index was established to range from 0 to 1, with 0 representing low vulnerability and 1 representing high vulnerability. Examples on the calculations can be found elsewhere (Hahn et al., 2009; Etwire et al., 2013). Equation (1) can be given as follows:
where Sd is the original sub-component for place d and Smax and Smin are the maximum and minimum values of the sub-component, respectively. Equation (2) can be given as follows:
where Md is 1 of the 14 components used in this study and indexsdi represents the sub-components indexed by i. Equation (3) can be given as follows:
where LVId is the Livelihood Vulnerability Index for place d and WMi is the weight of each major component.
Because the study aimed to understand the overall vulnerability of communities to climate change, all variables (Table I) were grouped into three categories of vulnerability, as defined by the IPCC: exposure, adaptive capacity and sensitivity (Hahn et al., 2009; Shah et al., 2013, Panthi et al., 2016). After grouping variables into the three components of vulnerability (Table II) as considered by the IPCC, data were normalized using equation (3), and LVI was calculated by applying equation (4):
where e is community exposure, a is community adaptive capacity and s is community sensitivity to climate change. As applied elsewhere (Hahn et al., 2009; Shah et al., 2013, Panthi et al., 2016), the LVI-IPCC ranged from −1 (lowest vulnerability) to 1 (highest vulnerability).
Indicators applied for calculating the IPCC
| Component | Subcomponent | Score |
|---|---|---|
| Exposure | Percentage of households reporting degradation of farmland due to climatic agents | 0.15 |
| Percentage of households reporting a reduction of fuel wood | 0.31 | |
| Percentage of households reporting hearing conflicts related to water in the community | 0.29 | |
| Average number of extreme weather events in the past 30 years | 0.50 | |
| Mean deviation of average daily maximum temperature per month | 0.51 | |
| Mean deviation of the average daily minimum temperature per month | 0.56 | |
| Mean deviation of daily precipitation per month | 0.50 | |
| Percentage of aggregates indicating that at least one member died due to weather phenomena | 0.02 | |
| Percentage of households where at least one member has suffered injury due to weather events | 0.13 | |
| Percentage of households without daily water supply | 0.04 | |
| Average exposure index | 0.30 | |
| Adaptive capacity | Inverse of the crop diversification index | 0.83 |
| Inverse of the education index | 0.02 | |
| Percentage of households with television at home | 0.74 | |
| Percentage of households with radio at home | 0.67 | |
| Percentage of households in which any member has vocational training | 0.38 | |
| Percentage of households using traditional cooking stoves | 0.62 | |
| Inverse of the water abstraction and conservation index | 0.00 | |
| Percentage of households receiving some support from friends and family | 0.09 | |
| Percentage of households that provided some kind of support to friends and family | 0.27 | |
| Percentage of households that requested support or assistance from government entities | 0.22 | |
| Percentage of people who voted in the last elections | 0.81 | |
| Percentage of households with members affiliated with community-based organizations | 0.18 | |
| Land tenure index | 0.03 | |
| Index of crop diversification | 0.18 | |
| Percentage of households that have access to credit from any financial institution | 0.18 | |
| Percentage of households with members living in relatively more developed locations | 0.37 | |
| Average adaptive capacity index | 0.35 | |
| Sensitivity | Average time to get to the nearest health clinic | 0.26 |
| Percentage of households reporting not having access to latrine at home | 0.36 | |
| Percentage of households that indicated the existence of at least one member suffering from chronic disease | 0.26 | |
| Percentage of households in which at least one household member has been absent from the job or school due to illness | 0.28 | |
| Percentage of households where at least one member suffers from infectious or communicable disease | 0:05 | |
| Inverse of life expectancy | 0.02 | |
| Average period (in months) of food insufficiency | 0.46 | |
| Inverse of crop diversification index | 0.83 | |
| Percentage of aggregates that use biomass energy to cook | 0.93 | |
| Average time to find fuel wood | 0.29 | |
| Percentage of households using traditional cooking stoves | 0.62 | |
| Percentage of households collecting water directly from the river or well | 0.25 | |
| Average time for water collection | 0.08 | |
| Dependency ratio | 0.05 | |
| Percentage of households headed by women | 0.34 | |
| Average number of household members | 0.25 | |
| Percentage of households that reported having unpaid debts | 0.19 | |
| Average time to the nearest bus station | 0.29 | |
| Average sensitivity index | 0.32 | |
| IVMS_IPCC | −0.015 | |
3. Results
In total, 476 households (out of ca. 2,159) were surveyed for this study. Of the surveyed households, 62 per cent (n = 293) had a maximum of 5 people, 32 per cent (n = 155) had between 6 and 10 people and 6 per cent (n = 27) had more than 10 people, with a maximum of 18 people (n = 7). Next, 12 interviewees (22 per cent) were between 18 and 20 years old, 191 (40 per cent) were between 21 and 35 years old and the remaining were more than 35 years old (n = 182). Most interviewees were women (n = 299; 62.8 per cent), while household leaders were mostly men (n = 313, 65.8 per cent). Most sub-indicators had very low vulnerability, ranging from 0 to 0.2 (N = 16, 34.04 per cent) and only six had very high vulnerability (ranging from 0.8 to 0.97). Access to water was not considered a concern at the municipality of Inhambane, neither the fatality of climate-associated events. Despite the reduced number of households giving or receiving support from others, the large number of households using biomass energy for daily activities and reduced land ownership are issues that raise concerns in the context of adaptation to climate change-associated events (Table III).
Statistical data on the indicators and sub-indicators used in the study
| Capital | Indicator | Sub-indicator | Units | Note | Maximum | Minimum |
|---|---|---|---|---|---|---|
| Human | Health | Average time to get to the nearest health facility | Minutes | 14.50 | 45 | 4 |
| Households indicating the existence of at least one member suffering from chronic disease | Percentage | 25.50 | 100 | 0 | ||
| Households where at least one household member has failed job or school due to illness | Percentage | 28.00 | 100 | 0 | ||
| Households where at least one member suffers from infectious or transmitted disease | Percentage | 4.60 | 100 | 0 | ||
| Households indicating that at least one member died due to weather events | Percentage | 1.50 | 100 | 0 | ||
| Households where at least one member has suffered injury due to weather events | Percentage | 13.10 | 100 | 0 | ||
| Inverse of life expectancy | 1/life expectancy | 0.02 | 1 | 0 | ||
| Food and nutrition | Average length of food insufficiency | Months | 2.75 | 6 | 0 | |
| Inverse of the crop diversification index | 1/number | 0.29 | 0.14 | 1 | ||
| Knowledge and skills | Inverse of the education index | 1/educational level | 0.02 | 1 | 0 | |
| Households that do not have television at home | Percentage | 26.30 | 100 | 0 | ||
| Households that do not have radio at home | Percentage | 33.10 | 100 | 0 | ||
| Households where no member has formal/ vocational training | Percentage | 62.30 | 100 | 0 | ||
| Social | Demography | Dependency ratio | Percentage | 0.83 | 16 | 0 |
| Women headed households headed | Percentage | 34.30 | 100 | 0 | ||
| Average number of household members | Number | 5.19 | 18 | 1 | ||
| Networks and relationships | Households who received no support in the last 12 months | Percentage | 91.40 | 100 | 0 | |
| Households that did not give any kind of support in the last 12 months | Percentage | 73.50 | 100 | 0 | ||
| Households that did not request support or assistance to government entities | Percentage | 78.10 | 100 | 0 | ||
| Respondents who did not vote in the last elections | Percentage | 18.70 | 100 | 0 | ||
| Households not affiliated to community-based organizations | Percentage | 82.30 | 100 | 0 | ||
| Physicist | Electricity | Households reporting not having access to electricity at home | Percentage | 21.20 | 100 | 0 |
| Communication | Households that have no access to phone home | Percentage | 10.30 | 100 | 0 | |
| Average time to the nearest bus station | Minutes | 00.30 | 1 | 0.02 | ||
| Sanitation | Households that have no access to latrines at home | Percentage | 35.90 | 100 | 0 | |
| Natural | Land resources | Ratio of the percentage of households that have land for agriculture and those who have not | Number | 0.45 | 1 | 0 |
| Households reporting degradation of farmland due to climatic agents | Percentage | 14.70 | 100 | 0 | ||
| Biomass/wood resources | Households using biomass energy for cooking | Percentage | 93.30 | 100 | 0 | |
| Average time to find fuelwood | Minutes | 1.72 | 6 | 0.017 | ||
| Households reporting reducing fuelwood | Percentage | 31.20 | 100 | 0 | ||
| Households using traditional stoves for cooking | Percentage | 61.60 | 100 | 0 | ||
| Water | Households reporting hearing conflicts related to water in the community | Percentage | 29.10 | 100 | 0 | |
| Households collecting water directly from the river or well | Percentage | 25.00 | 100 | 0 | ||
| Households without daily water supply | Percentage | 3.80 | 100 | 0 | ||
| Average time for water collection | Minutes | 2.15 | 15 | 1 | ||
| Inverse of the water collection and conservation index | 1/water storage | 0.00 | 1 | 0 | ||
| Climate variability and natural disasters | Average number of extreme weather events in the last 30 years | Number | 2.50 | 5.00 | 0 | |
| Mean deviation of average daily maximum temperature per month | Number | 1.93 | 3:20 | 0.6 | ||
| Mean deviation of the average daily minimum temperature per month | Number | 2.30 | 3.97 | 0.17 | ||
| Mean deviation of daily precipitation per month | Number | 38.83 | 77.19 | 00.49 | ||
| Households indicating that at least one member died due to weather events | Percentage | 1.50 | 100 | 0 | ||
| Households where at least one member has suffered injury due to weather events | Percentage | 13:10 | 100 | 0 | ||
| Financial | Assets | Inverse of land tenure index | 1/land tenure | 0.97 | 1 | 0 |
| Inverse of the diversity index of livelihoods associated with agriculture | 1/livelihood | 0.02 | 1 | 0 | ||
| Finances | Households that reported having unpaid debts | Percentage | 18.60 | 100 | 0 | |
| Households that do not have access to credit at any financial institution | Percentage | 82.40 | 100 | 0 | ||
| Households that do not have members living in other relatively more developed places | Percentage | 63.10 | 100 | 0 |
Additional results indicate that of all indicators, accessibility to health facilities (human capital) was the least vulnerable indicator (VI = 0.14, ranging from 0 to 1), followed by access to communication systems and access to electricity (physical capital, VI = 0.2 and VI = 0.21) and demography (social capital, VI = 0.21), while social networks (social capital, VI = 0.69), access to food and nutrition (human capital, VI = 0.64) and access to financial resources (financial capital, VI = 0.55) were the most vulnerable indicators (Figure 3).
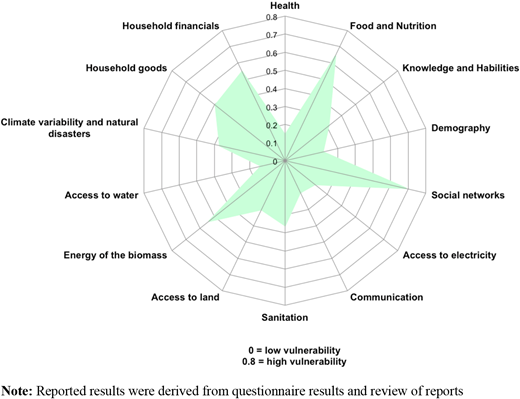
Vulnerability of the main indicators of community livelihoods at the municipality of Inhambane
Vulnerability of the main indicators of community livelihoods at the municipality of Inhambane
Following the assessment of community vulnerability in terms of variables and indicators, community vulnerability was also assessed in terms of capital that average the remaining vulnerabilities. As displayed in Figure 4, the overall community and household vulnerability at the municipality of Inhambane is very low (VI = 0.38), powered by the moderate vulnerability in terms of financial capital (VI = 0.53) and social capital (VI = 0.51) and lowered by humans (VI = 0.27) and physical capitals (VI = 0.24).
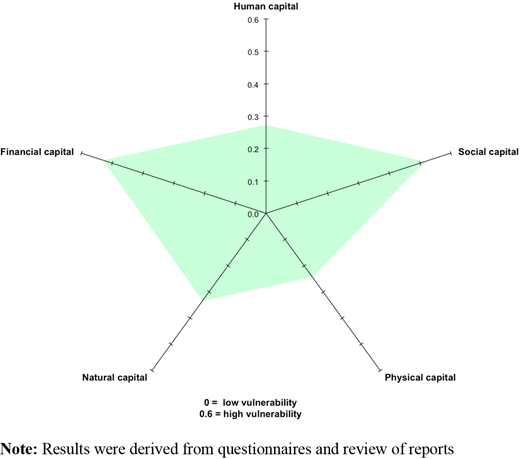
Vulnerability of the main components of the SLA at the municipality of Inhambane
Vulnerability of the main components of the SLA at the municipality of Inhambane
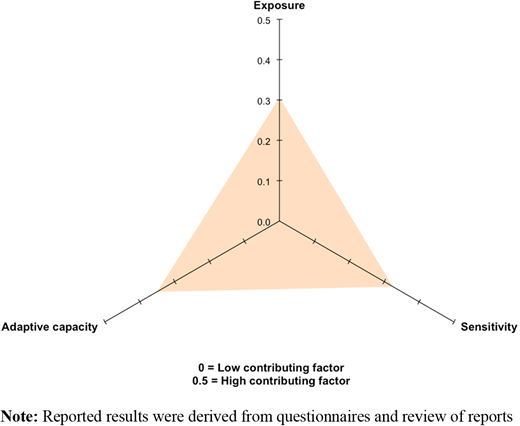
Considering the IPCC vulnerability index, the municipality of Inhambane had a moderate vulnerability to climate change (LVI-IPCC = −0.015) as a result of reduced exposure (VI = 0.3), sensitivity (VI = 0.32) and average adaptive capacity (VI = 0.35) (Figure 5). Despite having large influence of the standard deviations climatic variables, the level of community exposure was low because of the reduced number of fatalities from climatic events and adequate access to livelihood resources. On the other hand, lack of access to information, low crop diversification and reduced interest in electoral processes (measured as the number of people who voted in the past elections) were influential in the community adaptive capacity, while the amount of people using energy of the biomass for daily activities and reported food shortage were detrimental in the community sensitivity index.
4. Discussion
4.1 The overall context of livelihoods’ vulnerability
This study attempted to understand the overall context of community vulnerability to climate change and variability in Mozambique, with focus on the municipality of Inhambane. The aim was to understand livelihoods’ vulnerability at the local level, based on the balance between human, social, financial, natural and physical capitals, and to understand the context of vulnerability considering the exposure, sensitivity and adaptive capacity, with the overall goal of providing support for policy intervention toward effective adaptation. The challenges posed by climate change and variability have been extensively discussed in the academic literature, and several approaches have been identified to measure how they affect communities (Vincent, 2004; Kelly and Adger, 2000; Dolan and Walker, 2003). For coastal communities, this discussion is rather important as these areas house large number of people that rely on the resources these areas provide for their subsistence, but are also heavily affected by abrupt changes in weather conditions (Adger et al., 2005; Cinner et al., 2012).
Among several instruments, the LVI has been extensively applied in a variety of geographic contexts, scales and environments as a tool that can easily indicate community strengths and weaknesses in the context of climate changes and direct public actions toward adaptation (Hahn et al., 2009. Etwire et al., 2013; Ahsan and Warner, 2014). This paper uses the power of the LVI to understand:
the level of vulnerability based on human, social, natural, physical and financial capitals derived from the sustainable livelihoods framework; and
the overall context of livelihoods’ vulnerability to climatic events, derived from the IPCC understanding of vulnerability, that encompasses exposure, sensitivity and the adaptive capacity.
Results of this study indicate that the financial and social capital play an important role in the vulnerability context of community livelihoods at the municipality of Inhambane. This is not an isolated situation, and similarities have been reported in other coastal regions, where dependence over natural resources in poor communities reduces their ability to persist in case of disturbances. For example, lack of access to financial resources, as well as the absence of household members residing in more developed spatial realities, inhibits the community’s ability to add value and ensure greater resilience in cases of natural disasters, as communities are largely dependent on the nature resources. On the other hand, a large part of the households at the municipality of Inhambane reported not belonging to community organizations or community groups, which in turn increases their vulnerability as the social relations of mutual assistance between the family members and the remaining members of the community are almost non-existent, which in turn can limit individual and community adaptation (Adger et al., 2009) by reducing the interaction with other adaptation dimensions (Aldrich et al., 2016; Adger, 2003).
As suggested by Artur and Hilhorst (2012), everyday realities of climate change adaptation in Mozambique are an endeavor highly dependent on the cultural and political realms of societal perceptions and the sensitivity of institutions, in most cases endorsed as processes that benefit powerful rather than poor people. Considering that the adaptation process is a mixture of general and site-specific factors that contribute to vulnerability (Panthi et al., 2016), results outlined in this paper raise concerns over the adaptations possibilities at the household level. Most households at the study area rely heavily on agriculture and fisheries for subsistence (Fiege et al., 2003; Azevedo et al., 2015), and because these are climate-dependent activities, any reduction in resource availability might have severe consequences on the ability of each household to, at least, provide de daily meal (Ahsan and Warner, 2014).
4.2 Practical and decision-making implications
A central question in the assessment of community vulnerability is how to turn adaptive capacity into adaptive actions (Pelling, 2011). The relatively strong role of social capital in influencing the vulnerability of community livelihoods opens the possibility of targeting social cohesion and networks as an alternative for effective adaptation in case of natural hazards, mainly because cohesive social ties produce social norms and sanctions that facilitate trust and cooperative exchanges (Gargiulo and Benassi, 2000), thus working as fluid spheres of social interactions (Mohan and Stokke, 2000) that might contribute to the improvement of community trust, diminishment of uncertainties and enhancement of the ability to cooperate towards common goals and support (Coleman, 1990; Allen, 2006). On the other side, this study demonstrates the need to tackle food security by enhancing crop diversification in the study area. Apart from this, livelihoods’ diversification out of agriculture and fisheries can be an optimistic option that needs to be addressed in the context of poverty reduction through skill diversification, increased access to capital and critical resources (Crona and Bodin, 2010; Cinner et al., 2012).
This paper demonstrates that, in general, community livelihoods have low to moderate vulnerability, mostly influenced by year-round food insecurity in most households, reduced security of financial and household goods, large proportion of the utilization of energy from the biomass and reduced interaction between households, turning the financial and social capitals into the main sources of vulnerability at the community level. In addition, results here reported indicate that despite the fact that communities in the study area have reduced exposure and sensitivity to climate change, their coping capacity is weak, turning their overall vulnerability into moderate.
As such, it is imperative to implement effective interventions toward adaptation at the municipality of Inhambane by addressing four main strategies:
enhancement of the agricultural productivity through knowledge transfer from agricultural extensionists;
promotion of social networks and the knowledge base through educational, awareness campaigns and community associations;
improvement of the human and financial capital through the promotion of targeted training to increase the productive capacity of each sector of activity at the household and community level; and
improvement of the general conditions of accessibility (roads and transport) and sanitation (medical services) to guarantee quick access to medical and hospital care in case of emergencies.
The agricultural capacity at the municipality of Inhambane is very low (Marques et al., 2015) and largely dependent on climatic conditions (Azevedo and Campos, 2016). In agricultural surplus situations, the great challenge of the communities is the reduced or non-existent capacity of commercialization or storage of the products due to the financial incapacity and difficulties of transport for disposal. On the other hand, the low diversification of agricultural products and the small size of agricultural extension are associated factors that increase the vulnerability of households in the municipality of Inhambane. Additional training in improved agricultural technique and toward crops diversification can greatly improve household adaptive capacity. As evidenced, most households do not have training or training in some specific areas such as carpentry, civil construction and carpentry, which are extremely important not only in the context of income generation but also in the context of improving living conditions. In situations of extreme events usual at the beginning of each year, these techniques can be applied to improve the conditions of the houses, making the communities more resilient. These strategies, however, should not be considered the sole responsibility of the public sector, but as a mechanism for articulating the relationships between public management, private sector, nongovernmental organizations and communities themselves in a joint effort (Eriksen and Silva, 2009; Osbahr et al., 2010; Patt and Schröter, 2008).
5. Conclusions
This study applied a broadly applied framework to understand how community livelihoods are vulnerable to climate change and variability and the capacity at the household level to cope with these challenges. Overall, at the municipality of Inhambane, the level of vulnerability was moderate and was mostly influenced by the combined effects of lack of financial resources, reduced inter-household bonds and no ownership of land resources.
These aspects challenge the context of overall community resilience and call for the implementation of strategies that can enhance livelihoods, including the improvement community involvement in social activities that will raise community network, implementation of capacity building schemes to enable diversification from the current precipitation-dependent low-scale agriculture and fisheries into other subsistence activities and improvement of the infrastructure network to enable fast and safe access to health and educational facilities in case of emergencies.
The municipality of Inhambane is a disaster-prone environment, with frequent flooding events every year. Although this phenomenon is still not associated to fatalities, the associated damage to household and infrastructures is already high and can be expected to increase in the near future. Accounting for the current issues associated to household networks and improving household resilient through training can be an effective way to prevent additional damage and reduce the impact associated to climate events. Outcomes of this study might enable the preparation of a climate adaptation strategy at the municipality, directing efforts not only to the physical environment but also to the societal dimension of climate hazards.
This study was developed for the Centre for the Sustainable Development of the Coastal Zones in Mozambique, with funding from the Danish Cooperation Agency. Four field assistants contributed to data collection. Two anonymous reviews provided insights that significantly improved the quality of this paper. The author wishes to thank the provincial directorates of Agriculture and Fisheries, the provincial headquarters of the National Meteorological Institute and the National Institute of Statistics for making available their data. Funders had no role in study design, data collection and analysis, decision to publish or preparation of the manuscript.

