


The development of models that allows the evaluation and prediction of erosion processes is an important tool for the management and planning of coastal systems. Mangrove forests systems are under threat by the impacts of erosion, which is also intensified by human activity (and aggravated in the scenarios of global warming and climate change). The purpose of this paper is to develop a model of geographic information systems (GIS) that can be used for any estuary area, but it can also be used for mangroves.
This paper uses georeferentiation which is defined as a set of parameters that best characterize the mangrove areas: elevation (m); geomorphology; geology; land cover; anthropogenic activities; distance to the coastline (m) and maximum tidal range (m). Three different methods are used to combine the various vulnerability parameters, namely, DRASTIC index, analytical hierarchy process (AHP) and square root of the geometric mean.
The three approaches presented in this work show different types evaluating vulnerability to erosion, highlighting a stronger overvaluation of the areas presented with a high vulnerability, through the use of DRASTIC index when compared with two other approaches. The use of the AHP shows similarity to the square root of the geometric mean model, but the AHP also presents a higher percentage of vulnerable areas classified as having medium to very high vulnerability. On the other hand, the use of square root of the geometric mean led to a higher percentage of areas classified as having low and very low vulnerability.
These three qualitative models, based on a cognitive approach, using the set of parameters defined in this research, are a good tool for the spatial distribution of erosion in different mangroves in the world.
Global warming and climate change scenarios require adaptation and mitigation options supported by science-based strategies and solutions.
1. Introduction
There is uncertainty about the ways in which climate change will impact natural and human systems and the way in which society might perceive and respond to these changes (McLeman and Smit, 2006; Nicholls and Tol, 2006; Black et al., 2008; Perch-Nielsen et al., 2008; Warner et al., 2008). Certainly the livelihoods of many people around the world and some particular (ecos) systems and sectors are likely to be under increasing pressure and affected by impacts from climate change (IPCC, 2007b, 2007c). Mangrove forests cover large parts of the tropical and sub-tropical shores in the world (Spalding et al., 1997) and are among the most important and biologically most productive ecosystems as they provide important goods and services to mankind as well as marine and coastal systems. They are one of the most biologically diverse forests and are often part of a larger sea defense system (McIvor et al., 2012). These forests protect the coastline and prevent erosion, help stabilize the coastline and reduce the impact of natural disasters such as tsunamis and storms. By collecting sediment from the rivers and streams and decelerating the flow of water, forests contribute toward reducing their impact on coastal infrastructure and the risk of flooding, by buffering the energy of these incoming waters (Krauss et al., 2008; Zhang et al., 2012), and erosion (Thampanya et al., 2006). In addition, mangrove forests provide nursery and shelter for various marine pelagic species, food, medicinal products, wood fuel and construction material for local communities, and the high productivity of fisheries and significant exports of carbon fixed to coastal areas (McLeod et al., 2011).
Climate change is likely to have a substantial impact on mangrove ecosystems through processes including rise in sea levels, increase in water events, changes in ocean currents, increase in storminess, increase in temperature, changes in precipitation and increase in CO2 levels in addition to the health of the functionally linked neighboring ecosystems and human responses to climate change (Gilman et al., 2008; McKee et al., 2012; Ward et al., 2016). These factors are spatially variable and dependent on local scales [climate, geomorphology, biodiversity, forest structure, tidal range and climate change impacts (Ellison, 2015)]. The degradation of mangrove forests is a growing problem in various mangroves worldwide. Waves, tides, rivers and rainfall affect water circulation by generating turbulence and advective longitudinal mixing, trapping coastal water and influencing the rate of erosion and deposition of sediments on which mangroves grow. Important causes for this degradation are human activities such as intensive shellfish farming and cutting down of the mangroves for wood (Alongi, 2002; Field, 1995). Understanding the key processes occurring in the mangrove is important for the preservation, local management and rehabilitation (Field, 1995).
Determination of possible impacts in future must be considered against a background of natural disturbance, such as cyclones and other storms, lightning strikes, tsunami, floods, subsidence and drought (Smith et al., 1994; Gilman et al., 2008). Several studies have described the attenuation of wind and swell waves by mangroves (Burger, 2005; Brinkman, 2006). The factors known to affect the reduction in wave height as waves pass through mangroves include water depth, which is a function of topography/bathymetry and tidal phase, wave height and various aspects of the structure of mangrove trees depending on their species, age and size (Woodroffe, 2002). Some numerical models (Vo-Luong and Massel, 2008; Suzuki et al., 2012) have been used to model wave attenuation by mangroves, and the predictions of these models match observed wave attenuation reasonably well. Moreover, the roots, stems and canopies attenuate and dissipate wave energy, acting as a natural sea defense mechanism (Schiereck and Booij, 1995).
Several natural processes can promote subsidence, which are often augmented by anthropogenic reasons. This includes tectonic changes in erosional control on a river or coast, sediment compaction, changes in farming practices (e.g. irrigation), deforestation, mining, groundwater or hydrocarbon extraction and changes to coastal management such as levees or embankments (Ericson et al., 2006; Syvitski, 2008). Together these factors can result in ground subsidence or uplift/rising land or more commonly a combination of the two. Net subsidence is the combined effect of land sinking and land rising, including sedimentation. Subsidence can result in increased flooding and subsequent shoreline retreat and land loss. It can reduce the efficiency of defenses and increase salinization, affecting agriculture, having the potential to affect millions of people and many who may be in poverty (Syvitski, 2008; Syvitski et al., 2009). Rising sea levels causes similar effects, and these processes reinforce each other.
Deficiencies of precipitation over time can develop different patterns of droughts (WMO, 2011). Increases in the frequency, duration and/or severity of drought and heat stress associated with climate change could fundamentally alter the composition, structure and biogeography of forests in many regions. Of particular concern are increases in tree mortality associated with climate-induced physiological stress and interactions with other disturbances such as pest outbreaks and fire (Allen et al., 2001). Susceptibility of forest ecosystems to drought is mainly determined by site (soil texture, soil depth and water-holding capacity) and stand characteristics (i.e. leaf area, species composition and rooting depth), stand management and human pressure (Seidl et al., 2011).
Simulation studies of prediction models developed for coastal erosion are crucial for preventing the degradation of coastal ecosystems (Lewis and Nyamulinda, 1996), and integrated solutions for uncontrolled population growth and urbanization in coastal areas, poverty and economic inequality in coastal communities are urgently needed. In a global warming and climate change scenario with impacts on the infrastructure leading to population displacement require adaptation and mitigation options supported by science-based strategies and solutions. Vast literature is available on climate change, migration and displacement and environmentally displaced people, and research is available on the linkages between environmental change, livelihoods and forced migration (Kibreab, 1997; Paavola and Adger, 2006; Black et al., 2008; Warner and Laczko, 2008a) and climate change adaptation indicators and metrics (Lamari et al., 2016). Studies of climate-induced migration have in the past commonly calculated the numbers of “environmental refugees” by projecting physical climate changes, such as sea level rise or rainfall decline, on exposed population (Nicholls and Tol, 2006; Warren et al., 2006). Chances are high that many semi-arid areas will suffer a decrease in water resources owing to climate change (IPCC, 2007b, 2007c). These impacts contribute to serious erosion risk caused by environmental shocks (droughts, floods, loss of land, rising temperatures and rising sea levels) with further implications to forced population displacement and migration, increasing pressure on urban infrastructure and services and economic growth, increasing the risk of conflicts and social unrest and spreading health risks (Pelling and Hight, 2005; Barnett, 2006; Paavola and Adger, 2006; Reuveny, 2007; Wilbanks et al., 2007).
Several mathematical models have been developed and improved over the past 20 years to better understand the spatial distribution of erosion and predict the magnitude of soil loss by erosion through the use of tools that enable the assessment of soil loss, and to assist in the management of risk areas, especially in places where the soil loss has been above the sustainable limits (Lewis and Nyamulinda, 1996; Keisler and Sundell, 1997; Area et al., 1998; Angima et al., 2003; Gomes, 2007; Amorim et al., 2010; Dumas et al., 2010; Nas et al., 2010; Pereira and Coelho, 2013). These models project countless types of results in an attempt to quantify the risk and vulnerability, resulting in risk and/or vulnerability maps, due to the possibility of selecting a set of parameters that are closer to erosion reality (Boulanger and Brechet, 2005; Adger, 2006; Berkhout et al., 2006; Pereira and Coelho, 2013).
Integrated models to assess vulnerability to erosion can be useful in planning population displacement, allowing the prediction of the magnitude of soil loss by erosion and quantifying the risk and vulnerability and the impacts to environment and populations (Jones, 2001; Freeman and Kunreuther, 2002; Warner and Laczko, 2008a, 2008b; Warner et al., 2008). Cognitive approaches have been adopted to be able to better understand the spatial distribution of erosion (Amorim et al., 2010). Thus, numerous models that describe the vulnerability of coastal erosion in various parts of the world have been developed by aggregating a set of defined parameters. The combination of parameters varies from author to author, using the algorithm that best describes the global vulnerability of the study areas. Gornitz (1991) used the square root of the geometric mean for calculating the coastal vulnerability index (CVI) by applying the square root of the product of each variable divided by the number of variables. The author supports the use of square root that softens the range of values for the single use of the product of the variables, representing results closer to reality. Unlike Gornitz (1991) and Coelho et al. (2006), who used a more complex algorithm for calculating the overall vulnerability of Aveiro Coast, in which the distance of the coastline is combined with the other variables through a weighted linear combination, Rao et al. (2009) have combined various parameters of the coast of Andhra Pradesh, India, through the use of a weighted linear combination (each parameter was assigned an arbitrary weight, where the highest weights were conceived to the parameters with high importance). The evaluation of erosion tendency is required to establish the magnitude and extent of the problem to draw the attention of several entities, to identify the impacts of erosion and understand its nature and its causes and to define an appropriate approach for management and selection of projects for the establishment of technologies to mitigate/eliminate the causes of erosion. This evaluation, which includes quantifying and mapping a set of variables that contribute to the evaluation of erosion risk caused by environmental shocks (droughts, floods, loss of land, rising temperatures and rising sea levels), should be considered in the implications for forced population displacement and migration and in the resulting increase in pressure on urban infrastructure and services and economic growth, increase in the risk of conflicts and social unrest and spread of health risks.
The purpose of the model developed in this study is to spatialize the distribution of global vulnerability of coastal erosion in the region. It is a qualitative method, based on a cognitive approach, being defined by a number of factors based on literature revision (Gornitz, 1991; Gornitz et al., 1994; Edet, 2004; Coelho et al., 2006; Szlafsztein and Sterr, 2007; Rao et al., 2009). The approach developed consists of three stages:
definition of vulnerability parameters;
rating parameters over a range of values; and
combination of parameters.
This paper aims to develop a model of geographic information systems (GIS) that can be used for any estuary area, but it can also be used for mangroves, using some of the parameters defined in this paper; the same models that best suit the complexity of mangroves for determining the vulnerability of coastal erosion mangrove systems to permit planning and management of population’s displacement can also be used. It was developed a multidisciplinary approach with the appropriate information, existing and validated models. The newly developed model represents the vulnerability to erosion and is a fundamental tool for the management of these systems and further use on planning population’s displacement.
2. Research methodology
2.1 Study area
The study was conducted in the estuarine system of Cananéia-Iguape on the south coast of São Paulo, which is formed by a complex set of environments associated with barrier islands, mangroves, lagoon channels and mudflats and marshes (Besnard, 1950). This system is located in the extreme south of São Paulo coast between latitudes 24° 5′00 ″S and 25° 05′00 ″’S (Figure 1) limited in the north by Iguape, in the east by Ilha Comprida, in the west by Serra do Mar and in the south by Cananeia and Cardoso islands.
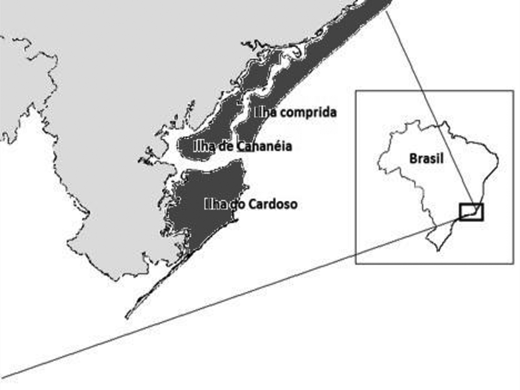
Location of the study area, the estuarine system of Cananéia-Iguape at the extreme south of the São Paulo coast, Brazil (24° 52′00 ′′S/25° 05′00 ′′S and 47°55′00 ′O/48°06′00′′O)
Location of the study area, the estuarine system of Cananéia-Iguape at the extreme south of the São Paulo coast, Brazil (24° 52′00 ′′S/25° 05′00 ′′S and 47°55′00 ′O/48°06′00′′O)
The present system is connected to the ocean in the north through a single channel (Barra de Icapara) and in the south through two channels (Barra de Cananeia and Ararapira). The municipal area covers 1,242,010 km2, and, according to BIGS (Brazilian Institute of Geography and Statistics), it has an estimated population of 12,220 habitants (2011 data). The main system channel is in the (Cananeia Sea), with a width of approximately 1 and 75 km, following parallel to Ilha Comprida and with greater depth near Barra de Cananeia (6 to 7 m) (Miyao et al., 1986).
2.2 Collecting data of vulnerability parameters
The interpretation of satellite images and aerial photography is the best way to collect data (Guebas et al., 2000; Cohen and Lara, 2003). These tools were primarily used for a large extent of land occupied by mangroves owing to the difficulty in accessibility, thus, reducing the cost to obtain data for these estuarine systems (Kairo et al., 2002). It is necessary to highlight that a source of spatial data in a large time scale allows the comparison and detection of changes in the mangroves (Guebas et al., 2000). Besides the interpretation of such images, there remains the possibility of using other tools and processes to collect data with more detail. Thus, georeferentiation that can be described as a process of associating locations of the Earth’s surface with spatial locations (Apan and Peterson, 1998) was used. Through this process, it is possible to create thematic maps or add data or information to the existing maps.
For this research, the data collected at the Water Resources Fund of São Paulo, as well as the data collected from georeferentiation, were transformed into thematic maps. Different attributes were assigned to the polygons of each parameter to create maps, through the following example: For land use, forest areas were defined as a polygon, as well as undergrowth crops, soils without covering and rural urbanization and urbanization. With this set of polygons, it was constructed a thematic map (Coelho et al., 2006).
2.3 Evaluation and ranking of vulnerability parameters
Several authors have used different types of parameters for the classification of vulnerability to erosion in coastal regions (the term parameter is used as a variable that allows comparisons). A thematic map that will also be used to calculate the vulnerability to erosion. Gornitz (1991) used the elevation, geology, geomorphology, shoreline displacement, tidal range, wave heights and erosion rates. Bryan et al. (2001) used the elevation, wave exposure, slope and aspect. Domínguez et al. (2005) used urbanization zones, scatter occupation zones, cropland zones and recreational and naturalistic zones. Coelho et al. (2006) used the elevation, distance to the coastline, maximum tidal range, maximum significant wave height, average rate of erosion/accretion, geology, geomorphology, land cover and anthropogenic activities. Owing to the great complexity of the mangroves, the approach used by Coelho et al. (2006) allows the selection of a larger number of parameters that represent the complex dynamics of estuarine systems (Ewel et al., 1998). According to Coelho et al. (2006), to consider the various parameters, there is a need to make a vulnerability rating for delimiting effects of critical areas. Based on these approaches (Gornitz, 1991; Bryan et al., 2001; Domínguez et al., 2005; Coelho et al., 2006), a set of parameters were defined that best characterize the mangrove areas: elevation (m); geomorphology; geology; land cover; anthropogenic activities; distance to the coastline (m) and maximum tidal range (m). Table I represents the set of these parameters and their assessments before the vulnerability.
Defined parameters for the study area, being each attribute of each parameter associated with a vulnerability category
| Parameter/Vulnerability | 1 – Very low | 2 – Low | 3 – Medium | 4 – High | 5 – Very high |
|---|---|---|---|---|---|
| Elevation (m) | >30 | 20-30 | 10-20 | 5-10 | <5 |
| Geomorphology | Mountains | Rocky cliffs | Saltwater marshes Mangroves Coral reefs Sheltered beaches | Floodplains Exposed beaches Estuaries | Dunes |
| Geology | Magmatic rocks | Metamorphic rocks | Sedimentary rocks | Large unconsolidated sediments | Small unconsolidated sediments |
| Land cover | Forest | Undergrowth, crops | Soil without covering | Rural urbanization | Urbanization |
| Anthropogenic activities | Interventions with maintenance structures in the coastline | Interventions without structures, but without evidence sedimentary reduction | Interventions without structures, but with evidence of sedimentary reduction | Without interventions and with no evidence of sedimentary reduction | Without interventions, but with evidence of sedimentary reduction |
| Distance to the coastline (m) | >1,000 | 200-1,000 | 50-200 | 20-50 | <20 |
| Maximum tidal range (m) | <1 | 1-2 | 2-4 | 4-6 | >6 |
The elevation reflects the susceptibility to flooding that, according to Coelho et al. (2006), differentiates the coastal areas of great slope from flat areas. Szlafsztein and Sterr (2007) explain the need to include this parameter, indicating that the lack of such data makes it difficult to quantitatively evaluate the risk of flooding and the sea level rising. It is very important to mention the existence of dunes along the coast, because these areas evidence coastal erosion, as seen in Figure 2, and the greater the elevation, the greater was the evidence of erosion. Geomorphology represents the different morphologies along the coastal region, which may be described by mountain areas, marshes, mangroves or dunes, which, according to Diez et al. (2007), is directly related to the erosion by the increase in undulation. Regarding geology, the parameter used by Gornitz (1991), Gornitz et al. (1994) and Coelho et al. (2006) allows the evaluation of the nature of the rocks and sediments of the coastal region under study, with the rock type directly connected to erosive processes. Although land use is not usually used in vulnerability ratings, this parameter was introduced to calculate the global vulnerability to erosion. Given the low socioeconomic level of the population in this region, there is a trend of disordered land use, leading to changes in land cover, through logging large areas of forests for the infrastructure development (Casasnovas et al., 2009). Soil losses are directly linked to anthropogenic activities (Lewis and Nyamulinda, 1996). Even if you use conservation practices to reduce erosion potential, soil loss rates may remain excessive (Lewis and Nyamulinda, 1996). Although some shoreline stabilization interventions are intended to reduce vulnerability, these can result in a contrary effect (Coelho et al., 2006). Vulnerability to erosion increases with proximity to the interaction zone with the sea, affecting the different land uses (Filho et al., 2006). For these reason, the distance to the coastline was used to obtain a global vulnerability map. The maximum tidal range is linked to both flooding and risk of erosion (Gornitz, 1991). Although a large tidal range dissipates wave energy, limiting the beach areas to a brief low tide period, it also defines a wide area of wetlands to be more susceptible to flooding (Gornitz, 1991). The water velocity during low tide is greater, allowing a greater movement of sediments in flood zones (Mazda et al., 1995). When the exposure index of the impact of the waves is combined with the low-lying areas, it provides a coastal vulnerability indicator (Bryan et al., 2001).
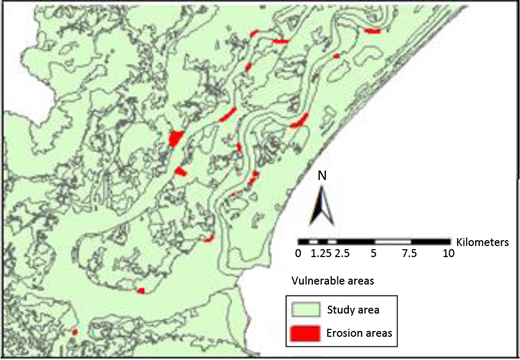
Map of georeferentiation of vulnerable areas (represents the georeferentiation maps of areas with clear signs of coastal erosion)
Map of georeferentiation of vulnerable areas (represents the georeferentiation maps of areas with clear signs of coastal erosion)
Since the parameters are in different measurement units it was necessary to classify them to allow for comparisons (Dumas et al., 2010). The rating of vulnerability ranged from 1 (very low) to 5 (very high). This can be understood in the following way: using land cover parameter as an example, the polygon (attribute) forest was replaced by 1 (very low vulnerability, for undergrowth crops by 2, soils without covering by 3, rural urbanization by 4 and urbanization by 5). This method was used for all parameters to be able to combine all the parameters. The rating of vulnerability (1 to 5) and the respective association with each parameter were carefully selected by the events and reality of the study area, as well as the methodologies used by Gornitz (1991), Gornitz et al. (1994), Bryan et al. (2001) and Coelho et al. (2006).
2.4 Selecting the algorithm to combine the vulnerability parameters
Not all algorithms represent reality just like the way it is. It is necessary to experiment various algorithms to find reliable results. At this stage, we use three different methods to combine the various vulnerability parameters.
The square root of the geometric mean used by Gornitz (1991), where x is the parameter and n is the total number of parameters, has been used:
The combination of the various parameters through this method results in a global vulnerability map of the study area.
The other method, the DRASTIC index, which assigns a defined value ranging from 1 to 7 to each parameter according to their importance level (importance scale from Edet, 2004; Jamrah and Al-Futaisi, 2008).
Through this process, the standardization of the values is possible to generate a set of weights (Table II). The weights are distributed on a scale of 0 to 1 (assigning the highest values to the parameter that causes more erosion) (Edet, 2004; Jamrah and Al-Futaisi, 2008). For elevation, as the impact is almost nil, the value 0.05 was assigned. As for land cover and anthropogenic activities, the highest values 0.24 and 0.22 were assigned, respectively. The sum of all values must be 1 (Edet, 2004; Jamrah and Al-Futaisi, 2008).
Parameters and weights by order of importance
| Parameter by order of importance | Weight |
|---|---|
| Land cover | 0.24 |
| Anthropogenic activities | 0.22 |
| Distance to the coastline (m) | 0.18 |
| Geomorphology | 0.14 |
| Geology | 0.10 |
| Maximum tidal range (m) | 0.07 |
| Elevation (m) | 0.05 |
Knowing the weight of each parameter, proceeding then to a weighted linear combination, giving each parameter a weight by multiplying them and adding the results, where X is the individual parameter and N is the assigned weight, we achieve:
Another approach for assigning weights can be achieved by using pairwise comparisons known as analytical hierarchy process (AHP). This methodology developed by Saaty (1977, 1980, 1987) involves comparing n parameters through the support of a square matrix n × n, where along the columns and the rows, the parameters are arranged by the same order (Table III).
Saaty’s matrix matrices for evaluating the relative importance of the seven criteria
| Parameters | A | B | C | D | E | F | G |
|---|---|---|---|---|---|---|---|
| A | 1 | 3 | 3 | 5 | 7 | 7 | 9 |
| B | 1/3 | 1 | 1 | 3 | 3 | 7 | 7 |
| C | 1/3 | 1 | 1 | 3 | 3 | 5 | 7 |
| D | 1/5 | 1/3 | 1/3 | 1 | 1 | 5 | 7 |
| E | 1/7 | 1/3 | 1/3 | 1 | 1 | 5 | 7 |
| F | 1/7 | 1/7 | 1/5 | 1/5 | 1/5 | 1 | 5 |
| G | 1/9 | 1/7 | 1/7 | 1/7 | 1/7 | 1/5 | 1 |
Notes: A criterion = land cover; B criterion = anthropogenic activities; C criterion = distance to the coastline; D criterion = geomorphology; E criterion = geology; F criterion = maximum tidal range; G criterion = elevation
Thus aij represents the relative importance of the parameter of the line ai relative to the parameter of the column aj. As the matrix is reciprocal, it is only necessary to examine the lower triangular part. To standardize all pairwise comparisons, Saaty (1980) proposed a comparison of the parameters supported in five values (Table IV).
Scale ranks
| Value | Definition |
|---|---|
| 1 | Equal importance |
| 3 | Weak importance |
| 5 | Essential or strong importance |
| 7 | Demonstrated importance |
| 9 | Absolute importance |
In case the parameter ai has a lower importance than the parameter aj, the inverse of the number presented by the scale (Saaty, 1980) is used. Through this process, it can be defined a set of weights for each parameter, necessary for the use of the weighted linear combinations.
3. Findings
The overall vulnerability maps were built using three different models to match the parameters of a region Figures 3-5).
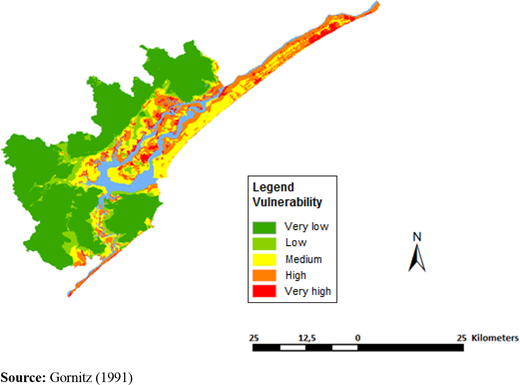
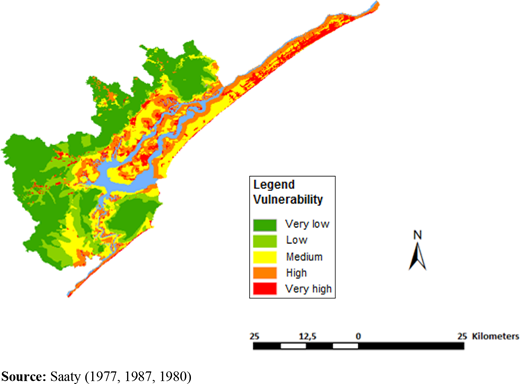
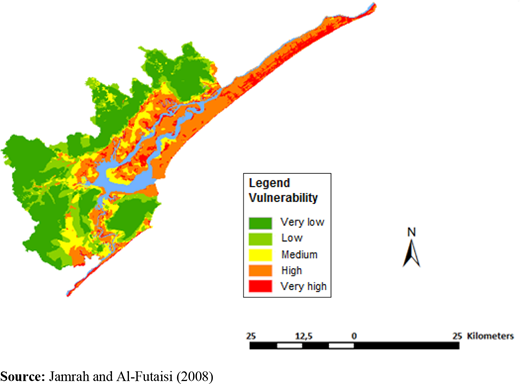
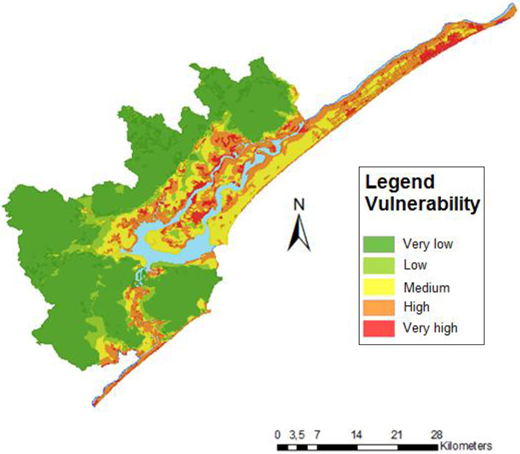
As would be expected, different algorithms have different global vulnerability results. There is a need to emphasize in these three maps the high level of very high vulnerability represented on the maps in which we used the weighted linear sum in relation to the map with the approach of the square root of the geometric mean. Another fact that stands out in the use of weighted linear combination is the over-represented areas with high vulnerability, which highlight a higher percentage for the case where we used the DRASTIC index. On the other hand, the use of the square root of the geometric mean urged higher percentage of occupied area with low and very low vulnerability. Although the use of the method based on pairwise comparisons has similarities to the model where the square root of the geometric mean was used, it represents a larger percentage of the areas with medium to very high vulnerability compared to the model of the square root of the geometric mean. These three examples show the discrepancies between the models, which may mislead the user, in case he has no knowledge about the reality of the study area.
Figure 6 groups all vulnerability maps by applying the square root of the geometric mean, resulted in the global vulnerability map of the study area.
4. Discussion
Typically, mangroves of tropical and sub-tropical regions are of great importance from the point of view of not only the resources they provide but also the protection they offer to local regions and the animal community (Mazda et al., 2002). Such forest systems have been used as a source of renewable resources (Manassrisuksi et al., 2001). But, the pressure generated with the increase in population in these regions has increased the over-exploitation of resources (Manassrisuksi et al., 2001). These pressures, combined with the natural dynamics of these systems, have been increasing the erosive processes, resulting in a decrease of the areas occupied by mangroves (Filho et al., 2006). Large parts of these forest areas eventually disappear because the balance changes between losses and sediment inputs are so critical that human intervention is necessary to help the regeneration of mangroves (Cohen and Lara, 2003; Filho et al., 2006). To adjust these changes, the identification of a set of parameters of evaluation and prediction becomes essential for determining the factors that most influence the erosion. The parameters defined and determined in this work to ascertain the coastal erosion vulnerability in mangroves proved to be suitable for the development of a model for the estuarine system of Cananéia-Iguape, São Paulo, Brazil. The multidisciplinary approach by means of adapting the study to a set of validated models for other geographical areas and different coastal systems allowed to represent the reality in the study area in a special model that represented the vulnerability to erosion, which is a fundamental tool for the management of the estuarine system of Cananeia-Iguape, São Paulo, Brazil. To evaluate the performance of erosion risk models and validate them for different conditions of soil management, it is necessary to examine and compare the results obtained with multiple studies that have been conducted in other geographical areas.
The analysis of the complex interactions that take place on a large scale and the processes taking place in the region of study is necessary to help to choose the best model to calculate the global vulnerability (Cozannet et al., 2013). The three approaches described in this study contributed to a better understanding of the spatial distribution of erosion vulnerability. Although they use the same input parameters, the results obtained following the use of different algorithms showed some significant differences, and critical thinking should be involved in choosing the best option. The use of weighted linear combination has the advantage of being able to shape the different study areas, by assigning weights (Store and Kangas, 2001). The overvaluation of parameters seemed to be an issue that needs a more detailed approach in the near future, because it has shaped the results (Pereira and Coelho, 2013). The use of the square root of the geometric mean appears to be unstable to small changes in parameters (Diez et al., 2007). The diversion of the category of one of the variables regarding the others can change the results substantially, thus representing major changes in vulnerability analysis (Diez et al., 2007).
The developed model is adequate for the analysis of the global vulnerability coastal erosion distribution, and it constitutes a valid qualitative method, based on a cognitive approach that permits the definition of vulnerability parameters, rating parameters over a range of values and the combination of parameters that best suit the complexity of mangroves for determining the vulnerability of coastal erosion. A multidisciplinary approach with appropriate information was developed by adapting the study area to a set of already existing and validated models, rendering a model that represents the vulnerability to erosion and constitutes a fundamental tool for the management of these systems (Szlafsztein and Sterr, 2007; Rao et al., 2009; Gornitz, 1991; Gornitz et al., 1994; Edet, 2004; Coelho et al., 2006).
The information provided by GIS allows various combinations that may be used to solve numerous issues involving essential spatial data to access a sustainable territorial management dynamics (Carver, 1991). The main advantage of using GIS regarding other methods is its ability to store, modify and retrieve large sets of heterogeneous data source and to represent them in a visual format (Krause et al., 2004). The use of these tools depends on the quality, availability and accuracy of the data (Krause et al., 2004). The application of GIS to quantify and mapping the set of variables that contribute to the evaluation of erosion risk due to environmental pressures (droughts, floods, loss of land, rising temperatures, and rising sea levels) is a very valuable tool. Applications in population displacement and migrations, increasing pressures on urban infrastructure and services, increasing risks of conflicts and social unrest and spreading health risks (Boulanger and Brechet, 2005) provide scientific support to decision-making.
The development of regular and continuous studies to predict the behavior of erosion and prevent the degradation of coastal ecosystems can be useful in the planning and management of population displacement mainly due to climate change impacts (Lewis and Nyamulinda, 1996; Jones, 2001; Freeman and Kunreuther, 2002, Warner and Laczko, 2008a, 2008b; Warner et al., 2008), The Intergovernmental Panel on Climate Change (IPCC, 2007a) in the Fourth Assessment Report describes six climate change scenarios including a variety of impacts such as loss of coastal lands, flooding that could displace hundreds of millions of people, extreme weather events, stress on regional water supplies and significant biodiversity loss. These impacts create both direct effects (i.e. rapid sea rise, coastal erosion and food scarcity) and indirect effects (i.e. migrations and poverty). The stress caused by climate change will exacerbate resource competition for food, water and other necessities. The application of this approach will develop a variety of new methodologies with different types of applications that not only identify the most vulnerable areas but also calculate erosion rates (Dumas et al., 2010) and can also be useful in planning population displacement (e.g., prediction of the magnitude of soil loss by erosion and quantification of the risk and vulnerability). Today the use of GIS as a spatial information processing tool and the use of a set of computational procedures that enable and facilitate analysis, representation and management of areas and phenomena that occur (Chrisman, 2001) are very common.
5. Conclusions
Simulation studies of prediction models developed for coastal erosion are crucial for preventing the degradation of coastal ecosystems. Also integrated solutions to uncontrolled population growth and urbanization in coastal areas, poverty and economic inequality in coastal communities are urgently needed. This global warming and climate change scenario, with impacts on the infrastructure, leading to population displacement, requiring adaptation and mitigation options supported by science-based strategies and solutions, and these models can be useful in planning population displacement.
Estimates of the vulnerability and integrated coastal zone management in the context of climate change adaptation should also adopt participatory monitoring measures and progress evaluation.

