


The purpose of this paper was to study the genetic variability, heritability, heat tolerance indices and phenotypic and genotypic correlation studies for traits of 250 elite International Center for Agricultural Research in the Dry Areas (ICARDA) bread wheat genotypes under high temperature in Wad Medani, Center in Sudan.
Bread wheat is an important food on a global level and is used in the form of different products. High temperature associated with climate change is considered to be a detrimental stress in the future on world wheat production. A total of 10,250 bread wheat genotypes selected from different advanced yield trials introduction from ICARDA and three checks including were grown in two sowing dates (SODs) (1st and 2nd) 1st SOD heat stress and 2nd SOD non-stress at the Gezira Research Farm, of the Agricultural Research Corporation, Wad Medani, Sudan.
An alpha lattice design with two replications was used to assess the presence of phenotypic and genotypic variations of different traits, indices for heat stress and heat tolerance for 20 top genotypes and phenotypic and genotypic correlations. Analysis of variance revealed significant differences among genotypes for all the characters. A wide range, 944-4,016 kg/ha in the first SOD and 1,192-5,120 kg/ha in the second SOD, was found in grain yield. The average yield on the first SOD is less than that of the secondnd SOD by 717.7 kg/ha, as the maximum and minimum temperatures were reduced by 3ºC each in the second SOD when compared to the first SOD of the critical stage of crop growth shown.
Similar wide ranges were found in all morpho-physiological traits studied. High heritability in a broad sense was estimated for days to heading and maturity. Moderate heritability estimates found for grain yield ranged from 44 to 63.6 per cent, biomass ranged from 37.8 to 49.1 per cent and canopy temperature (CT) after heading ranged from 44.2 to 48 per cent for the first and secondnd SODs. The top 20 genotypes are better than the better check in the two sowing dates and seven genotypes (248, 139, 143, 27, 67, 192 and 152) were produced high grain yield under both 1st SOD and 2nd SOD.
The same genotypes in addition to Imam (check) showed smaller tolerance (TOL) values, indicating that these genotypes had a smaller yield reduction under heat-stressed conditions and that they showed a higher heat stress susceptibility index (SSI). A smaller TOL and a higher SSI are favored. Both phenotypic and genotypic correlations of grain yield were positively and significantly correlated with biomass, harvest index, number of spikes/m2, number of seeds/spike and days to heading and maturity in both SODs and negatively and significantly correlated with canopy temperature before and after heading in both SODs.
Genetic variations, heritability, heat tolerance indices and correlation studies for traits of bread wheat genotypes under high temperature
Introduction
Bread wheat is adapted to many different environments, such as heat-stress conditions. In such areas, heat stress is one of the most important production challenges for wheat. The expected rising global temperature of 1-4°C over the next 50 years will have an effect on the production of wheat in the tropics through heat stress (Hansen, 2006). Heat stress affects more than 30 million hectares of wheat annually in the world and leading to significant grain yield reduction (Battisti and Naylor, 2010). High temperature is reported to decrease yields by 3 to 5 per cent per every 1°C increase above 15°C in plants under controlled conditions (Gibson and Paulsen, 1999). In addition, the effect of climate change is also evident on the quality of wheat, as increased heat results in shriveled wheat grains (Tadesse et al., 2013). To adapt new crop varieties to the future climate, we need to understand how crops respond to elevated temperatures and how tolerance to heat can be improved (Halford, 2009). Success in crop improvement generally depends on the magnitude of genetic variability and the extent to which the desirable characters are important. Germplasm evaluation will be of great significance for selection of heat-tolerant genotypes and for improving grain yield under high temperature. Thus, the objectives of the research were to study the genetic variability, heritability, heat tolerance indices and phenotypic and genotypic correlation studies for traits of 250 elite International Center for Agricultural Research in the Dry Areas (ICARDA) bread wheat genotypes under high temperature in Wad Medani, Sudan.
Materials and methods
Experimental site
The experiments were conducted twice. The first sowing date (SOD) was on 20 November 20and the second SOD was on December 12 in season (2016/17) at the Gezira Research Farm (GRF) of the Agricultural Research Corporation (ARC), Wad Medani, Sudan (latitude 14°-24´ N and longitude 29°-33´ E and 407 masl). The site of GRF is classified as heavy clay soil, with a low pH of about 8.0-8.4, low organic matter (0.05), deficient in nitrogen (380 ppm), and phosphorus (ESP, 4 ppm).
Experimental materials
Experiments were conducted using 250 genotypes selected from different advanced yield trials introduction from ICARDA, genotypes including three genotypes as checks, namely Imam, Goumria and Nebta.
Experimental design and cultural practices
Experiments were arranged in an alpha lattice design with two replications. Plots consisted of four rows, 3 m long and 0.2 m apart. Seeds were sown at the rate of 120 kg/ha. The recommended dose of fertilizer (43 kg P2 O5/ha) was applied prior to sowing, and 86 kg N/ha as urea was applied with the second and fourth irrigations. The experiments were irrigated at 10-12 days’ interval.
Measurements
Data were recorded on score (1-5), 5 = best of ground cover at full ground cover, canopy temperature (CT) measured by infrared thermometer before and after heading, chlorophyll content measured by SPAD before and after heading, days to heading and maturity, plant height, number of spikes/m2, number of seeds/spike, 1,000 seed weight, biomass, harvest index and grain yield.
Statistical analysis
The data were statistically analyzed using Genestat. Correlation figures were calculated using excel computer program and genotypic correlations were calculated using META-R.
According to Comstock and Robinson (1952), broad sense heritability (hb2) estimates for yield and the related traits were computed as the ratio of genotypic variance to phenotypic variance. h2b per cent = (σ2g/σ2p) × 100,
where h2b = broad sense heritability, σ2g = the genotypic variance and σ2p = the phenotypic variance. Genotypic variance (Vg) = σ2g = (mt - me)/r,
where mt = mean of sum of squares for genotypes, me = mean of sum of squares for error and r = number of replications:
The mean values were used for genetic analyses to determine phenotypic coefficient of variation (PCV) and genotypic coefficient of variation (GCV), according to Singh and Chaudhary (1985), using:
where σ2 p = phenotypic variation,
σ2 g = genotypic variation, and
x¯ = grand mean of the character studied
The GCV and PCV values were categorized as low (0-10 per cent), moderate (10-20 per cent) and high (20 per cent and above) values, as indicated by Burton and de vane (1953).
The genetic advance (GA) per cent method suggested by Singh and Chaudhary (1985) was calculated as K:
where:GA: genetic advance,K: constant = 2.06 at 5 per cent selection intensity,σ p: square root of phenotypic variance, and h2b: heritability.
Heat tolerance indicators
SSI = 1 − (ys/yp)/1 − (Fischer and Maurer,1978);
mean productivity (MP) = yp + ys/2 (Hossain et al., 1990);
TOL = yp − ys (Hossain et al., 1990);
stress tolerance index (STI) = yp *ys/p2y (Fernandez, 1992);
geometric mean productivity (GMP) = (Fernandez, 1992);
yield index (YI) = ys/ (Gavuzzi et al., 1997); and
yield stability index (YSI) = ys/yp (Bouslama and Schapaugh, 1984).
Sowing dates conditions (temperatures)
Compare between two SODs, as generally the mean temperature in the first SOD at a critical period of growth (from December 20 to January 20) is higher than the second SOD at a critical period (from the end of January to the end of February). The maximum and minimum temperatures were reduced by 3°C in the second SOD when compared to the first SOD of the critical stage of crop growth shown in Table I and Figure 1.
Maximum, minimum and mean temperatures (°C) of critical stage of crop growth at first and second sowing dates in season 2016/17 at GRF, wad medani, Sudan
| Critical period for the first SOD | Critical period for the second SOD | |||||||
|---|---|---|---|---|---|---|---|---|
| 21-31 December | 1-10 January | 11-20 January | Mean | 1-10 February | 11-20 February | 21-29 February | Mean | |
| Maximum | 35 | 37 | 37 | 37 | 35 | 33 | 35 | 34 |
| Minimum | 19 | 19 | 18 | 19 | 16 | 16 | 16 | 16 |
| Mean | 27 | 28 | 28 | 28 | 26 | 25 | 26 | 26 |
Results and discussion
Phenotypic variation
Yield and yield components variation.
Highly significant differences were found for yield and yield components for two SODs, except the 1,000 seed weight and the harvest index in the first SOD were found to be significantly different (Table II). These variations among genotypes for their traits reflect their different genetic backgrounds. These results were in agreement with those of Reynolds et al. (1994), Elahmadi et al. (1996), Khopra and Viswanthan (1999) and Slafer et al’s. (2005). They showed significant phenotypic variability for different traits, such as number of spikes m−2, number of grain per spike, harvest index and biomass and grain yield. Genotypes differed significantly for these traits among these experiments, indicating the presence of a sufficient genetic variability to identify the best genotypes. The maximum, minimum and mean for spikes m−2, harvest index and 1,000 seed weight were almost similar for the first and the second SODs, whereas there was a great difference between the two SODs in terms of grain yield and biomass for maximum and mean values. The maximum grain yield was 4,016 and 5,120 kg/ha , and the maximum biomass was 11,032 and 13,625 kg/ha for the first and the second SODs, respectively (Table II). This difference is due to the difference in temperature, as the second SOD is generally cooler than the first SOD.
Mean minimum and maximum values for yield and yield components of the 250 elite spring bread wheat genotypes grown in the two SODs in GRF in Wad Medani, Sudan season 2016/17
| Grain yield kg/ha | Biomass kg/ha | Harvest index % | 1,000 seed weight (g) | No. seed/spike | ||||||
|---|---|---|---|---|---|---|---|---|---|---|
| First SOD | Second SOD | First SOD | Second SOD | First SOD | Second SOD | First SOD | Second SOD | First SOD | Second SOD | |
| Maximum | 4,016 | 5,120 | 11,032 | 13,625 | 46.6 | 48.9 | 47.6 | 45 | 53 | 55 |
| Minimum | 1,057 | 1,192 | 3,193 | 3,137 | 26.1 | 23.3 | 29.6 | 28.8 | 22 | 23 |
| Mean | 2,221.6 | 2,939.3 | 6,103 | 8,287 | 36.4 | 35.5 | 36.8 | 37.4 | 35 | 39 |
| SE + | 514.5 | 531.4 | 1,302 | 1,636 | 5.2 | 4.5 | 3.9 | 3.2 | 5 | 4.6 |
| CV % | 23.2 | 18.1 | 21.3 | 19.8 | 14.3 | 12.8 | 10.7 | 8.5 | 14.7 | 11.9 |
| Sig level | *** | *** | *** | *** | * | *** | Non | *** | *** | *** |
Notes:
Sig level = significant at p < 0.005; non = non-significant
Physiological traits variations.
The maximum, minimum and mean values for score of ground cover (1-5, where 5 = best), canopy temperature (before and after heading) and chlorophyll content (before and post heading) of the 250 genotypes in the two SODs are shown in Table III. Significant differences among the tested genotypes for these physiological traits were found, and similar results for variations of these traits were found by Rahman et al. (1997) and Reynolds et al. (2007).
Mean, minimum and maximum values for physiological traits of the 250 elite spring bread wheat genotypes grown in the two SODs in GRF in wad medani, Sudan season 2016/17
| Ground cover score | CT before heading | CT after heading | Chl before heading | Chl after heading | ||||||
|---|---|---|---|---|---|---|---|---|---|---|
| First SOD | Second SOD | First SOD | Second SOD | First SOD | Second SOD | First SOD | Second SOD | First SOD | Second SOD | |
| Maximum | 4 | 4.5 | 26.4 | 29.4 | 24.6 | 23.7 | 55.2 | 53.7 | 52.5 | 54.4 |
| Minimum | 1.4 | 2.1 | 21.7 | 25.6 | 16.8 | 16.9 | 35 | 39.8 | 31.3 | 35.3 |
| Mean | 2.6 | 3.4 | 24.4 | 27.6 | 20.7 | 20.8 | 43.6 | 46.3 | 44.2 | 45.8 |
| SE + | 0.4 | 0.4 | 0.9 | 0.7 | 1 | 0.9 | 3.2 | 2.9 | 3.4 | 2.5 |
| CV % | 16.5 | 12.4 | 3.8 | 2.5 | 2.3 | 4.3 | 7.5 | 6.2 | 7.7 | 5.4 |
| Sig level | *** | *** | ** | * | *** | *** | *** | ** | *** | *** |
Notes:
CT = canopy temperature; Chl = chlorophyll content; Sig level = significant at p < 0.005
Morphological traits variations.
Highly significant genotypic differences were found for days to heading, days to maturity, plant height and number of spike/m2 (Table IV). There was a wide range of variations in these traits; days to heading ranged from 41 to 70, days to maturity ranged from 73 to 102, plant height ranged from 44 to 87 cm and the number of spike/m2 ranged from 202 to 586. This variation depends on the heat and stress tolerance levels of genotypes. A large variation in the degree of response of bread wheat to heat stress was observed for various traits, including days to heading and maturity and plant height (Elahmadi et al., 1996).
Mean, minimum and maximum values for morphological traits of the 250 elite spring bread wheat genotypes grown in the two SODs in GRF in Wad Medani, Sudan season 2016/17
| Days to heading | Days to maturity | Plant height (cm) | No. spikes/m2 | |||||
|---|---|---|---|---|---|---|---|---|
| First SOD | Second SOD | First SOD | Second SOD | First SOD | Second SOD | First SOD | Second SOD | |
| Maximum | 71 | 70 | 102 | 101 | 87 | 86 | 586 | 544 |
| Minimum | 41 | 42 | 73 | 73 | 45 | 44 | 222 | 202 |
| Mean | 55 | 52 | 87 | 86 | 64 | 67 | 386 | 429 |
| SE + | 2.8 | 2.7 | 2.8 | 3.7 | 4.7 | 7.8 | 58 | 49.7 |
| CV % | 5.2 | 5.5 | 6.1 | 4.3 | 6.5 | 11.5 | 15.1 | 11.6 |
| Sig level | *** | *** | *** | *** | *** | *** | *** | *** |
Note:
Sig level = significant at p < 0.005
Genotypic variations.
Genotypic variance, phenotypic variance, genotypic coefficient of variability (GCV), phenotypic coefficient of variability (PCV), broad-sense heritability and the genetic advance for 12 traits are presented in Tables V and VI for the first and the second SODs, respectively. Genotypic variance ranged from 944 to 4,016 kg/ha and 1,192 to 5,120 kg/ha for grain yield in the first and second SODs, respectively. The little differences between GCV and PCV observed for all the traits in the two SODs indicate that there was little influence of environmental factors on their phenotypic expression. Burton and De Vane (1953) classified PCV and GCV values as high (> 20 per cent), medium (10-20 per cent) and low (< 10 per cent). Accordingly, high PCV and GCV were observed in grain yield and biomass in the two SODs. A similar result was found by Tarekegne et al. (1994), who reported high PCV and GCV in yield and biomass. High heritability in the broad sense (h2b) was estimated for days to heading and ranged from 87.5 per cent to 70.4 per cent and days to maturity ranged from 87.5 per cent to 56.2 per cent for the first and the second SODs, respectively. The phenotypic is a good index of genotypic in these traits. Selection for the traits is also easy (Elahmadi et al., 1996). Moderate heritability estimates were found for grain yield and ranged from 44 per cent to 63.6 per cent, biomass ranged from.37.8 per cent to 49.1 per cent and canopy temperature after heading ranged from 44.2 per cent to 48 per cent for the first and the second SODs, respectively. The moderate heritability estimate for grain yield was attributed to the fact that yield was a quantitative trait that was controlled by many genes (Sidwell et al., 1976). Reynolds et al. (1997) reported sensitivity of canopy temperature to environmental fluxes along with moderate heritability in bread wheat. The GA per cent estimate for grain yield ranged from 0.6 to 3.7, biomass ranged from 1.3 to 7.3, harvest index ranged from 1.2 to 2.1, 1,000 seed weight ranged from 2.7 to 1.9, number of seed/spike ranged from 4 to 4.4, canopy temperature after heading ranged from 1.3 to 1.2 and chlorophyll content ranged from 2.1 to 2.2. In the case of the yield among various cultivars, it must be borne in mind that overall variability depends on heritable and non-heritable components; estimates of heritability and genetic advances are important preliminary steps in any breeding program, as they provide information needed in designing the most effective breeding program and the relative practicability of selection.
Genotypic (σg2) and phenotypic (σp2) variances, genotypic and phenotypic coefficient of variances, heritability in broad sense (hb2) and genetic advance (GA) for some traits in 250 bread wheat genotypes grown at the GRF season, 2016/2017 in the first SOD
| Characters | σ2p | σ2g | PCV (%) | GCV (%) | h2b (%) | GA (%) |
|---|---|---|---|---|---|---|
| Grain yield kg/ha | 473 | 208 | 30.9 | 20.5 | 44.0 | 0.6 |
| Biomass kg/ha | 2,720 | 1,030 | 27.0 | 16.6 | 37.8 | 1.3 |
| Harvest index % | 30.5 | 3.3 | 15.2 | 5.0 | 10.8 | 1.2 |
| 1,000 seed weight (g) | 20.2 | 5.8 | 12.1 | 6.5 | 28.9 | 2.7 |
| Number seed/spike | 39.2 | 12.0 | 9.8 | 17.7 | 30.7 | 4.0 |
| Ground cover score | 0.3 | 0.1 | 19.3 | 9.9 | 26.1 | 0.3 |
| CT before heading | 1.0 | 0.1 | 4.0 | 1.4 | 11.8 | 0.2 |
| CT after heading | 2.0 | 0.9 | 6.8 | 4.5 | 44.2 | 1.3 |
| Chl before heading | 14.1 | 3.4 | 8.6 | 4.2 | 24.3 | 1.9 |
| Chl after heading | 15.7 | 4.0 | 9.0 | 4.5 | 25.6 | 2.1 |
| Days to heading | 67.1 | 58.7 | 14.9 | 13.9 | 87.5 | 14.8 |
| Days to maturity | 62.1 | 54.3 | 9.1 | 8.5 | 87.5 | 14.2 |
| Plant height (cm) | 69.0 | 51.5 | 12.9 | 11.2 | 74.6 | 12.8 |
| Number spikes/m2 | 47.6 | 13.8 | 17.9 | 9.6 | 28.9 | 4.1 |
Notes:
CT = canopy temperature, Chl = chlorophyll content, σ2p = phenotypic variance, σ2g = genotypic variance, PCV = phenotypic coefficient of variance, GCV = genotypic coefficient of variance, h2b = broad sense heritability and GA = genetic advance
Genotypic (σ2g) and phenotypic (σ2p) variances, genotypic and phenotypic coefficient of variances, heritability in broad sense (h2b) and genetic advance (GA) for some traits in 250 bread wheat genotypes grown at the GRF season 2016/2017 in the second SOD
| Characters | σ2p | σ2g | PCV % | GCV % | h2b % | GA% |
|---|---|---|---|---|---|---|
| Grain yield kg/ha | 776 | 494 | 29.9 | 23.9 | 63.6 | 3.7 |
| Biomass kg/ha | 5263 | 2585 | 27.7 | 19.4 | 49.1 | 7.3 |
| Harvest index% | 25.9 | 5.2 | 14.3 | 6.4 | 19.9 | 2.1 |
| 1,000 seed weight (g) | 13.5 | 3.4 | 9.8 | 4.9 | 25.2 | 1.9 |
| Number seed/spike | 33.9 | 12.5 | 14.9 | 9.1 | 36.9 | 4.4 |
| Ground cover score | 0.2 | 0.1 | 14.2 | 7.2 | 25.8 | 0.3 |
| CT before heading | 0.52 | 0.03 | 2.62 | 0.64 | 5.90 | 0.1 |
| CT after heading | 1.5 | 0.7 | 6.0 | 4.1 | 48.0 | 1.2 |
| Chl before heading | 9.4 | 1.1 | 6.6 | 2.3 | 12.0 | 0.8 |
| Chl after heading | 9.5 | 3.3 | 6.8 | 4.0 | 34.4 | 2.2 |
| Days to heading | 27.2 | 19.2 | 10.0 | 8.4 | 70.4 | 7.6 |
| Days to maturity | 31.1 | 17.5 | 6.5 | 4.9 | 56.2 | 6.5 |
| Plant height (cm) | 78.07 | 17.87 | 13.2 | 6.3 | 22.9 | 4.2 |
| Number spikes/m2 | 33.9 | 9.2 | 13.6 | 7.1 | 27.2 | 3.3 |
Note:
CT = canopy temperature, Chl = chlorophyll content, σ2p = phenotypic variance, σ2g = genotypic variance, PCV = phenotypic coefficient of variance, GCV = genotypic coefficient of variance, h2b = broad sense heritability and GA = genetic advance
Heat tolerance indices.
Heat tolerance indices were calculated on the basis of grain yield of the top 20 genotypes in the second SOD, in addition to three varieties as checks (Table VII). The top 20 genotypes are better than the best check in the two SODs and 7 genotypes; genotype numbers 248, 139, 143, 27, 67, 192 and 152 produced high grain yield under both the first and second SODs. Similar of these genotypes numbers 192, 152, 67, 134, 27, 139, 248 in addition Imam (check) were showed smaller tolerance (TOL) values, indicating that these genotypes had a smaller yield reduction under heat-stressed conditions and they showed higher heat SSI. Nouri et al. (2011) reported that smaller TOL and higher SSI are favored. The mechanism of a smaller TOL and a higher SSI is crucial for heat TOL, especially in Sudan, as Imam (ATTILA-7), the most important variety, is still growing in Sudan. In this study, all these genotypes (seven common) follow this mechanism. A similar mechanism can use the STI to identify the best genotypes tolerant to heat and can also use STI to identify broad adapted genotypes that produce high yield under both stressed and non-stressed conditions. The higher values ofSTI were found for same (seven common) with little variation of rank.
Heat tolerance indices of the top 20 wheat genotypes under non-sowing stress (second SOD) and sowing stress (first SOD) ranking base on the top 20 genotypes in second SOD
| Rank no. | Ge no. | YP | YS | MP | TOL | GMP | YI | YSI | STI | SSI |
|---|---|---|---|---|---|---|---|---|---|---|
| 1 | 146 | 5,120 | 2,916 | 4,018 | 2,204 | 3,863.9 | 1.3 | 0.6 | 0.57 | 1.33 |
| 2 | (248) | 5,015 | 3,733 | 4,374 | 1,282 | 4,326.8 | 1.7 | 0.7 | 0.74 | 2.05 |
| 3 | 188 | 4,845 | 2,359 | 3,602 | 2,486 | 3,380.7 | 1.1 | 0.5 | 0.49 | 0.99 |
| 4 | (139) | 4,839 | 3,683 | 4,261 | 1,156 | 4,221.6 | 1.7 | 0.8 | 0.76 | 2.12 |
| 5 | 164 | 4,679 | 2,147 | 3,413 | 2,532 | 3,169.5 | 1.0 | 0.5 | 0.46 | 0.88 |
| 6 | (134) | 4,676 | 3,599 | 4,138 | 1,077 | 4,102.3 | 1.6 | 0.8 | 0.77 | 2.15 |
| 7 | 199 | 4,655 | 2,893 | 3,774 | 1,762 | 3,669.7 | 1.3 | 0.6 | 0.62 | 1.54 |
| 8 | (27) | 4,485 | 3,346 | 3,916 | 1,139 | 3,873.9 | 1.5 | 0.7 | 0.75 | 2.05 |
| 9 | 230 | 4,431 | 2,875 | 3,653 | 1,556 | 3,569.2 | 1.3 | 0.6 | 0.65 | 1.66 |
| 10 | (67) | 4,371 | 3,343 | 3,857 | 1,028 | 3,822.6 | 1.5 | 0.8 | 0.76 | 2.13 |
| 11 | 37 | 4,320 | 3,111 | 3,716 | 1,209 | 3,666.0 | 1.4 | 0.7 | 0.72 | 1.95 |
| 12 | 79 | 4,271 | 2,722 | 3,497 | 1,549 | 3,409.6 | 1.2 | 0.6 | 0.64 | 1.61 |
| 13 | 9 | 4,265 | 1,926 | 3,096 | 2,339 | 2,866.1 | 0.9 | 0.5 | 0.45 | 0.85 |
| 14 | (192) | 4,259 | 3,479 | 3,869 | 780 | 3,849.3 | 1.6 | 0.8 | 0.82 | 2.34 |
| 15 | 5 | 4,258 | 1,854 | 3,056 | 2,404 | 2,809.7 | 0.8 | 0.4 | 0.44 | 0.78 |
| 16 | 106 | 4,248 | 2,314 | 3,281 | 1,934 | 3,135.3 | 1.0 | 0.5 | 0.54 | 1.23 |
| 17 | (152) | 4,229 | 3,282 | 3,756 | 947 | 3,725.5 | 1.5 | 0.8 | 0.78 | 2.18 |
| 18 | 98 | 4,218 | 2,733 | 3,476 | 1,485 | 3,395.3 | 1.2 | 0.6 | 0.65 | 1.65 |
| 19 | 223 | 4,143 | 2,661 | 3,402 | 1,482 | 3,320.3 | 1.2 | 0.6 | 0.64 | 1.63 |
| 20 | 93 | 4,142 | 2,305 | 3,224 | 1,837 | 3,089.9 | 1.0 | 0.6 | 0.56 | 1.28 |
| 25 | Nebta (Check) | 4,057 | 2,181 | 3,119 | 1,876 | 2,974.6 | 1.0 | 0.5 | 0.54 | 1.20 |
| 22 | Goumri (Check) | 3,949 | 2,247 | 3,098 | 1,702 | 2,978.8 | 1.0 | 0.6 | 0.57 | 1.33 |
| 89 | Imam (Check) | 3,265 | 2,377 | 2,821 | 888 | 2,785.8 | 1.1 | 0.7 | 0.73 | 1.98 |
| Mean | 2,939 | 2,221 | 2,580 | 718 | 2,554.9 | 1.0 | 0.8 | 0.76 | 2.09 |
Notes:
YP = yield of genotypes under timely sowing condition, YS = yield of genotypes under heat-stress condition, MP = mean productivity, GMP = geometric mean productivity, TOL = tolerance; YI = yield index, YSI = yield stability index, STI = stress tolerance index and SSI = stress susceptibility index
Traits associations
Phenotypic and genotypic correlations.
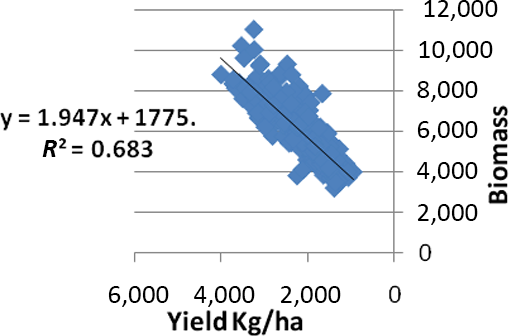
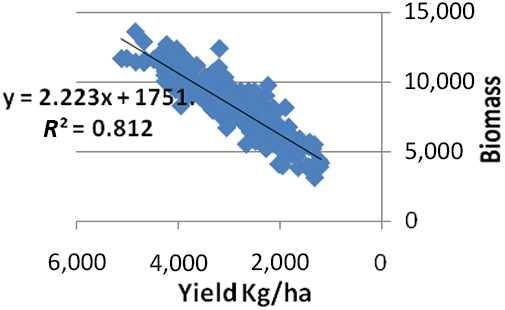
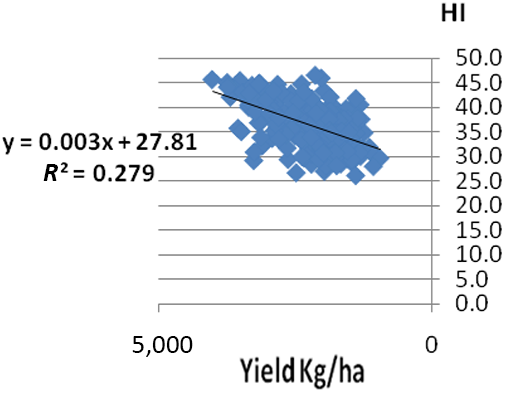
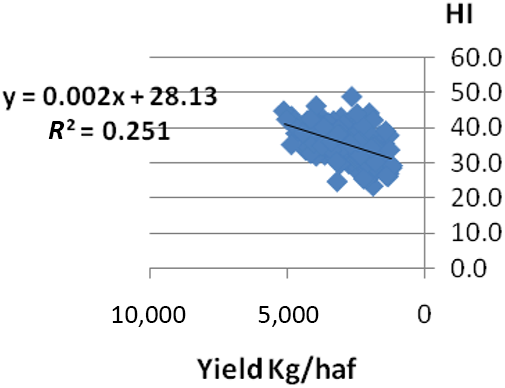
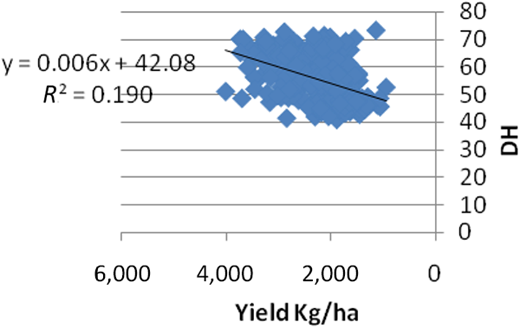
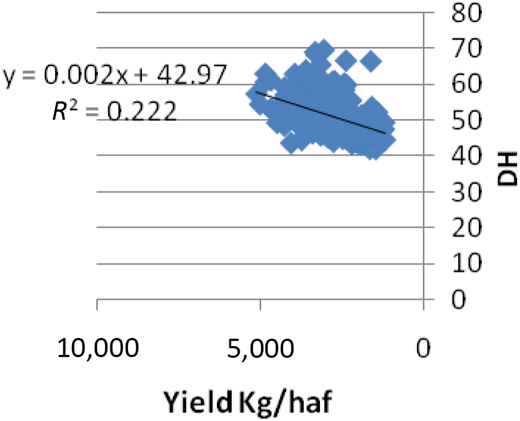
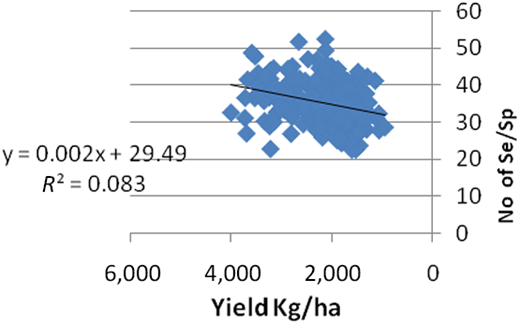
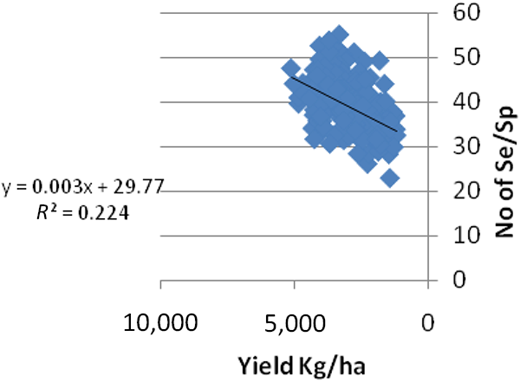
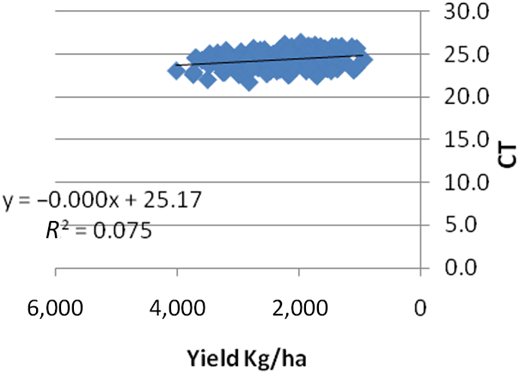
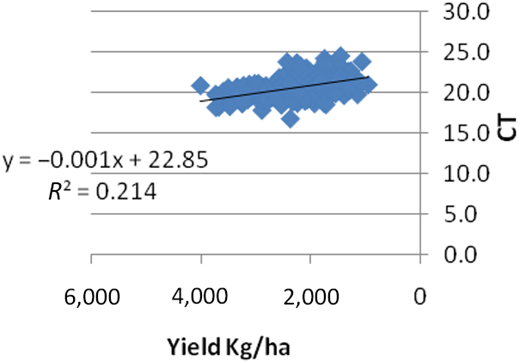
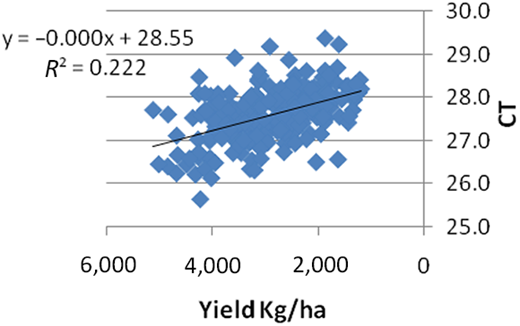
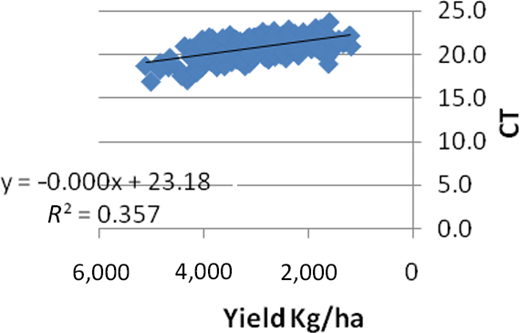
Phenotypic and genotypic correlation coefficients of grain yield and some important traits of the 250 genotypes in the first and second SODs are presented in Tables VIII and IX, respectively. Both phenotypic and genotypic correlations in grain yield were positively and significantly correlated with biomass, harvest index, number of spikes/m2, number of seeds/spike and days to heading and maturity in both the SODs. Many research workers reported similar findings; biomass, harvest index and number of spikes/m2 are significant selection criteria for yield under high-temperature conditions (Hezhong and Rajaram, 1994; Tamman et al., 2000). In addition, Narwal et al. (1999) reported that numbers of seeds/spike were positively correlated with grain yield. Figures 1-4 represented the phenotypic correlations of biomass and harvest index in the two SODs with yield, and Figures 5 and 6 represented the phenotypic correlations of days to heading with yield in the two SODs, whereas Figures 7 and 8 represented the phenotypic correlation number of seeds/spike with yield in the two SODs. Grain yield was negative and significant for phenotypic and genotypic correlations with canopy temperature at before and after heading in both the SODs (Tables VII and VIII). In addition, canopy temperature before and after heading in the two SODs was negative and significant for genotypic correlations with number of spikes/m2 and days to heading and maturity in both SODs. Canopy temperature after heading in the two SODs was negative and significant for genotypic correlations with number of seeds/spike. This result is important because the adaption of genotypes at this stage (post-heading) to high temperature leads to an increase in the number of seeds/spike and then high productivity. Reynolds et al. (1998) reported that canopy temperature showed negative correlation with yield and high values of proportion of direct response to selection. The trait is best expressed at a high vapor-pressure-deficit condition associated with low relative humidity and warm air temperature (Amani et al., 1996). Figures 9-12 represented the phenotypic correlations of canopy temperature before and after heading in the two SODs with yield.
Genotypic (bold) and phenotypic correlations among different traits of 250 genotypes grown in the first sowing date at GRF in Wad Medani, Sudan season 2016/17
| GY kg/ ha | BI kg/ ha | HI | No of SP/m2 | No of S/SP | PH | DH | DM | GFP | CT 1 | CT 2 | CHL 1 | CHL 2 | |
|---|---|---|---|---|---|---|---|---|---|---|---|---|---|
| GY kg/ha | 0.963*** | 0.909*** | 0.409*** | 0.653*** | 0.471*** | 0.588*** | 0.583*** | −0.160 | −0.803*** | −0.730*** | −0.316 | 0.222 | |
| BI kg/ha | 0.882*** | 0.716 | 0.599*** | 0.660*** | 0.672 | 0.714*** | 0.721*** | −0.125 | −0.909*** | −0.909*** | −0.333 | 0.349 | |
| HI | 0.545*** | 0.104 | −0.282 | 0.666 | −0.188 | 0.141 | 0.094 | −0.273 | −0.168 | −0.104 | −0.141 | −0.126 | |
| No of SP/m2 | 0.258*** | 0.351 | −0.086 | 0.435 | 0.477 | 0.579*** | 0.602*** | −0.056 | −0.655*** | −0.744*** | −0.471 | 0.294 | |
| No of SE/SP | 0.358*** | 0.382 | 0.117 | 0.216 | 0.670 | 0.737*** | 0.778*** | 0.115 | −0.163 | −0.694*** | −0.509 | 0.625 | |
| PH | 0.389*** | 0.521 | −0.072 | 0.325 | 0.501 | 0.852*** | 0.864*** | −0.150 | −0.480 | −0.959 | −0.468 | 0.546 | |
| DH | 0.477*** | 0.531 | 0.090 | 0.355 | 0.505 | 0.759 | 0.995 | −0.325 | −0.623*** | −0.970*** | −0.587 | 0.617 | |
| DM | 0.469*** | 0.533 | 0.065 | 0.362 | 0.534 | 0.773 | 0.982 | −0.215 | −0.647*** | −0.999*** | −0.626 | 0.637 | |
| GFP | −0.103 | −0.059 | −0.138 | −0.025 | 0.081 | −0.030 | −0.229 | −0.042 | 0.232 | 0.048 | −0.096 | 0.044 | |
| CT 1 | −0.301*** | −0.333 | −0.025 | −0.323 | −0.073 | −0.307 | −0.222 | −0.229 | −0.005 | 0.786 | 0.808 | −0.371 | |
| CT 2 | −0.492*** | −0.579 | −0.026 | −0.443 | −0.462 | −0.720 | −0.710 | −0.731 | −0.005 | 0.387 | 0.477 | −0.650 | |
| CHL 1 | −0.149 | −0.161 | −0.027 | −0.259 | −0.203 | −0.290 | −0.354 | −0.366 | −0.011 | 0.219 | 0.298 | −0.001 | |
| CHL 2 | 0.165 | 0.193 | 0.015 | 0.043 | 0.359 | 0.396 | 0.446 | 0.470 | 0.067 | −0.039 | −0.312 | 0.140 |
Notes:
GY = grain yield (kg/ha), BI = biomass (kg/ha), HI = heaviest index, No of SP/m2 = number of spikes/m2, No of SE/SP = number of seed/spike, PH = plant high (cm), DH = days to heading, DM = days to maturity, GFP = grain filing period CT 1 = canopy temperature before heading, CT 2 = canopy temperature after heading, CHL 1 = chlorophyll content before heading and CHL 2 = chlorophyll content after heading
Genotypic (bold) and phenotypic correlations among different traits of 250 genotypes grown in the second sowing date at GRF in Wad Medani, Sudan season 2016/17
| GY kg/ ha | BI kg/ ha | HI | No of SP/m2 | No of SE/SP | PH | DH | DM | GFP | CT 1 | CT 2 | CHL 1 | CHL 2 | |
|---|---|---|---|---|---|---|---|---|---|---|---|---|---|
| GY kg/ha | 0.778*** | 0.489*** | 0.640*** | 0.575*** | 0.911*** | 0.912*** | 0.9123*** | −0.359 | −0.922*** | −0.789*** | −0.436 | 0.434 | |
| BI kg/ha | 0.8636*** | −0.911 | 0.695*** | 0.764*** | 0.778*** | 0.644*** | 0.644*** | 0.044 | −0.923 | −0.833 | −0.186 | 0.414 | |
| HI | 0.4474*** | −0.0394 | −0.291 | −0.166 | −0.312 | −0.329 | −0.329 | −0.037 | 0.318 | 0.133 | 0.511 | 0.219 | |
| No of SP/m2 | −0.0643 | −0.0296 | −0.0682 | 0.016 | 0.640 | 0.763 | 0.763 | −0.178 | −0.900*** | −0.606*** | −0.229 | 0.063 | |
| No. of SE/SP | 0.297*** | 0.3554 | −0.0283 | −0.0404 | 0.575 | 0.650 | 0.650 | 0.148 | −0.919*** | −0.584*** | −0.016 | 0.680 | |
| PH | 0.3231 | 0.2856 | 0.1163 | −0.0811 | −0.0179 | 0.911 | 0.901 | −0.359 | −0.910 | −0.789 | −0.436 | 0.434 | |
| DH | 0.3406*** | 0.3991*** | −0.0224 | −0.0448 | 0.2061 | 0.2378 | 0.933 | −0.473 | −0.988*** | −0.750*** | −0.338 | 0.301 | |
| DM | 0.3921*** | 0.3932*** | 0.077 | −0.1284 | 0.2885 | 0.2711 | 0.4009 | −0.298 | −0.861*** | −0.798*** | −0.240 | 0.360 | |
| GFP | 0.4149*** | 0.4153 | 0.0803 | −0.1175 | 0.2231 | 0.2988 | 0.4195 | 0.8163 | 0.908 | −0.024 | 0.621 | 0.108 | |
| CT 1 | −0.234*** | −0.2828 | 0.0351 | −0.0551 | −0.2349 | 0.0081 | −0.1339 | −0.1418 | −0.12 | 0.901 | 0.120 | −0.405 | |
| CT 2 | −0.374*** | −0.3461 | −0.0967 | 0.0434 | −0.2183 | −0.1804 | −0.2964 | −0.3191 | −0.2924 | 0.1557 | 0.117 | −0.491 | |
| CHL 1 | −0.0503 | −0.0924 | 0.077 | 0.0987 | −0.0939 | −0.0093 | −0.0975 | −0.1422 | −0.0802 | 0.0653 | −0.0526 | 0.933 | |
| CHL 2 | 0.244*** | 0.2353 | 0.0766 | 0.104 | 0.0404 | 0.181 | 0.1927 | 0.1748 | 0.2491 | −0.1078 | −0.207 | 0.2377 |
Notes:
GY = grain yield (kg/ha), BI = biomass (kg/ha), HI = heaviest index, No of SP/m2 = number of spikes/m2, No of SE/SP = number of seed/spike, PH = plant high (cm), DH = days to heading, DM = days to maturity, GFP = grain filing period CT 1 = canopy temperature before heading, CT 2 = canopy temperature after heading, CHL 1 = chlorophyll content before heading and CHL 2 = chlorophyll content after heading
The authors would like to thank and appreciate ICARDA, especially Dr Tadesse Wuletaw (who is the supervisor of one of the authors and Dr Charles Kleinermann (Head, Capacity Development Unit at ICARDA), for their support to this study. They would also like to thank Dr Siddig Eisa (Main Supervisor at Gezira University), Prof Abu Elhassan Salih Ibarhim (Co-supervisor at Gezira University) and Dr Izzat Sid Ahmed (Co-supervisor at ARC, Sudan and Wheat Research Program Team) for their support and help.

