


In cities with high density, heat is often trapped between buildings which increases the frequency and intensity of heat events. Researchers have focused on developing strategies to mitigate the negative impacts of heat in cities. Adopting green infrastructure and cooling pavements are some of the many ways to promote thermal comfort against heat. The purpose of this study is to improve microclimate conditions and thermal comfort levels in high-density living conditions in Seoul, South Korea.
This study compares six design alternatives of an apartment complex with different paving and planting systems. It also examines the thermal outcome of the alternatives under normal and extreme heat conditions to suggest strategies to secure acceptable thermal comfort levels for the inhabitants. Each alternative is analyzed using ENVI-met, a software program that simulates microclimate conditions and thermal comfort features based on relationships among buildings, vegetation and pavements.
The results indicate that grass paving was more effective than stone paving in lowering air temperature and improving thermal comfort at the near-surface level. Coniferous trees were found to be more effective than broadleaf trees in reducing temperature. Thermal comfort levels were most improved when coniferous trees were planted in paired settings.
Landscape elements show promise for the improvement of thermal conditions because it is much easier to redesign landscape elements, such as paving or planting, than to change fixed urban elements like buildings and roads. The results identified the potential of landscape design for improving microclimate and thermal comfort in urban residential complexes.
The results contribute to the literature by examining the effect of tree species and layout on thermal comfort levels, which has been rarely investigated in previous studies.
1. Introduction
The quality of life and health of citizens around the world are increasingly threatened by climate change and urban heat islands (UHIs). Climate change is mainly attributed to human activities, such as rapid urbanization combined with high population concentrations and excessive consumption of energy (Johansson and Emmanuel, 2006; World Economic Forum, 2017). Climate change was ranked high as a global risk at the 2017 World Economic Forum, where extreme weather conditions were classified as one of the highly probable and influential threats (World Economic Forum, 2017). Annual average temperatures in urban areas have been rising continuously, exceeding those of suburban areas (Doick et al., 2014; Memon et al., 2008; Oke, 1989). UHIs are specific parts of a city, usually its center, that have higher temperatures than the surrounding areas (Oke, 1982). They are usually caused by concrete or asphalt surface conditions and human activities in urban areas (Sahana et al., 2019).
Heatwaves are often combined with UHIs and negatively affect citizens’ daily lives and health (Bokaie et al., 2019). They are largely responsible for increasing heat stress, a condition in which the human body absorbs too much heat. It is characterized by physical symptoms, such as high body temperature, dry skin and a lack of sweating and neurological symptoms, such as irritation, dizziness and difficulty breathing (Kovats and Hajat, 2008). Heat stress is closely related to thermal comfort, a subjective evaluation index of residents’ health and well-being (Singh et al., 2011) that is affected by environmental conditions, such as air temperature, wind level, solar radiation, humidity and personal factors, including metabolic rate and clothing insulation (Kim and Macdonald, 2017; Nicol, 2004). Recent studies have demonstrated that increased air temperature can not only lead to increased heat stress, but can also increase energy use for air-conditioning (Johansson and Emmanuel, 2006; Kim et al., 2018; Ndetto and Matzarakis, 2013, 2015, 2017; Ng et al., 2012; Yang et al., 2017).
Popular strategies for mitigating the negative impacts of heat on outdoor thermal conditions include controlling the albedo of building surface and road pavement materials, reconfiguring urban forms to accelerate ventilation in cities and increasing vegetation cover in urban areas (Akbari et al., 2016; Gago et al., 2013; Zhang et al., 2019). Vegetation in particular is widely favored for improving outdoor thermal conditions by modifying reflection, transmission and solar radiation absorption (Hamilton et al., 2014; Huang et al., 2009; Panferov et al., 2001). It also provides shade and evapotranspiration, thereby cooling down the surroundings (Alavipanah et al., 2015; Bowler et al., 2010; Dimoudi and Nikolopoulou, 2003; Feyisa et al., 2014; Lindén et al., 2016; Streiling and Matzarakis, 2003).
Researchers have also examined the intricate relationship between urban space, UHIs and thermal comfort. Many have combined field measurements with numerical modeling when studying UHIs. For example, Lee et al. (2010) analyze the effects of wind speed, shaded area, ground pavement and wind direction. Ng et al. (2012) and Srivanit and Hokao (2013) both reported that trees in urban areas decrease pedestrian-level air temperatures. Several have focused on the critical impacts of ventilation and shade conditions, which results from the impact of urban form on outdoor thermal comfort (Hong et al., 2011; Ng, 2009). They argue that urban design and planning without consideration of the microclimate may lead to increased heat stress and heat-related diseases (Hong et al., 2015). Studies have also found that vegetation and shading devices play a significant role in reducing the radiant heat load. They suggest that tree shading significantly contributes to cooling in warm and humid cities (Shashua-Bar and Hoffman, 2000). Others have investigated the negative aspects of vegetation because it may block wind flow or decrease wind speeds at the pedestrian level, especially in hot and humid conditions in which thermal comfort may be worsened (Emmanuel et al., 2007; Ng, 2009; Shashua-Bar and Hoffman, 2000).
Paving is another factor that is found to affect thermal comfort. Researchers have found that a cool pavement with a higher albedo can lower surface and air temperatures (Pomerantz, 2000; Santamouris, 2013). Studies report that both high-albedo paving and vegetation cover can reduce air temperature and energy demand (Sailor, 1995). Cortesão et al. (2016) compared diverse pavement materials and tree plantations and found that cool paving improves thermal comfort effectively. Shashua-Bar et al. (2011) argue that grass is more effective in reducing heat stress than pavement or bare ground, whereas Erell et al. (2014) argue that surface materials have a limited effect on thermal balance in urban areas.
Other researchers have investigated the cooling effects of various tree species. Some studies found that broadleaved species, such as Eucalyptus and Olea (Feyisa et al., 2014), Ficus and Tipuana tipu trees (Shashua-Bar and Hoffman, 2000) and Ulmus parvifolia (Lin and Lin, 2010), have a better cooling effect compared with other species. On the contrary, Leuzinger et al. (2010) found that trees with larger leaves tend to have higher crown temperatures. Overall, differences in the leaf shapes, canopy structures and thermal properties of tree species may affect their cooling efficiency. However, these studies evaluated the cooling effects of various trees focusing on temperature only; how various tree species influence people’s thermal comfort in urban areas has been insufficiently studied.
Some studies have focused on the positive effects of grass and tree planting on thermal comfort levels, which is influenced by not only by air temperature but also by factors, such as wind level, solar radiation and humidity. Trees can influence thermal comfort through the reflection, transmission and absorption of solar radiation, as well as by modifying air temperature, increasing air humidity and reducing wind speed (Streiling and Matzarakis, 2003). Additionally, previous studies have confirmed that features of tree species, such as treetop density, size and shape of leaves and tree age can attenuate solar radiation by canopy, air temperature and air humidity (Correa et al., 2012; Shashua-Bar et al., 2011).
However, a few studies have examined the effect of landscape design elements, such as tree types and planting arrangement on thermal comfort. Shahidan et al. (2010) and de Abreu-Harbich et al. (2015) studied the influence of tree species on thermal comfort in tropical or sub-tropical cities and suggested that appropriate vegetation can improve outdoor thermal comfort conditions. Focusing on planting arrangement, Milošević et al. (2017) tested the impact of tree location in street parking lots on thermal comfort and Stojaković et al. (2020) developed an approach based on the evolutionary algorithm for insulation mitigation by changing tree locations. However, previous studies have primarily focused on tree species in tropical or sub-tropical areas; thus, there is a lack of studies regarding the influence of tree species in moderate climates. In addition, although studies have focused on trees in green spaces, streets and parking lots (Bajsanski et al., 2016; Milošević, et al., 2017; Shashua-Bar and Hoffman, 2000; Stojaković et al., 2020), few studies have examined trees in residential complexes. Thus, although landscape planners design open spaces by compositing various paving materials (including grass and granite) and different types of trees (such as broadleaved and coniferous), little is known about how the proportion and layout of these landscape elements affect thermal comfort levels of residential areas in moderate climates.
The current study aims to fill this gap by examining the effects of different compositions of paving and planting in residential complexes on thermal comfort. It tests six scenarios with different grass-to-granite ratios, two tree types (broadleaves and conifers) and two planting arrangements (paired and individual). The hypothesis is that a higher proportion of grass paving, the use of coniferous trees and the pairing of trees will improve thermal comfort levels by providing more shade. The rival hypothesis is that coniferous trees and the pairing of trees worsen thermal comfort levels by decreasing air ventilation.
By focusing on an apartment complex in Seoul that is highly representative of the city’s urban landscape and development trends, two heatwave conditions are considered: a normal heatwave, such as the one that occurred in August, 2016, and an extreme heatwave, like the one which happened in August, 2018. ENVI-met, a software tool that simulates microclimate and thermal comfort conditions, was used to compare the six alternatives and to identify the most desirable design strategy to combat warming and promote thermally comfortable conditions in the city.
2. Materials and methods
2.1 Study area
Seoul, South Korea is a populous city characterized by large-scale apartment complexes which accommodate hundreds of thousands of residents. As one of the densest cities in East Asia, the city frequently experiences warming. Its annual average temperature has risen by approximately 2°C in the past 10 years (Jeong and Chung, 2017) and heatwaves are becoming stronger and more frequent (Lee, 2008). In the summer of 2018, the city’s temperature was recorded at 39.6°C, the highest ever in its history (Korea Meteorological Administration, 2019). The increase in the frequency and strength of heatwaves is reflected in the continuously increasing levels of heat-related morbidity (Korea Centers for Disease Control and Prevention, 2019). For these reasons, the planning and design of outdoor environments in Seoul’s apartment complexes remain extremely important for the perceived thermal comfort levels of directly affected residents.
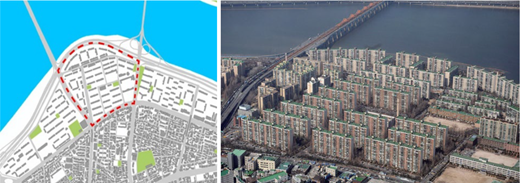
The Apgujeong apartment complex in Seoul is selected as the representative case for this research. As depicted in Figure 1, it sits at the heart of Gangnam District, where higher temperatures and UHIs are frequently observed, along the Han River. Built in 1976, it comprises 46 box-shaped buildings ranging from 14 to 16 stories and is highly typical of South Korea’s collective housing style. At over 40 years old, its renewal is actively discussed among residents and local planners and guidance is required on new designs. The authors find it highly relevant to explore strategies that would improve the microclimate conditions and outdoor thermal comfort of the complex for implementation in its future form.
2.2 ENVI-met
ENVI-met is used for modeling the six design alternatives and the resultant simulated microclimate conditions and thermal comfort. ENVI-met is a three-dimensional microclimate model based on fluid dynamics and thermodynamics, primarily used for simulating surface-plant-air interactions in urban environments (Bruse and Fleer, 1998). It permits the modeling and testing of buildings, surfaces and vegetation in various forms and sizes, as well as the specification of conditions for the atmosphere and soil. LEONARDO, a package within ENVI-met, visualizes simulation results, and BioMET, another package, carries out the evaluation of thermal comfort.
Numerous studies have used ENVI-met to simulate the micrometeorological and human-biometeorological impact of various design interventions for the urban environment, including the effects of solar irradiance, transpiration, evaporation, shading, reflection and absorbance from buildings and greeneries (Lee et al., 2016; Peng and Jim, 2013; Skelhorn et al., 2014; Wong and Jusuf, 2008). The software is well regarded by researchers for its high level of computational and modeling capacities, as well as its output, which is extremely reliable and accurate (Crank et al., 2018).
2.3 Models
A square domain comprising 245 × 245 × 20 grid cells (dx = 3.05 m; dy = 3.05 m; dz = 3.05 m) was adopted in all models. This included the existing buildings of the apartment complex and some surrounding buildings and structures. The grid cell size was selected on the basis of common practice.
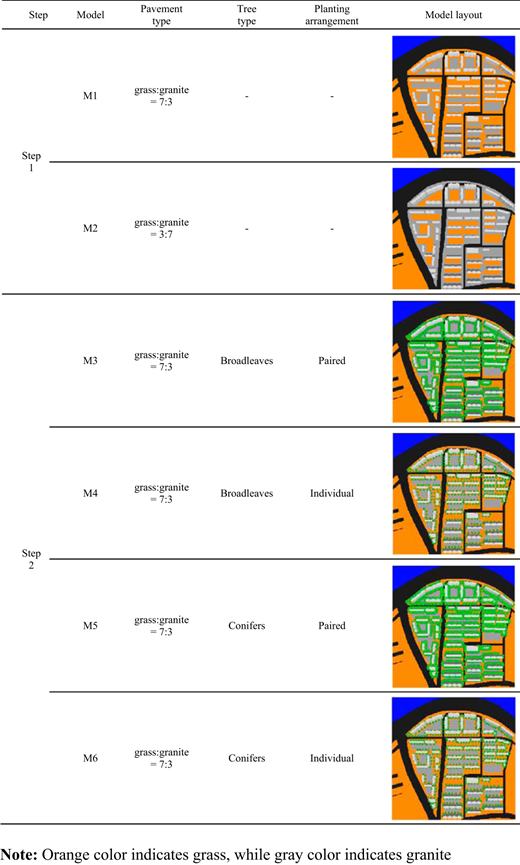
The authors adopted a two-step process to generate models for the six design alternatives and did not alter any existing buildings of the apartment complex. In Step 1, the existing asphalt pavement in the complex was replaced with various paving conditions composed of grass and granite, both of which are known to be cooler than asphalt. The, the authors established M1, the first model, which had a 7:3 grass-to-granite ratio, and M2, the second model, which had a 3:7 grass-to-granite ratio. Of the two models, M1 was considered to be more effective in decreasing near-ground temperature and improving thermal comfort.
In Step 2, the authors kept the paving conditions of M1 and incorporated various planting conditions to generate four models. M3 and M4 in Figure 2 adopted two tree types, broadleaves (e.g. maple trees) and conifers (e.g. pine trees) and two planting arrangements, paired and individual. M3 was characterized by broadleaves and paired arrangement, whereas M4 was characterized by broadleaves and individual arrangement. M5 was modeled with conifers and paired arrangement, whereas M6 had conifers and individual arrangement. Tree heights and spacing between trees were 7 and 15 m, respectively, in all four models. Figure 2 illustrates the six models developed for our simulation.
Six ENVI-met models for Apgujeong apartment complex
Notes: Orange color indicates grass, whereas gray color indicates granite.
Six ENVI-met models for Apgujeong apartment complex
Notes: Orange color indicates grass, whereas gray color indicates granite.
2.4 Simulation
To obtain reliable results, ENVI-met simulation results were compared with field measurements at the nearby Gangnam Weather Station operated by the Korea Meteorological Administration (KMA), a state-run public agency that is responsible for monitoring and forecasting local weather and climate. This validation process was carried out for 24 h on of August 1, 2018. As Figure 3 shows, a regression model based on hourly data provide an R2 value of 0.906 (p < 0.001), which is larger than or similar to those used by a number of previous ENVI-met studies, including Ghaffarianhoseini et al. (2019), Lee et al. (2016), Morakinyo et al. (2019) and Simon et al. (2018). Therefore, the value confirms a high level of agreement between the simulated results and field measurement, suggesting that the ENVI-met models are reliable for comparative evaluation of outdoor thermal conditions. In addition, the simulation models seem to underestimate temperatures in the afternoon which is common for ENVI-met models (Middel et al., 2014; Salata et al., 2016). However, differences between the two are minimal compared to those found in other studies and are not considered significant in this study.
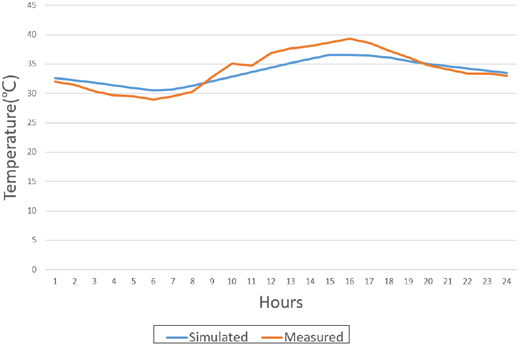
Table 1 presents the input configuration information used in the ENVI-met simulations of the six models for the normal and extreme heatwaves. August 5, 2016 was selected for the normal heatwave, having a highest temperature of 31.2°C, the average daily high temperature for the month, based on the KMA’s historical weather readings. August 1, 2018 was selected for the extreme heatwave because it was the day when the highest temperature, 39.6°C, in Seoul’s history was recorded. For wind speed and direction, the mean values of 1.6 m/s and 56.6° were applied, respectively, based on 20 years of KMA wind data, to both heatwave conditions. Relative and specific humidity levels and the solar adjustment factor, which reflects the amount of cloud cover, reflect the actual readings of the two days, which were almost identical. For soil properties and evapotranspiration of trees, the default conditions of ENVI-met were applied. Simulations were conducted from 05:00 to 17:00 for 12 h on each day to achieve thermally stable conditions. Data were collected at 1.5 m above the ground level, which corresponds to the eye level of a typical adult pedestrian, at 15:00, when the temperature was at its highest on both days.
2.5 Measures and statistical analysis
Temperature, wind speed and three thermal comfort indices – predicted mean vote (PMV), physiological equivalent temperature (PET) and universal thermal climate index (UTCI) – are the key parameters calculated for each grid cell in the six ENVI-met models. PMV, a thermal comfort model developed by Fanger (1972), is commonly used in research and industry. Its values range between −3 (cold) and +3 (hot) and the recommended comfort zone ranges between −0.5 and +0.5. PET. PMV is a universal index for evaluating thermo-physiological conditions in a given environment based on the Munich Energy Balance Model for Individuals (Mayer and Höppe, 1987). UTCI is based on a multi-node model of thermoregulation that provides an isothermal air temperature of the reference condition that would yield the same response (Jendritzky et al., 2012). It is based on thermo-physiological modeling of the human response to meteorological conditions while accounting for acclimatization. Both PET and UTCI represent effects of meteorological conditions, including short- and long-wave radiation, air temperature, relative humidity and wind speed and of thermo-physiological factors, such as internal heat production and heat transfer resistance of clothing, on humans based on human energy balance (Matzarakis et al., 2014). The three indices can be compared on the basis of the ranges of physiological stress levels, as shown in Table 2.
Ranges of thermal indices, including predicted mean vote, physiological equivalent temperature and universal thermal climate index with respect to grades of thermal perception and physiological stress
| PMV | PET (°C) | UTCI (°C) | Physiological stress |
|---|---|---|---|
| Below −3.5 | Below 4 | Below −40 | Extreme cold stress |
| – | – | −40 to −27 | Very strong cold stress |
| −3.5 to −2.5 | 4–8 | −27 to −13 | Strong cold stress |
| −2.5 to −1.5 | 8–13 | −13 to 0 | Moderate cold stress |
| −1.5 to −0.5 | 13–18 | 0–9 | Slight cold stress |
| −0.5 to 0.5 | 18–23 | 9–26 | No thermal stress |
| 0.5–1.5 | 23–29 | – | Slight heat stress |
| 1.5–2.5 | 29–35 | 26–32 | Moderate heat stress |
| 2.5–3.5 | 35–41 | 32–38 | Strong heat stress |
| – | – | 38–46 | Very strong heat stress |
| Above 3.5 | Above 41 | Above 46 | Extreme heat stress |
Notes:
For predicted mean vote, internal heat production is set to 80 W and clothing insulation at 0.9 clo.
Sources: Fanger (1972); Matzarakis and Mayer (1996); Matzarakis et al. (1999); and Zare et al. (2018). PMV = physiological equivalent temperature; PET= predicted mean vote; UTCI = universal thermal climate index
On the basis of the simulation data obtained from all the grid cells from the outdoor areas of each model at 1.5 m above the ground level, a one-way analysis of variance (ANOVA) was performed to verify statistically significant differences in temperature, wind speed and three thermal comfort values from the grid cells of each model. Pairwise t-tests with Bonferroni correction were also conducted for post hoc analysis to avoid spurious positive results.
3. Results
3.1 ENVI-met simulation results under normal heat conditions
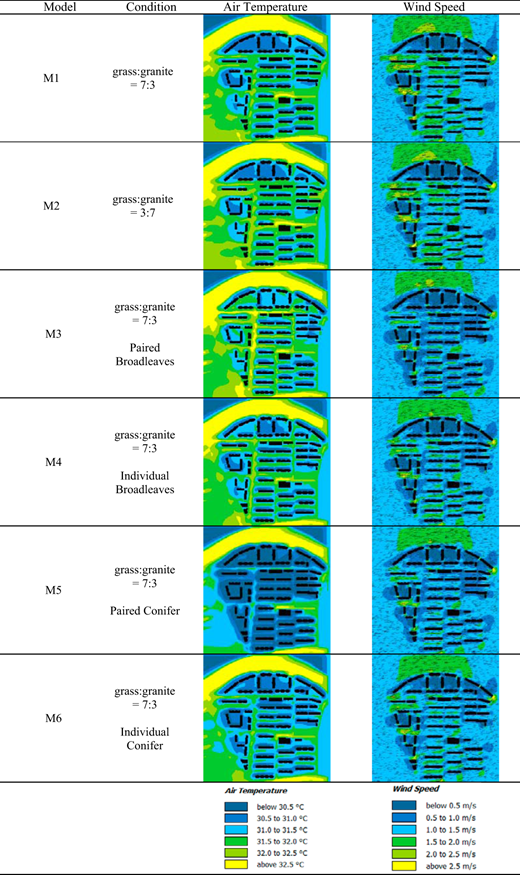
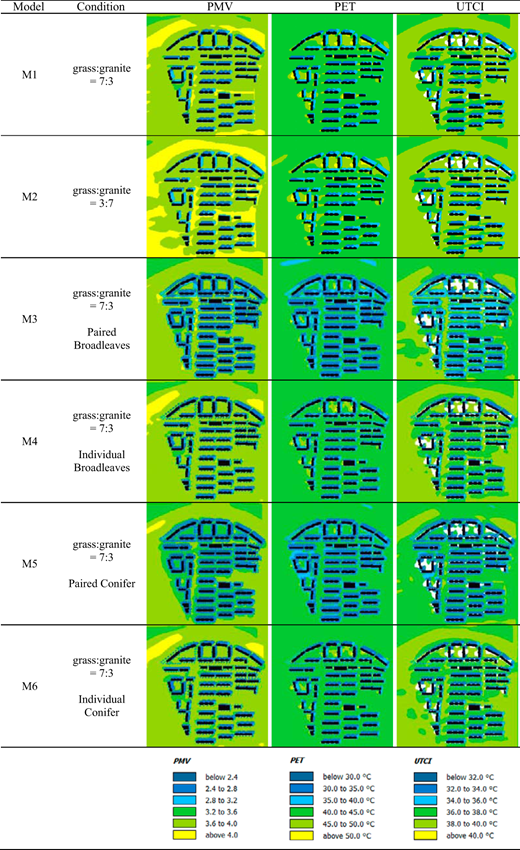
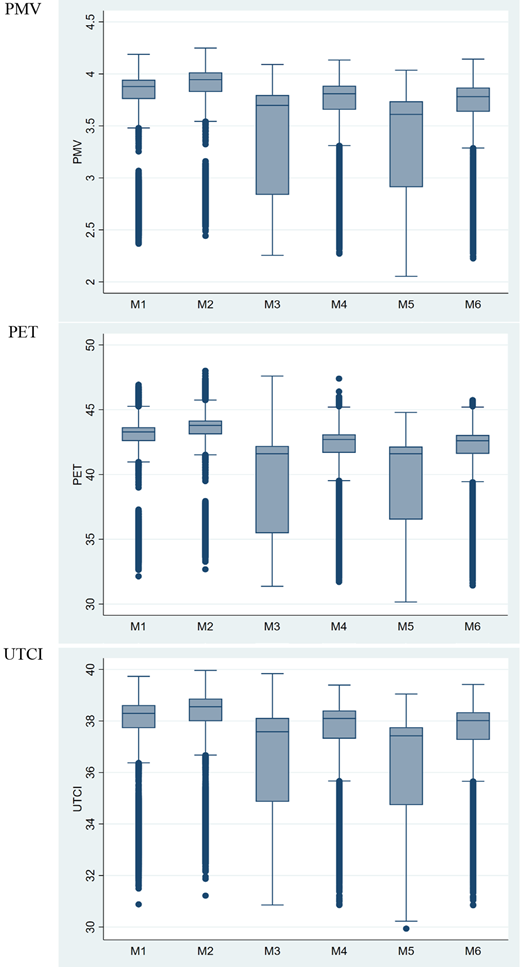
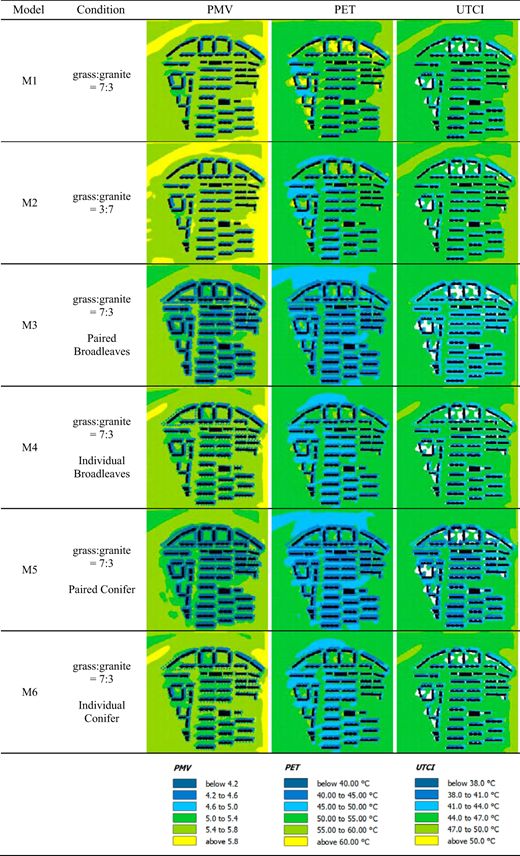
Figure 4 presents the simulation results for temperature and wind speed and Figure 5 depicts those for the three thermal comfort indices under normal heat conditions. Results of the one-way ANOVA and post hoc pairwise t-tests with Bonferroni correction for comparing the six models are depicted in Figure 6 and Table 3. All one-way ANOVA tests statistically significant differences between mean temperatures, wind speeds, PMV, PET and UTCI values. A series of pairwise t-tests with Bonferroni correction suggest significant differences between the means of all pairs except for temperature (M2 and M6; M5 and M6), wind speed (M1 and M2), PET (M4 and M6) and UTCI (M4 and M6).
Simulation results of air temperature and wind speed under normal heat conditions
Simulation results of air temperature and wind speed under normal heat conditions
Results of one-way analysis of variance test (F) and post hoc t-test with Bonferroni correction under normal heat conditions
| M1 | M2 | M3 | M4 | M5 | M6 | |
|---|---|---|---|---|---|---|
| Air temperature: | F(5, 310,821) = 5,340.97, p < 0.000 | |||||
| Mean | 31.700 | 31.815 | 31.788 | 31.677 | 31.119 | 31.535 |
| M2 | 0.115* | – | – | – | – | – |
| M3 | 0.088* | −0.027* | – | – | – | – |
| M4 | −0.023* | −0.138* | −0.111* | – | – | – |
| M5 | −0.581* | −0.696* | −0.669* | −0.558* | – | – |
| M6 | −0.165* | −0.280* | −0.253* | −0.142* | 0.416* | – |
| Wind speed: F(5, 310,821) = 1,686.72, p < 0.000 | ||||||
| Mean | 1.298 | 1.296 | 1.151 | 1.205 | 1.158 | 1.216 |
| M2 | −0.002 | – | – | – | – | – |
| M3 | −0.146* | −0.144* | – | – | – | – |
| M4 | −0.092* | −0.090* | 0.054* | – | – | – |
| M5 | −0.139* | −0.137* | 0.007* | −0.047* | − | − |
| M6 | −0.082* | −0.080* | 0.065* | 0.010* | 0.057* | − |
| PMV: F(5, 310,821) = 7,847.05, p < 0.000 | ||||||
| Mean | 3.750 | 3.820 | 3.442 | 3.638 | 3.370 | 3.621 |
| M2 | 0.070* | – | – | – | – | – |
| M3 | −0.308* | −0.377* | – | – | – | – |
| M4 | −0.112* | −0.182* | 0.196* | – | – | – |
| M5 | −0.380* | −0.450* | −0.073* | −0.269* | – | – |
| M6 | −0.129* | −0.198* | 0.179* | −0.017* | 0.252* | – |
| PET: F(5, 310,821) = 8,884.15, p < 0.000 | ||||||
| Mean | 42.435 | 42.959 | 39.871 | 41.493 | 39.733 | 41.452 |
| M2 | 0.524* | – | – | – | – | – |
| M3 | −2.564* | −3.088* | – | – | – | – |
| M4 | −0.942* | −1.466* | 1.622* | – | – | – |
| M5 | −2.702* | −3.226* | −0.138* | −1.760* | – | – |
| M6 | −0.983* | −1.507* | 1.581* | −0.041 | 1.719* | – |
| UTCI: F(5, 310,821) = 6,708.43, p < 0.000 | ||||||
| Mean | 37.785 | 38.057 | 36.808 | 37.435 | 36.388 | 37.347 |
| M2 | 0.272* | – | – | – | – | – |
| M3 | −0.978* | −1.249* | – | – | – | – |
| M4 | −0.350* | −0.622* | 0.627* | – | – | – |
| M5 | −1.397* | −1.669* | −0.419* | −1.047* | – | – |
| M6 | −0.439* | −0.710* | 0.539* | −0.088* | 0.959* | – |
Notes:
Row means – column mean; * p < 0.05. PMV = physiological equivalent temperature; PET= predicted mean vote; UTCI = universal thermal climate index
The results indicate that mean temperatures in M1 are lower than those in M2, but similar for PMV, PET and UTCI levels, suggesting that grass is more effective than granite in lowering the temperature and improving thermal comfort. However, no significant difference in wind speed is identifiable between M1 and M2 because the grass-to-granite ratio is the only parameter that differs between the two models.
The mean temperature of M3 with paired broadleaves is noticeably higher than that of M1 and M2 without trees, due to wind speed. The wind speed of M3 is the lowest in the six models. The paired broadleaves of M3 seem to decrease wind speed, leading to the trapping of hot air inside the apartment complex, resulting in higher temperatures. M5 and M6, planted with conifers, exhibit enhanced air circulation compared to M3 and M4, planted with broadleaves. The mean temperatures of M5 and M6 are also lower than those of M3 and M4.
With regard to thermal comfort, M3 and M5, with paired trees, exhibit lower levels in three thermal comfort indicators than do M4 and M6, with individually planted trees. As for the thermal comfort levels of models with paired trees (M3 and M5), M5, with conifers, is lower than M3, with broadleaves. With regard to thermal comfort levels, M3, M4, M5 and M6 have higher PMV, PET and UTCI levels than do M1 and M2, without trees. To summarize, the models with trees yield superior thermal comfort levels, indicating that trees are effective in improving comfort levels during summer heat. Moreover, conifers facilitate smoother wind circulation and perform better than do broadleaves in improving thermal comfort.
Comparing physiological stress levels under normal heat conditions, all models show moderate heat stress except for mean PET values in M1 and M2, which are indicative of strong heat stress. Planting trees can significantly reduce physiological stress in normal heat during summer in moderate climates.
3.2 ENVI-met simulation results under extreme heat conditions
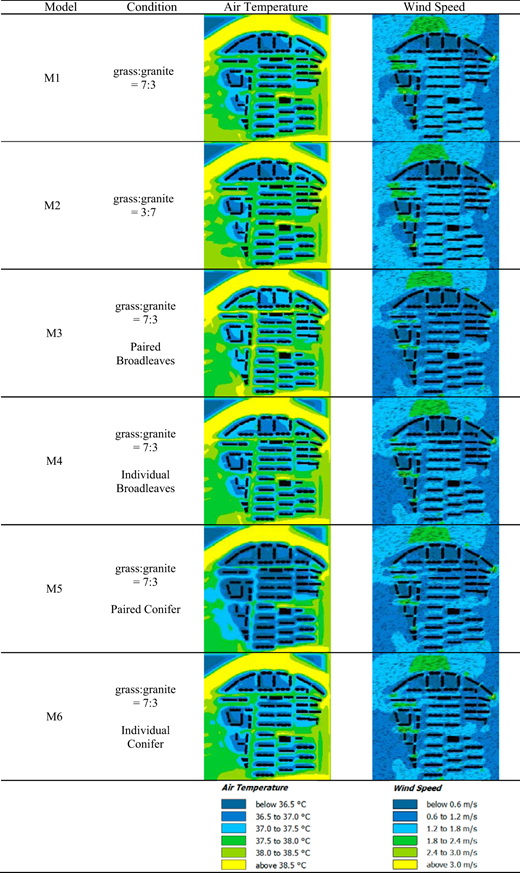
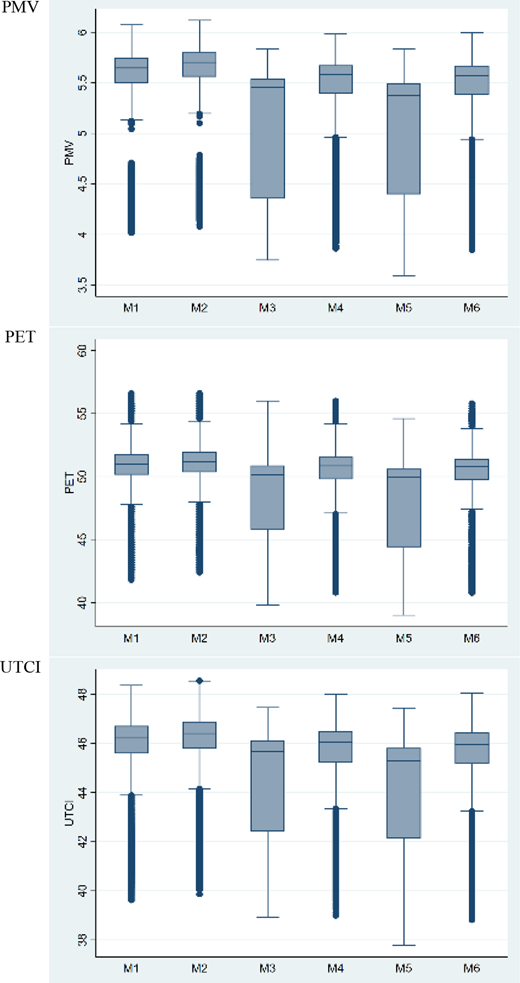
Figures 7 and 8 present the ENVI-met simulation results in extreme heat at 1.5 m above ground level. Figure 9 and Table 4 display the results of the one-way ANOVA and pairwise t-tests with Bonferroni correction. Models in extreme heat conditions exhibit significantly higher mean temperatures, wind speeds and PMV, PET and UTCI values than do models in normal heat conditions. The one-way ANOVA tests for models in extreme heat reveal statistically significant differences in mean temperatures, wind speeds and PMV, PET and UTCI levels. Post hoc pairwise t-tests with Bonferroni correction present significant differences between models under extreme heat except in three cases: wind speed (M1 and M2), PET (M4 and M6) and UTCI (M4 and M6).
Simulation results of air temperature and wind speed under extreme heat conditions
Simulation results of air temperature and wind speed under extreme heat conditions
Results of one-way analysis of variance test (F) and post hoc t-test with Bonferroni correction under extreme heat conditions
| M1 | M2 | M3 | M4 | M5 | M6 | |
|---|---|---|---|---|---|---|
| Air temperature: F(5, 311,242) = 252.09, p < 0.000 | ||||||
| Mean | 37.813 | 37.867 | 37.882 | 37.817 | 37.818 | 37.735 |
| M2 | 0.054* | — | – | – | – | – |
| M3 | 0.069* | 0.015* | – | – | – | – |
| M4 | 0.004 | −0.050* | −0.064* | – | – | – |
| M5 | 0.005 | −0.049* | −0.064* | 0.001 | – | – |
| M6 | −0.078* | −0.133* | −0.147* | −0.083* | −0.084* | – |
| Wind speed: F(5, 311,242) = 1,019.76, p < 0.000 | ||||||
| Mean | 1.284 | 1.282 | 1.165 | 1.218 | 1.180 | 1.229 |
| M2 | −0.002 | – | – | – | – | – |
| M3 | −0.119* | −0.117* | – | – | – | – |
| M4 | −0.066* | −0.063* | 0.054* | – | – | – |
| M5 | −0.104* | −0.102* | 0.015* | −0.039* | – | – |
| M6 | −0.055* | −0.053* | 0.064* | 0.010* | 0.049* | – |
| PMV: F(5, 311,242) = 8,897.97, p < 0.000 | ||||||
| Mean | 5.531 | 5.590 | 5.133 | 5.398 | 5.063 | 5.396 |
| M2 | 0.059* | – | – | – | – | – |
| M3 | −0.399* | −0.458* | – | – | – | – |
| M4 | −0.133* | −0.192* | 0.266* | – | – | – |
| M5 | −0.469* | −0.528* | −0.070* | −0.336* | – | – |
| M6 | −0.135* | −0.194* | 0.263* | −0.002 | 0.333* | – |
| PET: F(5, 311,242) = 6,092.93, p < 0.000 | ||||||
| Mean | 50.606 | 50.852 | 48.570 | 50.030 | 48.205 | 49.986 |
| M2 | 0.246* | – | – | – | – | – |
| M3 | −2.036* | −2.282* | – | – | – | – |
| M4 | −0.576* | −0.822* | 1.460* | – | – | – |
| M5 | −2.401* | −2.647* | −0.365* | −1.825* | – | – |
| M6 | −0.620* | −0.866* | 1.416* | −0.044 | 1.781* | – |
| UTCI: F(5, 311,242) = 6,804.27, p < 0.000 | ||||||
| Mean | 45.873 | 46.072 | 44.737 | 45.489 | 44.312 | 45.431 |
| M2 | 0.200* | – | – | – | – | – |
| M3 | −1.136* | −1.336* | – | – | – | – |
| M4 | −0.384* | −0.584* | 0.752* | – | – | – |
| M5 | −1.561* | −1.760* | −0.425* | −1.177* | – | – |
| M6 | −0.441* | −0.641* | 0.695* | −0.057* | 1.119* | – |
Notes:
Row means – column mean; * p < 0.05. PMV = physiological equivalent temperature; PET= predicted mean vote; UTCI = universal thermal climate index
M1 exhibits lower temperatures and thermal comfort levels than M2 does, although the difference is not large when compared with normal heat conditions. The differences in temperature and thermal comfort levels between models with trees (M3, M4, M5 and M6) are also reduced when compared with models in normal heat. Of the four models, M5, with paired conifers, has the lowest temperature and thermal comfort levels. The wind speed trend is similar in general to that under normal heat conditions, although there are a few differences.
Physiological stress levels under extreme heat conditions indicate extreme heat stress except in the mean UTCI values for M5. Furthermore, when the average thermal comfort levels are compared under the two scenarios, the differences between the models are generally lower under extreme heat than those under normal heat. This corresponds with the ENVI-met simulation results and confirms that the effects of paving and planting on thermal comfort in all models under extreme heatwave are reduced.
4. Discussion
The authors investigated the effects of paving and planting on air temperature, wind speed and thermal comfort levels in an apartment complex in Seoul, South Korea, under normal heatwave and extreme heatwave conditions. ENVI-met simulations were used to identify the effects of six models with various paving and planting conditions. In sum, the differences in thermal comfort levels between models decreased as the heatwave intensity increased. A comparison of models without trees (M1 and M2) and models with trees (M3, M4, M5 and M6) indicates a significant decrease in thermal comfort under extreme heatwave conditions than under normal heatwave conditions. The results suggest that the effects of paving and planting on thermal comfort under extreme heatwave conditions decrease significantly.
Despite differences in thermal comfort levels of models based on heat levels, the overall thermal comfort pattern was similar under both heat conditions. M1 and M2, which solely considered paving, showed lower levels of thermal comfort than did M3, M4, M5 and M6, which promoted planting efforts. Thus, planting of trees may decrease heat stress and increase thermal comfort levels more effectively.
With regard to paving materials, M2 exhibited higher levels of PMV, PET and UTCI than did M1 under both conditions, suggesting that grass is more effective than granite for lowering temperature and improving thermal comfort. Thermal comfort levels can be improved when trees are planted in pairs, regardless of leaf shape. Because paired planting requires a higher number of trees than individual planting does, it can be said that increased green area is more effective in improving thermal comfort levels.
Finally, with regard to the leaf shape, coniferous trees were found to be better at reducing temperature and improving heat comfort than broadleaved trees. Coniferous trees seem to facilitate wind circulation between apartment buildings more than broadleaved trees do because of the narrower shape of their leaves. A decrease in temperature could be due to the facilitated wind circulation between apartment buildings, resulting in improved thermal comfort in the case of Seoul. A balance between good ventilation and sufficient shade is needed.
5. Concluding remarks
Our findings confirm that grass is more effective than granite in improving thermal comfort levels. Planting trees can improve thermal comfort levels effectively. These results generally agree with previous studies that empirically studied the effects of paving materials, shading and ventilation (Alavipanah et al., 2015; Bowler et al., 2010; Dimoudi and Nikolopoulou, 2003; Feyisa et al., 2014; Lindén et al., 2016; Oliveira et al., 2011; Streiling and Matzarakis, 2003). However, our results contribute to the literature by examining the effect of tree species and layout on thermal comfort levels of a residential complex in a moderate climate, which has been rarely investigated in previous studies. These results confirm previous studies’ findings that trees with thicker branches and leaves as well as clustered trees contribute to filtering solar radiation, thereby improving thermal comfort (Shahidan et al., 2010; de Abreu-Harbich et al., 2015). However, this study determined that permeability of the tree canopy is another important factor that can affect thermal comfort. Although broadleaves can filter solar radiation better than conifers, there may be a tradeoff effect in terms of thermal comfort because trees with dense canopies tend to decrease wind circulation. This implies that landscape designers need to consider the permeability of the tree canopy along with other tree features when planting for residential complexes to improve thermal comfort. The results also indicate an overall decrease in the differences in thermal comfort level for all six models under extreme heatwave conditions. This may suggest that designing outdoor environments of large apartment complexes should consider incorporating cooling elements other than paving and planting.
Current design practice in South Korea, as in many other parts of the world, does not use microclimate conditions or thermal comfort levels as key drivers of major decision-making. Moreover, new approaches to landscape design practice that deal with the micro-level physical elements of outdoor open spaces are required because extreme heatwaves in summer are expected to be more likely and frequent. Landscape elements show promise for the improvement of thermal conditions because it is much faster and easier to redesign landscape elements, such as paving or planting, than to change fixed urban elements like buildings and roads. The present results identified the potential of landscape design for improving microclimate and thermal comfort in urban residential complexes. This implies that paving and planting, which are capable of decreasing surface temperatures and increasing thermal comfort levels, should be included in open space designs. The choice of tree species and layout of trees should be made in consideration of wind circulation and shading in open spaces to mitigate UHI. Approaches at the city-wide level may be adopted to cope with the densification and expansion of cities.
Certain limitations are applicable to this study. First, it investigated only a single apartment complex in Seoul, which may limit the external validity of the findings for generalization or future application. Second, because input parameters for ENVI-met simulations were obtained from a nearby weather station, these models may not fully reflect the actual microclimate and thermal conditions of the apartment complex. Third, the thermal influences of a large body of water located in the north of the study site may not have been fully accounted for in the ENVI-met models. Fourth, this study demonstrated that coniferous trees may be more effective in improving thermal comfort levels by facilitating wind circulation during summer. However, faster winds may negatively affect thermal comfort during the winter. Thus, future studies of winter conditions may provide a more thorough understanding of the impact of coniferous trees. Finally, further study of diverse planting arrangements should provide additional policy implications for landscape design.
However, this study does make important contributions to local design practice and policy. It presents tangible design solutions for a specific project that is highly representative of Seoul’s residential development in temperate climate. Also, its results shed light on tradeoff effect of dense tree planting that provides shade but discourages wind circulation. These findings can contribute to an adaptation strategy against the city’s UHIs and may provide lessons for those in other regions or countries with similar issues.
This research was supported by a grant (2017R1D1A1B03032234) of the Basic Science Research Program through the National Research Foundation of Korea (NRF) funded by the Ministry of Education.

