

The purpose of this study is to assess the spatiotemporal patterns of future meteorological drought in the Yellow River Basin under different representative concentration pathway (RCP) scenarios.
Delta method is used to process the future climate data of the global climate models, then analyzed the spatiotemporal variation trend of drought in the Yellow River Basin based on standardized precipitation evaporation index (SPEI) under four RCP scenarios.
This research was funded by the National Natural Science Foundation of China (41901239), Soft Science Research Project of Henan Province (212400410077, 192400410085), the National Key Research and Development Program of China (2016YFA0602703), China Postdoctoral Science Foundation (2018M640670) and the special fund of top talents in Henan Agricultural University (30501031).
This study can provide support for future meteorological drought management and prevention in the Yellow River Basin and provide a theoretical basis for water resources management.
1. Introduction
The continuous rise in global temperature has accelerated the global water cycle, resulting in the redistribution of regional water resources (Yan et al., 2020; Ji et al., 2021a, 2021b) and exacerbated the probability and frequency of extreme hydrological events, such as drought disaster. Drought disaster has become one of the most severe climate disasters affecting human society. In addition, drought also has a huge impact on agriculture, livestock and forestry, which is harmful to food production, animal husbandry production and forestry production. It is also a research hotspot in the field of climatology and hydrology. The Yellow River Basin, which is in arid and semi-arid regions, is the most severe area affected by droughts in China. In recent years, droughts have shown an intensified and continuous trend, which has severely affected the production, life and ecology of the region (Wang et al., 2018a). Qin et al. (2012) believe that the occurrence of drought disasters is regular. Therefore, evaluating and predicting the development trend of drought disasters in the Yellow River Basin will facilitate in-depth research and prediction of the changing laws and trends of water resources in the region (Shao et al., 2006).
Many scholars have done a lot of work on the drought in the Yellow River Basin (She et al., 2013; Zhang et al., 2013; Ma et al., 2016; Zhu et al., 2018; Wang et al., 2018a). Zhu et al. (2015) introduced a nonparametric multivariate standardized drought index (NMSDI) that integrates rainfall and runoff information and applied this method to study the drought characteristics of the Yellow River Basin. It was found that NMSDI all showed a downward trend on the seasonal and annual scales during 1952–2012. Huang et al. (2015a) adopted an NMSDI to study the spatiotemporal variation characteristics of the occurrence structure of drought in the Yellow River Basin. The results show that, on the whole, the drought structure in the Yellow River Basin remained stable during the period of drought duration, beginning and ending transition, and there is no obvious change trend. Huang et al. (2015b) established the comprehensive drought index of the Yellow River Basin by using the theory of fuzzy set, analyzed the spatiotemporal characteristics of drought. The results show that, in space, the risk of drought in the middle reaches is higher than that in other regions of the Yellow River Basin, and in different seasons, the risk of drought in spring and winter is higher than that in other quarters; in general, the drought index of the basin is dominated by an insignificant decreasing trend. Wang et al. (2018b) combined monthly normalized difference vegetation index and ground temperature data of moderate-resolution imaging spectroradiometer in the Yellow River Basin to calculate five remote sensing drought indexes (RSDI) and discussed the spatiotemporal variation characteristics of meteorological drought in 2000–2015. The results showed that the RSDI of the Yellow River Basin decreased in the period of 2000–2015 except winter, but the changing trend of the drought was different in different seasons. Wang et al. (2019a) used the remote sensing data to calculate the grid standardized precipitation evapotranspiration index (GSPEI) for evaluating the drought characteristics of the Yellow River Basin from 1998 to 2016. The results show that the drought severity of the Yellow River Basin is the highest in summer from 1998 to 2016, followed by spring, autumn and winter, with an average GSPEI of –1.51, –0.09, 0.30 and 1.33, respectively. In addition, the drought showed an upward trend in March, May, August and October, whereas the drought on the seasonal and annual scales showed a downward trend. Wang et al. (2019b) used SPEI as the drought index to quantitatively explore the temporal evolution, spatial pattern and trend characteristics of drought in the Yellow River Basin from 1961 to 2015. The results showed that there was no significant upward trend of drought from 1961 to 2015, and the drought became worse after 1990s; the months and seasons with the most severe drought are June and summer, respectively, with an average SPEI of –0.94 and –0.70, respectively, and the seasons of increasing drought trend are spring, summer and autumn. However, the spatiotemporal patterns of future meteorological drought in the Yellow River Basin under different representative concentration pathway (RCP) scenarios are rarely involved.
The purpose of this study is to assess the spatiotemporal patterns of future meteorological drought in the Yellow River Basin under different RCP scenarios. First, the Delta method was used to process the global climate model data, then the spatiotemporal variation of future meteorological drought in the Yellow River Basin based on SPEI under four RCP scenarios was analyzed from inter-annual variation and drought frequency. This study can provide support for future meteorological drought management and prevention in the Yellow River Basin and provide a theoretical basis for water resources management.
2. Study area, data and methods
2.1 Study area
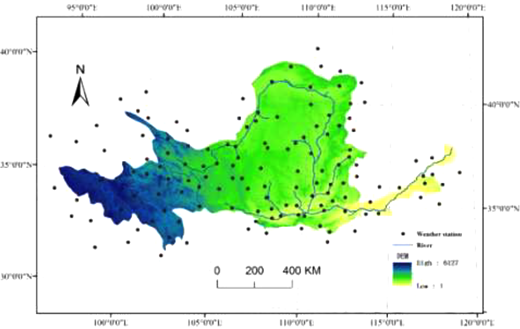
The geographical range of the Yellow River Basin is 95°53′–119°05′ E, 32°10′–41°50′ N (Figure 1). It originates from the Bayankara mountain and flows into the Bohai Sea. The total length of the basin is 5,464 km. Most of the areas are arid and semi-arid areas. The water resources in the basin are deficient, and drought is the basic feature of the Yellow River Basin. In addition, the Yellow River Basin is also one of the most important productions and processing bases of grain and agricultural products in China. The total amount of agricultural products accounts for about 13.4% of China’s total output (Zhang et al., 2013). The frequent occurrence of meteorological drought disasters in the basin has brought great harm to China’s food security.
2.2 Data sources
The future climate data of five global climate models, MIROC-ESM-CHEM, NorES1-M, IPSL-CM5A-LR, GFDL-ESM2M and HadGEM2-ES, are used in this study due to the availability of daily information on temperatures and precipitation for the four RCP scenarios (https://esgf-node.llnl.gov/search/cmip5/), and their basic information is shown in Table 1. Each set of global climate model data includes the daily average temperature and precipitation data under the RCP2.6, RCP4.5, RCP6.0 and RCP8.5 scenarios. Many scholars have used the future climate data of the global climate model to conduct a lot of research (Portmann et al., 2013; Rosenzweig et al., 2014; Sun et al., 2019; Zhao et al., 2020).
2.3 Methods
2.3.1 Delta method.
The future climate data of the global climate model can well show the trend of climate change on the global scale, but the spatial resolution of the data is very low, so it is difficult to accurately and effectively show the trend of climate change on the regional scale. Therefore, it is necessary to use a method to improve the accuracy of global climate model data on a regional scale. Delta method can calibrate multiple weather stations at the same time and has been widely used by scholars (Hay et al., 2010; Li et al., 2010; Li et al., 2012; Ren J et al., 2018).
Therefore, this paper takes the observation data of 134 meteorological stations in the Yellow River Basin from 1976 to 2005 as the base data and uses the Delta method to process the precipitation and temperature data from 2007 to 2099 of five global climate models, including MIROC-ESM-CHEM, NorES1-M, IPSL-CM5A-LR, GFDL-ESM2M and HadGEM2-ES. The purpose of the Delta method is to improve the simulation accuracy of coupled model intercomparison project phase 5 data for future precipitation and temperature. The specific calculation formula is as follows:
Where PFit, TasFit, respectively, represent the future precipitation and average temperature data of each meteorological station after correction, and PHis, TasHis, respectively, represent the observed precipitation and average temperature data of each meteorological station in the historical period; [PGfut]Mon, [TasGfut]Mon, respectively, represent the monthly precipitation and average temperature data in the future period simulated by global climate model; [PGfhis]Mon, [TasGhis]Mon, respectively, represent the monthly precipitation and average temperature data in the historical period simulated by a global climate model.
2.3.2 Mann–Kendall trend test.
For the time series X containing n samples, the calculation formula of S is as follows:
Where xi and xj represent the ith and jth data, respectively, and n is the total number of data, the calculation formula of sgn is as follows:
When n is greater than 8, S is basically consistent with the normal distribution (Zhao et al., 2020) and the calculation formula of its variance is as follows:
The calculation formula of Z is as follows:
The index for judging the changing trend of data is β, which can be calculated by the following equation:
Where j > i, Median is the median of time series data. β > 0, indicating that the data shows an increasing trend; β < 0, indicating that the data shows a decreasing trend.
2.3.3 Standardized precipitation evaporation index.
Vicente-Serrano et al. (2010) proposed a new index to evaluate the drought situation: SPEI, which considers the effect of evapotranspiration on drought by introducing temperature. The results show that the Thornthwaite formula, Hargreaves formula and Penman formula have little influence on the calculation results of SPEI. The calculation process of Thornthwaite formula is simple, so Thornthwaite method is applied to calculate monthly potential evaporation in this paper. The seasonal SPEI value can reflect the seasonal variation of drought, and the annual SPEI value can reflect the inter-annual variability of drought. The calculation method is as follows:
(1) Applying Thornthwaite method to calculate monthly potential evaporation (Thornthwaite, 1948):
Where K is the correction coefficient calculated according to latitude, T is the monthly average temperature, I is the annual total heating index and a is the coefficient determined by I.
(2) Calculating the water deficit of the Yellow River Basin month by month using formula (9). Its calculation process is simple, and it is also widely used to estimate water deficit for calculating SPEI (Vicente-Serrano et al., 2010; Wang et al., 2018a).
Where Dj represents the amount of water deficit in the jth month of the Yellow River Basin, Pj represents the rainfall in the jth month of the Yellow River Basin and potential evaporation (PETj) represents the reference evaporation values for the jth month of the Yellow River Basin.
(3) Calculating the accumulated water deficit of the Yellow River Basin on different time scales, and the specific formula is as follows:
In the formula, is the accumulated water deficit in the j-month of the i-year in the k-month scale of the Yellow River Basin and Di, l is the water deficit in the j-month of the i-year of the Yellow River Basin.
(4) The probability distribution of accumulated water deficit in the Yellow River Basin at different time scales is obtained by using log-logistic function calculation. The calculation formulas are as follows:
Where ws represents the matrix of probability weight, s = 0, 1, 2. q represents the ordinal number of the sequence X on different time scales sorted from small to large. represents the Gamma function.
(5) The probability p of can be calculated by formula (16):
(16)
If p ≤ 0.5, , the SPEI is calculated as follows:
If p > 0.5, , the SPEI is calculated as follows:
Where C0, C1, C2, d1, d2 and d3 in the formula are all constants, and their values are 2.515517, 0.802853, 0.010328, 1.432788, 0.189269 and 0.001308, respectively.
2.3.4 Drought frequency.
Drought frequency (R) is used to evaluate the frequency of drought disasters in a certain period of time in the study area (Yu et al., 2014; Wang et al., 2018a). In this study, when SPEI is less than –0.5, a drought disaster occurs. The calculation formula is as follows:
Where m represents the number of years when drought occurred in the Yellow River Basin during the study period, M represents the total number of years.
3. Results and analysis
3.1 Accuracy verification of global climate model data
Many studies have found that the average data of multiple global climate models are more accurate than a single global climate model (Pierce et al., 2009; Knutti et al., 2010; Ma et al., 2019). Therefore, this paper also uses the mean value of five global climate models, MIROC-ESM-CHEM, NorES1-M, IPSL-CM5A-LR, GFDL-ESM2M and HadGEM2-ES, as the basic data of this paper, to evaluate the spatiotemporal patterns of future meteorological drought in the Yellow River Basin under RCP scenarios. Existing studies have found that future trends in climate change in China are similar to those in RCP4.5 climate scenarios(Thomson et al., 2011; Zhang et al., 2016), Therefore, to test the accuracy of average values of MIROC-ESM-CHEM, NorES1-M, IPSL-CM5A-LR, GFDL-ESM2M and HadGEM2-ES these five sets of climate simulation data after correction, this paper used by a comparative analysis that the data of the Yellow River Basin from 2007 to 2016 under the scenario of RCP4.5 and the observation data of meteorological stations (precipitation and temperature) in the Yellow River Basin from 2007 to 2016. (Figure 2)
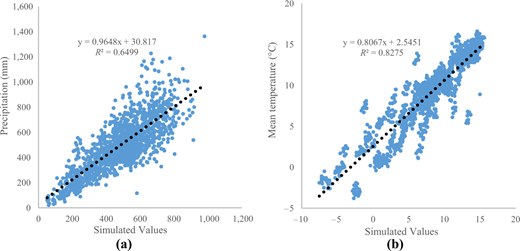
Relationships between observed annual precipitation (a), mean temperature (b) and simulated values under RCP4.5 scenario
Relationships between observed annual precipitation (a), mean temperature (b) and simulated values under RCP4.5 scenario
The R2 between annual measured precipitation and simulated annual precipitation under the RCP4.5 scenario is 0.65, and the R2 between annual measured average temperature and simulated annual average temperature under the RCP4.5 scenario is 0.83, which shows that the data after correction are basically credible at least in trend.
3.2 Temporal characteristics of future drought
In this paper, the temporal change characteristics of annual SPEI in the Yellow River under four RCP scenarios are analyzed by the Mann–Kendall trend test method (Figure 3).
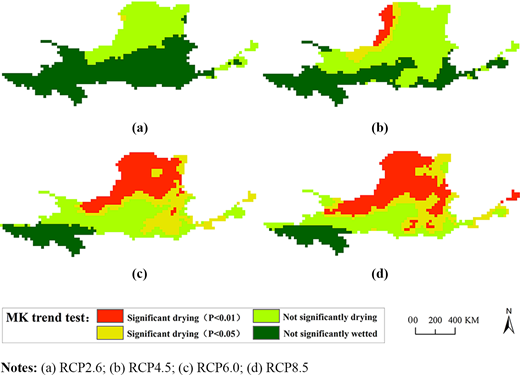
Temporal variation characteristics of annual SPEI in the Yellow River Basin under four RCP scenarios
Temporal variation characteristics of annual SPEI in the Yellow River Basin under four RCP scenarios
In the RCP2.6 scenario, most areas of the Yellow River Basin showed an insignificant trend of changing wetting, and only a small part of the region (at the level of 0.05) showed an obvious trend of becoming dry (Figure 3a).
Compared with the RCP2.6 scenario, most regions of the Yellow River Basin showed an insignificant trend of becoming dry in the RCP4.5 scenario; the range of significantly changed drought areas increased significantly. In addition, the area that is not significantly wetted is obviously reduced (Figure 3b).
In the RCP6.0 scenario, the number and range of grids with insignificant drought and insignificant wetting in the Yellow River Basin decreased significantly, whereas the number and range of grids with significant drought trend increased significantly (Figure 3c).
Compared with the RCP6.0 scenario, it is found that the number and range of grids with insignificant drought and insignificant wetting in the Yellow River Basin are further reduced in the RCP8.5 scenario, whereas the number and range of grids with significant drought trends are further increased (Figure 3d).
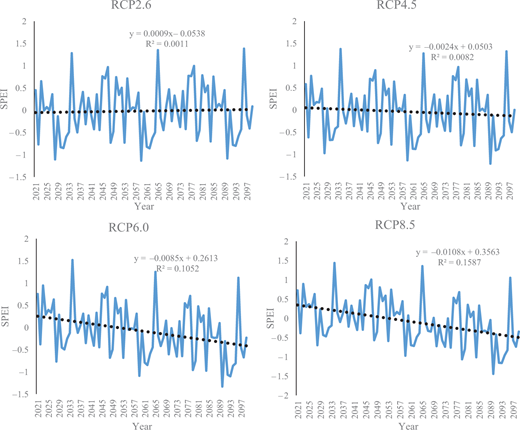
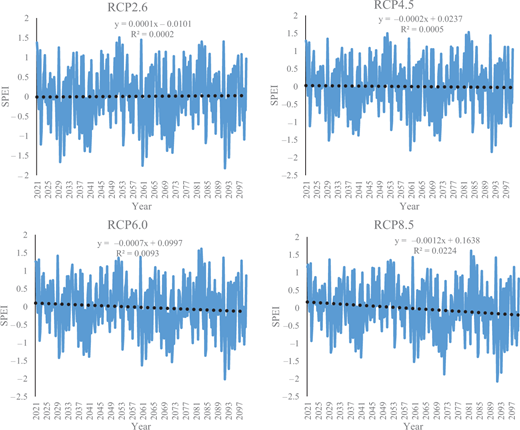
Figure 4 displays the changing trend of annual SPEI in the Yellow River Basin under four RCP scenarios. The variation trend of annual SPEI in the Yellow River Basin from 2021 to 2099 under the four RCP scenarios are different. The slope of annual SPEI in the Yellow River Basin under four RCP scenarios are 0.011(10a)−1, –0.025(10a)−1, –0.065(10a)−1 and –0.095(10a)−1, respectively. The annual SPEI propensity rate of the Yellow River are ranked from high to low as RCP2.6 > RCP4.5 > RCP6.0 > RCP8.5, indicating that the rate of drought aggravation in the Yellow River Basin is accelerating day by day with the increase of radiation forcing level.
The change trend of annual SPEI in the Yellow River Basin under four RCP scenarios
The change trend of annual SPEI in the Yellow River Basin under four RCP scenarios
The average annual SPEI value of the Yellow River Basin from 1961 to 2015 was 0.004 (Wang et al., 2018a). The results show that the average annual SPEI of the Yellow River Basin from 2021 to 2099 under the four RCP scenarios are –0.018, –0.044, –0.080 and –0.073, respectively. Therefore, the Yellow River Basin will become dry in the future.
Figure 5 displays the changing trend of seasonal SPEI in the Yellow River Basin under four RCP scenarios. The variation trend of seasonal SPEI in the Yellow River Basin from 2021 to 2099 under the four RCP scenarios are different. The slope of seasonal SPEI in the Yellow River Basin under four RCP scenarios are 0.0001(season)−1, –0.0002 (season)−1, –0.007(season)−1 and –0.0012(season)−1, respectively. The annual SPEI propensity rate of the Yellow River are ranked from high to low as RCP2.6 > RCP4.5 > RCP6.0 > RCP8.5, indicating that the rate of drought aggravation in the Yellow River Basin is accelerating day by day with the increase of radiation forcing level.
The change trend of seasonal SPEI in the Yellow River Basin under four RCP scenarios
The change trend of seasonal SPEI in the Yellow River Basin under four RCP scenarios
3.3 Spatial characteristics of future drought
Figure 6 shows the spatial distribution characteristics of drought frequency in the Yellow River Basin under four RCP scenarios. As we can be seen from Figure 6, the spatial distribution characteristics of drought frequency in the Yellow River Basin under the four RCP scenarios are very similar. The areas with high drought frequency mainly concentrated in the region from Lanzhou to Toudaoguai and from Toudaoguai to Sanmenxia, whereas the areas with low drought frequency mainly concentrated in the source area of the Yellow River. With the increasing forcing in the global atmosphere radiation level and air mean temperature, the western sector of the basin shows a clear better behavior according to SPEI.
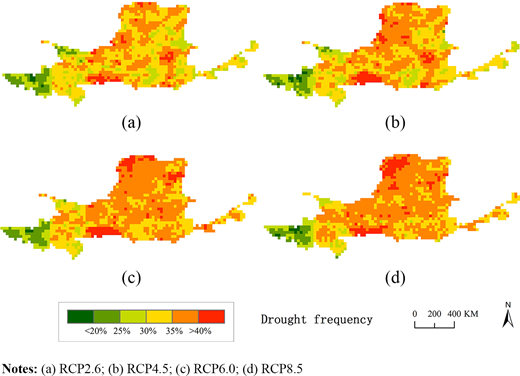
The spatial distribution characteristics of drought frequency in the Yellow River Basin under four RCP scenarios
The spatial distribution characteristics of drought frequency in the Yellow River Basin under four RCP scenarios
The number of grids with high drought frequency (more than 35%) generally showed an increasing trend from RCP2.6 scenarios to RCP8.5 scenarios, whereas the number of grids with low drought frequency (less than 25%) showed a gradual decrease, indicating that with the increase of atmospheric radiation level, the drought frequency in the Yellow River Basin shows an increasing trend.
Figure 7 shows the drought frequency in different reaches (upper, middle and lower reaches) and seasons (spring, summer, autumn and winter) of the Yellow River Basin in the four RCP scenarios. The sequence of drought frequency in different reaches of the Yellow River Basin in the four RCP scenarios are all middle reaches > lower reaches > upper reaches. Lanzhou–Toudaoguai region and the middle reaches of the Yellow River are all regions with high drought frequency in the four RCP scenarios.
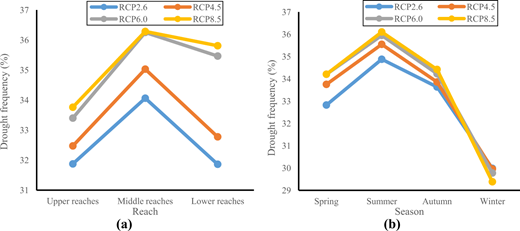
Variation of drought frequency in different reaches (a) and seasons (b) of the Yellow River Basin under four kinds of RCP scenarios
Variation of drought frequency in different reaches (a) and seasons (b) of the Yellow River Basin under four kinds of RCP scenarios
The sequence of drought frequency in the four seasons of the Yellow River Basin in the four RCP scenarios are all summer > autumn > spring > winter. Summer is the season with the highest drought frequency, and winter is the season with the lowest drought frequency in the Yellow River in the four RCP scenarios. This conclusion is the same as that of some scholars on the drought frequency of the Yellow River Basin in the historical period, such as Wang et al. (2018a) and Wang et al. (2019a). Due to the main influence of solar radiation and temperature, evapotranspiration is driven mainly by the annual seasonal trend. We proved that summer will continue to be the season with the highest drought frequency, and winter will continue to be the season with the lowest drought frequency.
3.4 Uncertainty analysis
For the study of climate change, the main uncertainty is the global climate model data (Teng et al., 2012). These uncertainties are highly correlated with the corresponding structure, parameters and spatial resolution of the global climate model (Yan et al., 2015; Ji et al., 2021c). Many studies have found that the average data of multiple global climate models is more accurate than a single global climate model (Pierce et al., 2009; Knutti et al., 2010; Ma et al., 2019) and can reduce the uncertainty of the global climate model data. So we did not discuss the degree of adjustment of each of them to the ensemble. In this study, only five global climate model data are used as the basic data. But we evaluated the simulation accuracy of the average data of five global climate models, which shows that the data are basically credible, at least in trend. In the follow-up study, more climate model data will be used for prediction.
4. Conclusions and recommendations
In this paper, the Delta method is used to correct the precipitation and temperature data of five global climate models, and then the annual SPEI and seasonal SPEI of the Yellow River Basin under different RCP scenarios are calculated. Finally, the spatial and temporal patterns of future drought in the Yellow River under different RCP scenarios are analyzed.
The following conclusions are obtained with the increase of radiative forcing level, the area with frequency and intensity of drought in the Yellow River Basin is increasing, the scenarios with the highest emissions are those that present the worst results for the SPEI, due to the increasing of forcing in the global atmosphere radiation level, and air mean temperature, Lanzhou–Toudaoguai region and the middle reaches of the Yellow River are the regions with a high frequency of drought in the future. The western sector of the basin shows a clear better behavior according to SPEI, and summer will continue to be the season with the highest drought frequency, and winter will continue to be the season with the lowest drought frequency in the Yellow River in the future.
This study predicted the changing trend of meteorological drought in the Yellow River Basin in the future, analyzed the spatial and seasonal distribution of drought frequency and identified the key areas and periods of meteorological drought in the future. Therefore, the government should pay more attention to the monitoring of drought disasters in Lanzhou–Toudaoguai region, the middle reaches of the Yellow River and summer in the future and timely formulate drought prevention and mitigation measures. According to the drought situation in different reaches, the timing of diverting the Yellow River for drought relief should be reasonably arranged, local governments and water conservancy departments should allocate multiple water sources, build water conservancy facilities in key areas and do a good job in water schedule in time, Government departments should vigorously develop new water sources to alleviate the pressure of water shortage, such as developing brackish water of Yellow River Basin, strengthening sewage treatment and reuse and The increase in the frequency of droughts will change the production conditions of agriculture, livestock and forestry and will be harmful to food production, animal husbandry production and forestry production. Government departments should establish water-saving and efficient agriculture, livestock and forestry system, improve the utilization rate of water resources and establish a sound agriculture, livestock and forestry disaster protection system.
This research was funded by the National Natural Science Foundation of China (41901239), Soft Science Research Project of Henan Province (212400410077, 192400410085), the National Key Research and Development Program of China (2016YFA0602703) and China Postdoctoral Science Foundation (2018M640670).
