


The IPCC pointed out that climate adaptability should be a major measure to deal with climate change in the future, and cities should be the main areas to cope with the risks. However, cities in severe cold regions are affected by both regional macro-climate and climate changes. Meanwhile, the related mechanisms have not been well explored. This paper aims to pay attention to the temporal and spatial evolution of urban temperature in Harbin and discuss the relationship between meteorological parameters and the urban built environment to discover the complexity and particularity of climate adaptability problems for cities in severe cold regions.
This paper takes a typical winter city in severe cold region, Harbin, as the research objective. First, the change trend of the urban temperature in Harbin in the last 30 years is analyzed using meteorological and remote sensing data, and then the projection results of the future climate change in Harbin are illustrated according to the global climate system model (BCC_CSM1_1). Second, this paper discusses the relationship between meteorological parameters and some typical built environmental factors.
The results show that the urban temperature in Harbin gradually intensifies in both the summer and the winter, but the regional macro-climate background changes little. Low temperature, frequent snowfall and insufficient sunshine in winter are still the dominant climatic environmental characteristics in Harbin. Meanwhile, the meteorological parameters have significant relationships with the built environment indicators, with a big difference between winter and summer. Finally, the paper advances some climate adaptability planning strategies to optimize the climate environment under the dual background of regional cold climate and climate change.
The paper explored the related mechanism of urban temperature evolution for cities in severe cold regions. Based on the results of some quantitative analysis, the climate adaptability planning strategies are advanced, which can provide technical support to make climate adaptability planning and construction decisions for cities in severe cold regions.
1. Introduction
The frequent occurrence of extreme weather events caused by climate change has brought severe challenges to the sustainable development of human society, and the frequency and intensity trends of this impact have been increasing (China National Development and Reform Commission, 2007). According to the United Nations Framework Convention on Climate Change (UNFCCC), global warming is the most pressing climate change issue for humanity. As the impact of climate change is long-term and irreversible (IPCC, 2007), the IPCC pointed out that climate adaptability planning should be a major measure to deal with climate change in the future (Lysak and Bugger-Henriksen, 2014) and cities should be the main areas to cope with the risks (Core writing team, 2014).
Since this century, a large quantity of climate adaptability planning researches have been conducted at the urban scale, most of which mainly focused on the relationship between urban spatial patterns and heat island. Based on related empirical analysis, the key urban spatial elements that affect high temperature were determined (Ren et al., 2021; Sadeghi et al., 2022), meanwhile the specific climate adaptation planning and design strategies were advanced (Rana et al., 2022; Choi et al., 2021). In addition, some cities and regions around the world have formulated adaptability planning documents or plans to address climate change and, which have achieved good practical effects [1], [2], [3], [4].
Cities located in severe cold regions are facing the dual impact of a regional cold climate and climate change at the same time (Unger, 2004), and the climate adaptability problems in this region have certain complexity and particularity (Oke, 2002). On the one hand, in recent years, the urban heat island of cities in severe cold regions in summer has also been very significant, with extreme hot weather events occurring frequently (Gideon, 1996). On the other hand, the low temperature and frequent snowfall in winter have greatly reduced the livability of the urban environment in severe cold regions, which has an important impact on the production and life of urban residents (Gehl, 1991).
Across the world, the amount of research on climate change in severe cold regions is increasing. Chaobin Yang and Wen Wu found a big difference between the summer and winter temperature changes for cities located in severe cold regions (Chaobin et al., 2020; Wen et al., 2021). In Hara’s and A Kan’s researches, the results showed that the intensity of the urban heat island is often larger during winter than summer (Hara et al., 2010; Kan et al., 2021). Some studies have advocated to enhance the urban heat island in winter, believing that it can act as a shields to reduce extremely low temperature damage (Yang and Bou-Zeid, 2018), and even to protect against cold-related mortality to some extent (Macintyre et al., 2021). Some other studies have posited that the temperature rise in winter has inevitable problems, such as enlarging the temperature difference between the day and night after snow, accelerating the formation of an icy surface and increasing sand and dust weather in spring due to a decrease in snow retention (Zhang et al., 2007).
However, existing research pays more attention on the difference between summer and winter in warm cities, and research on the coping mechanism of urban climate adaptability planning based on a regional climate background is very limited (Giridharan and Kolokotroni, 2009). This paper takes a typical city located in a severe cold region, Harbin, as an example, paying attention to the temporal and spatial evolution of urban temperature and discussing the relationship between meteorological parameters and the urban built environment. Based on the analysis, some climate adaptability planning strategies are advanced, to provide technical support for cities in severe cold regions in China to make climate adaptability planning and construction decisions.
2. Materials and methods
2.1 Study area
Harbin is located at 45° latitude N and 128° longitude E, and it is known as a typical winter city in the northeast of China. Harbin is the capital city of Heilongjiang Province, and also the transportation, political, economic, cultural and financial center of northeastern China, with a total population of 9.89 m at the end of 2021. The city of Harbin encompasses approximately 53,000 km2, with an urban area of 10,198 km2. A map of the location of Harbin is shown in Figure 1.
 The image presents a detailed map highlighting Harbin, located in northeastern China, with Beijing marked to the south. The right section of the map displays geographic features such as Xingkai Lake and the Sea of Japan. A zoomed-in inset of Harbin City is included at the bottom, showcasing various districts labeled with codes like S50956, S50960, and S50877. The map emphasizes spatial relationships between Harbin and neighboring regions, including Korea and Russia. Additionally, the layout features a slightly shaded section to indicate specific areas within Harbin.
The location of Harbin
Source: Created by authors
The image presents a detailed map highlighting Harbin, located in northeastern China, with Beijing marked to the south. The right section of the map displays geographic features such as Xingkai Lake and the Sea of Japan. A zoomed-in inset of Harbin City is included at the bottom, showcasing various districts labeled with codes like S50956, S50960, and S50877. The map emphasizes spatial relationships between Harbin and neighboring regions, including Korea and Russia. Additionally, the layout features a slightly shaded section to indicate specific areas within Harbin.The location of Harbin
Source: Created by authors
Harbin belongs to the temperate continental monsoon climate zone, with an annual mean temperature of 3.6°C. Harbin has a long winter and a short summer, and the concentrated snowfall period is from November to January. Because of the cold air from Siberia, the temperature in Harbin is much lower than other winter cities at the same latitude in the world (Zhang and He, 2009). Thus, besides the impact of global warming, the severe weather in winter has an important impact on the urban environment, so the city faces many more specific problems associated with climate adaptability, as shown in Table 1 (Leng and Jiang, 2017).
Urban issues during severe cold climate
| Influence objects | Particularity of climate adaptability |
|---|---|
| Urban road traffic | In winter, the carbon emissions of traffic and the energy consumption of road snow removal increase, traffic congestion after snow, road icing and insufficient transport capacity in peak hours |
| Urban landscape greening | Lack of a greening environment in winter, reduced attraction for urban residents and reduced carbon sequestration of soil and vegetation |
| Urban energy consumption | Building heating energy consumption increases, air pollution becomes serious and the use of building materials is large |
| Living of residents | Reduced outdoor entertainment time, high incidence of chronic diseases and depression and reduced immunity |
The study takes Harbin as the research objective. The detailed methodology for climate change and statistical analysis is shown in Figure 2.
 A flowchart divides into two main sections: "Determination of urban temperature change" and "Projection of future climate change trend." The left section outlines processes starting with "Built environment factors," which lead to "Correlation analysis." It also includes "Meteorological data" and "Land temperature," which connect to "Characteristic of urban climate." Below, "Discussion and refining results" leads to "Urban climate adaptability strategies." The right section connects to the "Climate system model." Each segment is visually separated, with arrows indicating the flow of information and analysis steps.
Flowchart for the research method
Source: Created by authors
A flowchart divides into two main sections: "Determination of urban temperature change" and "Projection of future climate change trend." The left section outlines processes starting with "Built environment factors," which lead to "Correlation analysis." It also includes "Meteorological data" and "Land temperature," which connect to "Characteristic of urban climate." Below, "Discussion and refining results" leads to "Urban climate adaptability strategies." The right section connects to the "Climate system model." Each segment is visually separated, with arrows indicating the flow of information and analysis steps.Flowchart for the research method
Source: Created by authors
2.2 Data analysis
2.2.1 Meteorological data.
There are a total of 10 meteorological stations in the territory of Harbin, and the station is located in the urban area in S50953, as shown in Figure 1 and Table 2. This paper statistically analyzes the data of the annual average temperature across 30 years of all of the meteorological stations, to discuss the temperature difference between the main urban and suburban areas of Harbin. All open source meteorological data were from the National Earth System Science Data Center, which is based on the normalized monthly surface temperature data from 2419 national meteorological stations in China from 1986 to 2015. A Geographically Weighted Regression model was used to generate a 10 km spatial resolution monthly climate average data set of Surface Temperature Direct Reduction (SATLR). The geographic coordinate system is GCS_WGS_1984. The annual average temperature in the analysis of Harbin is obtained by averaging the monthly average temperature. In addition, the near surface temperature data has undergone quality control and normalization correction, and missing data has been filled in using recurrent neural network algorithms.
The details of the four stations
| Stations | Population | Urbanization rate (%) | Distance to Harbin | Key economic activities |
|---|---|---|---|---|
| S50953 | 9.89m | 70.6 | 0 km | Manufacturing, business service, tourism |
| S50956 | 0.517m | 64.46 | 14.7 km | Agriculture, industry |
| S50958 | 0.500m | 65.62 | 49.5 km | Agriculture, industry |
| S50960 | 0.444m | 36.63 | 92.7 km | Agriculture |
| S50962 | 0.176m | 34.36 | 171.3 km | Agriculture |
| S50963 | 0.180m | 58.36 | 222.9 km | Agriculture |
| S50964 | 0.184m | 54.36 | 209.8 km | Agriculture |
| S50965 | 0.241m | 44.86 | 190.4 km | Agriculture |
| S50968 | 0.463m | 53.28 | 154.9 km | Agriculture, industry |
| S50877 | 0.258m | 43.9 | 294.9 km | Agriculture |
2.2.2 Landsat data.
This paper took four typical years to discuss the spatial distribution of temperature within 30 years according to Landsat 5 TM and Landsat 8 TIRS images from the US Geological Survey. To distribute the time of the 30 years equally, the years 1986, 1995, 2005 and 2015 were selected. The details are shown in Table 3 (Computer Network Information Center of Chinese Academy of Sciences, 2012). Then, this paper used ArcGIS 13.0 to process the remote sensing images for the above data to see the change trend of urban temperature in Harbin.
Research data specific information (Computer Network Information Center of Chinese Academy of Sciences, 2012)
| Data time | Data resource | Average cloud cover (%) | Strip/line no. | Resolutions |
|---|---|---|---|---|
| Sep 20th, 1986 | Landsat5 TM | 0.03 | 118 / 28 | 30m |
| Sep 26th, 1995 | Landsat5 TM | 0.05 | 118 / 28 | 30m |
| Aug 7th, 2005 | Landsat5 TM | 0.05 | 118 / 28 | 30m |
| Jan 7th, 2015 | Landsat8 TIRS | 1.35 | 118 / 28 | 100m |
2.2.3 Climate system model data.
A Representative Concentration Path (RCP) is usually used to provide emission scenarios when estimating the future climate change with four typical cases. The second “National Climate Change Assessment Report” divides China into eight partition with different climate characteristics, such as North China (NC), Northeast China (NEC) and South China (SC), as shown in Figure 3 (Ying, 2015). The projection results of the climate change of NEC partition, which include Harbin city under the four emission scenarios of RCP8.5, RCP6.0, RCP4.5 and RCP2.6 in the next 50 years, are also illustrated according to the BCC_CSM1_1 climate system model, as established by the National Meteorological Center of the China Meteorological Administration. It is a climate system model with multi-sphere coupling of sea, land, air and ice, including the global carbon cycle and dynamic vegetation (Wu et al., 2017). BCC_ CSM1_ 1 participated in the fifth phase of the coupling model comparison plan CMIP5 organized by the World Climate Research Program (Wei, 2017). As RCP6.0 and RCP4.5 are both medium emission scenarios (Van Vuuren et al., 2011), this paper chooses three from all four emission scenarios in the projection of future climate data in Harbin. They are RCP4.5, RCP8.5 and RCP2.6, representing the medium emission, high emission and strict emission reduction respectively. Meanwhile seven extreme climate indexes related to temperature were used for the climate change assessment in Harbin, including the daily maximum temperature, daily minimum temperature, daily temperature range, freezing days, summer days, abnormal warm day duration index and abnormal cold day duration index.
 This map illustrates the geographic division of China into designated regions, each labeled with an abbreviation and corresponding latitude and longitude coordinates. The regions, which include NWC for Northwest China, NC for North China, NEC for Northeast China, SWC1 for Southwest China, CC for Central China, EC for East China, SC for South China, and SWC2 for another part of Southwest China, are defined by their respective ranges of latitude and longitude. The Southern region also features a smaller inset map indicating the location of the South China Sea Islands. The overall layout presents a clear spatial organization of the different areas within China, facilitating geographical reference.
National climate change zoning (Ying, 2015)
Source: Figure courtesy of Ying XU 2015
This map illustrates the geographic division of China into designated regions, each labeled with an abbreviation and corresponding latitude and longitude coordinates. The regions, which include NWC for Northwest China, NC for North China, NEC for Northeast China, SWC1 for Southwest China, CC for Central China, EC for East China, SC for South China, and SWC2 for another part of Southwest China, are defined by their respective ranges of latitude and longitude. The Southern region also features a smaller inset map indicating the location of the South China Sea Islands. The overall layout presents a clear spatial organization of the different areas within China, facilitating geographical reference.National climate change zoning (Ying, 2015)
Source: Figure courtesy of Ying XU 2015
2.2.4 Correlation analysis.
Since the 21st century, the urban construction of Harbin has been advancing leaps and bounds, which has increased by a large margin compared to 20 years ago. According to the relevant literature, this paper chose six urban built environment indicators that can represent the urbanization process of Harbin in the last 30 years, to discuss their relationship with climate change of Harbin urban area. They are population, built up area, land development intensity, paved road area per capita, actual cultivated land area at the end of the year and greening coverage. The five selected meteorological parameters used in the correlation analysis were from S50953, which are the minimum temperature, maximum temperature, sunshine hours, wind velocity and relative humidity.
Before the correlation analysis, the outliers of the built environment indicators and meteorological parameters needed to be identified and processed. First, for individual unmeasured or missed data, the average of the adjacent monthly or annual values were used instead or reasonably inferred according to the actual situation. Second, the method of boxplots was used to identify outliers. For example, if the deviation between the outlier and the average value exceeded twice the standard, it would be replaced by the average value. Third, the variance inflation factor (VIF) was calculated to validate the intercorrelation between two independent variables, as shown in equation (1). The results of the selected indicators showed a VIFS between 1.1 and 2.5, indicating a very low level of intercorrelation between them:
where 0 < VIF < 5, means no intercorrelation; 5 < VIF < 10 means a weaker intercorrelation; 10 < VIF < 100 means a medium or strong intercorrelation; VIF > 100 means a serious intercorrelation. In view of the particularity of the local climate environment of cities in severe cold regions, there are also great differences in the climate and environmental characteristics between winter and summer. Therefore, the correlation analysis was divided into winter and summer. This paper chose the average meteorological parameters of December, January and February as the winter data, and the meteorological parameters of June, July and August as the summer data.
3. Results
3.1 Urban temperature change trend and projection
3.1.1 The change trend of surface thermal temperature in Harbin.
Figure 4 shows the 30-year average temperature change of all 10 meteorological stations in Harbin city. The average temperature of Harbin main urban area from NO.S50953 meteorological station in the past 30 years is 5.3°C, and the temperature difference with other stations is about 0.5–2.5°C. In addition, the temperature distribution of the 10 administrative districts in Harbin shows a downward trend from the main urban area to the periphery, that is, the temperature in the administrative districts adjacent to the main urban area of Harbin is relatively higher than that far away from the main urban area. For example, the lowest average temperature of NO.S50963 meteorological station that farthest from the main urban area of Harbin is 2.9°C.
 The image depicts a scatter plot that illustrates the correlation between station numbers and their respective thirty-year average temperatures in degrees Celsius. The horizontal axis represents the station numbers labeled from S50953 to S50877, while the vertical axis shows temperature values ranging from two point nine to five point three degrees Celsius, marked at intervals of point five degrees. Data points, represented by blue circles, are distributed across the plot, with the highest temperature at five point three degrees associated with S50953 and the lowest temperature at two point nine degrees linked to S50962. Each data point is accompanied by its corresponding average temperature value. The overall arrangement of the points suggests varying temperatures observed at different stations.
30-year average temperature of 10 administrative districts in Harbin city
Source: Created by authors
The image depicts a scatter plot that illustrates the correlation between station numbers and their respective thirty-year average temperatures in degrees Celsius. The horizontal axis represents the station numbers labeled from S50953 to S50877, while the vertical axis shows temperature values ranging from two point nine to five point three degrees Celsius, marked at intervals of point five degrees. Data points, represented by blue circles, are distributed across the plot, with the highest temperature at five point three degrees associated with S50953 and the lowest temperature at two point nine degrees linked to S50962. Each data point is accompanied by its corresponding average temperature value. The overall arrangement of the points suggests varying temperatures observed at different stations.30-year average temperature of 10 administrative districts in Harbin city
Source: Created by authors
Temperature variation of three typical meteorological stations with lowest temperature difference with NO.S50953 is shown in Figure 5. There is a certain upward trend in the annual average temperature of all the typical stations. The average temperature of the main urban area of Harbin has the largest rate of rise, and the temperature difference between the main urban area and the other three case administrative districts has become larger and larger within 30 years, indicating that the change of heat island effect in the main urban area of Harbin is stronger than other areas.
 The graph illustrates temperature variation over 30 years, spanning from 1986 to 2014. The vertical axis, labelled "Temperature variation in 30 years (°C)," measures temperature changes in degrees Celsius, while the horizontal axis represents the years from 1986 to 2014. Data points are marked with distinct symbols for four different datasets: S50953 (blue circles), S50956 (orange squares), S50958 (gray crosses), and S50960 (yellow x's). Each dataset is accompanied by a corresponding line connection to facilitate comparison. Trend lines indicate the patterns among the collected data points. The graph includes error bars for certain datasets, suggesting the variability in the data. The layout presents a clear chronological flow, allowing for easy navigation from left to right across the years.
Temperature variation of 4 typical meteorological stations in 30 years
Source: Created by authors
The graph illustrates temperature variation over 30 years, spanning from 1986 to 2014. The vertical axis, labelled "Temperature variation in 30 years (°C)," measures temperature changes in degrees Celsius, while the horizontal axis represents the years from 1986 to 2014. Data points are marked with distinct symbols for four different datasets: S50953 (blue circles), S50956 (orange squares), S50958 (gray crosses), and S50960 (yellow x's). Each dataset is accompanied by a corresponding line connection to facilitate comparison. Trend lines indicate the patterns among the collected data points. The graph includes error bars for certain datasets, suggesting the variability in the data. The layout presents a clear chronological flow, allowing for easy navigation from left to right across the years.Temperature variation of 4 typical meteorological stations in 30 years
Source: Created by authors
The evolution of Harbin’s land temperature of the main urban area in four typical years is shown in Figure 6. The blackpoly line shows the main urban area determined by “the master plan of Harbin (2011–2020)”. The surface temperature and the coverage of the heat island in Harbin showed an increasing trend, and the super heat island area of the city in 2015 was the highest. The heat island area gradually expanded to the north and west of the city, among which the urban strong heat island area exceeded the land use scope of the main urban area, forming several independent heat island areas. High-temperature areas were located in the residential land in the city center and the industrial land around the city center.
 The image comprises four heat maps illustrating temperature data across four years: 1986, 1995, 2005, and 2015. Each map features temperature ranges with a colour gradient indicating values, where the black outlines depict geographical boundaries. The legend below each map specifies temperature categories, identifying high, medium, and low ranges, along with their corresponding values in degrees Celsius. The north arrow is present in the top right of each map. The colour gradients vary between maps, representing changes in temperature over the years, with notable areas marked in different intensities of colours.
The evolution of Harbin land temperature of main urban area in four typical years
Source: Created by authors
The image comprises four heat maps illustrating temperature data across four years: 1986, 1995, 2005, and 2015. Each map features temperature ranges with a colour gradient indicating values, where the black outlines depict geographical boundaries. The legend below each map specifies temperature categories, identifying high, medium, and low ranges, along with their corresponding values in degrees Celsius. The north arrow is present in the top right of each map. The colour gradients vary between maps, representing changes in temperature over the years, with notable areas marked in different intensities of colours.The evolution of Harbin land temperature of main urban area in four typical years
Source: Created by authors
3.1.2 The change trend of surface thermal radiation in Harbin.
Figure 7 shows the projection of the temperature change index of the NEC district in three low-carbon scenarios (Ying, 2015). Compared to the conditions from 1986 to 2015, the climate change situation in Harbin in the future is severe. For different RCP greenhouse gas emission scenarios, the daily maximum temperature of Harbin showed an increasing trend with 3.5–4.5°C across the next 50 years. Moreover, the daily minimum temperature showed an increasing trend with 3.4–4.2°C. At the same time, the daily temperature range showed a downward trend, especially in RCP4.5 and RCP8.5.
 The image consists of an eight-map grid illustrating climate projections for Harbin. Each row represents a different climatic variable, including daily maximum temperature, daily mean temperature, freezing days, summer days, and other indices, for varying time frames and RCP scenarios. The first two columns represent RCP2.6 and RCP4.5 scenarios for the periods 2016-2035 and 2046-2065, while the last two columns feature RCP4.5 and RCP8.5 for the same periods. Each map displays a distinct colour gradient indicating different temperature or index values, with labels indicating Harbin's location. The layout flows from left to right, top to bottom, allowing for comparative analysis across scenarios and time periods.
The projection of temperature change index of NEC district in 3 low-carbon scenario
Source: Figure courtesy of Ying XU 2015
The image consists of an eight-map grid illustrating climate projections for Harbin. Each row represents a different climatic variable, including daily maximum temperature, daily mean temperature, freezing days, summer days, and other indices, for varying time frames and RCP scenarios. The first two columns represent RCP2.6 and RCP4.5 scenarios for the periods 2016-2035 and 2046-2065, while the last two columns feature RCP4.5 and RCP8.5 for the same periods. Each map displays a distinct colour gradient indicating different temperature or index values, with labels indicating Harbin's location. The layout flows from left to right, top to bottom, allowing for comparative analysis across scenarios and time periods.The projection of temperature change index of NEC district in 3 low-carbon scenario
Source: Figure courtesy of Ying XU 2015
The freezing days showed a downward trend in three different emission scenarios. The decrease was approximately 10 days in RCP2.6 and RCP4.5, and the decrease was approximately 25 days in RCP8.5. Meanwhile, the summer days in Harbin showed an increasing trend. The greater the greenhouse gas emissions, the more significant the increasing trend of summer days, as well as the change trend of the abnormal warm day duration index. The abnormal cold day duration index showed a slight downward trend and a small difference in the three greenhouse gas scenarios, which was approximately 2.5–5 days.
3.2 The relationship between urban meteorological parameters and built environment
Figure 8 shows the evolution of the spatial pattern of the central urban area in Harbin across the 30 years. It can be seen that the urban construction land in Harbin expanded continuously, which presented a trend of spreading development from the center to the surrounding areas. The Harbin city grew simultaneously in the form of points, lines and planes.
 The image presents four maps arranged horizontally, each depicting a specific year: 1986, 1995, 2005, and 2015. Each map displays the same geographical area, highlighting alterations over time. The maps are outlined with a red border, and each features a compass rose indicating orientation. The variations between the years illustrate changes in the landscape, with distinct patterns of development evident in the progression from 1986 to 2015. The maps do not utilise colour, which allows for a clear comparison of spatial changes through differing shades of grey representing various features in the area.
The evolution of spatial pattern of Central urban area in Harbin
Source: Created by authors
The image presents four maps arranged horizontally, each depicting a specific year: 1986, 1995, 2005, and 2015. Each map displays the same geographical area, highlighting alterations over time. The maps are outlined with a red border, and each features a compass rose indicating orientation. The variations between the years illustrate changes in the landscape, with distinct patterns of development evident in the progression from 1986 to 2015. The maps do not utilise colour, which allows for a clear comparison of spatial changes through differing shades of grey representing various features in the area.The evolution of spatial pattern of Central urban area in Harbin
Source: Created by authors
Table 4 shows the correlation analysis of the urban meteorological parameters and built environment in Harbin in the winter. Besides the actual cultivated land area at the end of the year and the paved road area per capita, there was no significant correlation between the average minimum temperature in the winter in Harbin and the other built environment indicators. Meanwhile, the average maximum temperature and the average minimum temperature in winter were significantly correlated with most of the built environment indicators at the 0.01 level, and most of them were negatively correlated with a higher coefficient level above –0.4. For example, the correlation with the actual cultivated land area at the end of the year was even as high as –0.690.
Correlation analysis of urban meteorological parameters and built environment in Harbin in the winter
| Parameters | Min. temperature | Max. temperature | Sunshine hours | Wind velocity | Relative humidity |
|---|---|---|---|---|---|
| Population | 0.322 | −0.508** | −0.611** | −0.688** | 0.127 |
| Built up area | 0.316 | −0.540** | −0.699** | −0.648** | 0.076 |
| Land development intensity | −0.132 | 0.167 | 0.217 | 0.458** | −0.215 |
| Paved road area per capita | 0.571* | −0.511** | −0.349 | −0.329** | −0.248 |
| Actual cultivated land area at the end of the year | 0.545* | −0.690** | −0.682** | −0.702** | −0.141 |
| Greening coverage | −0.198 | −0.560* | −0.705** | −0.808** | 0.402* |
*-Significance at 0.05 level, **-Significance at 0.01 level
The winter sunshine hours in Harbin were significantly affected by the built environment indicators, and the correlation coefficients were all above 0.6, whereas the correlation coefficients with the green coverage rate were as high as –0.705. Compared to the other urban meteorological parameters, the urban built environment of Harbin had the most influential factors of winter average wind velocity, whose correlation with all built environment indicators was significant at the level of 0.01, whereas the correlation coefficient with green coverage was even as high as –0.808. The wind velocity was negatively correlated with the built environment indicators, except the land development intensity. The average relative humidity in the winter in Harbin was the meteorological parameter least affected by the urban built environment, and was only positively correlated with the green coverage rate at the significance level of 0.05.
Table 5 shows the correlation analysis of the urban meteorological parameters and built environment in Harbin in the summer. The average minimum temperature in Harbin in the summer was significantly correlated with five built environment indicators, excluding the paved road area per capita, of which three indicators were positively correlated at the significance level of 0.01, with the correlation coefficient with the actual cultivated land area at the end of the year being as high as 0.792. Meanwhile, the statistical difference between the average maximum temperature in the summer and the various indicators of the built environment was quite small, with only a certain correlation with the indicator of actual cultivated land area at the end of the year.
Correlation analysis of urban meteorological parameters and built environment in Harbin in the summer
| Parameters | Min. temperature | Max. temperature | Sunshine hours | Wind velocity | Relative humidity |
|---|---|---|---|---|---|
| Population | 0.673** | 0.361 | −0.499** | −0.732** | −0.307 |
| Built up area | 0.707** | 0.358 | −0.583** | −0.703** | −0.297 |
| Land development intensity | −0.455* | −0.228 | 0.328 | 0.536** | 0.147 |
| Paved road area per capita | 0.436 | 0.247 | −0.578** | −0.561* | −0.330 |
| Actual cultivated land area at the end of the year | 0.792** | 0.497* | −0.243 | −0.734** | −0.540* |
| Greening coverage | 0.375* | 0.293 | 0.286 | −0.815** | −0.053 |
*-Significance at 0.05 level, **-Significance at 0.01 level
There was a significant negative correlation between the average sunshine hours in the summer and the population in Harbin. Similarly to the average wind velocity in the winter, the average wind velocity in Harbin in the summer was also greatly affected by the urban built environment indicators, significantly related to all of the urban built environment indicators. Similar to the change of the average relative humidity in the winter, the average relative humidity in Harbin in the summer was not significantly correlated with the urban built environment indicators and was less affected by urban development and construction, mainly related to the regional climate background.
4. Discussion and strategies
4.1 Characteristics of urban climate change in Harbin
From the results of the analysis above, there are several regular characteristics for the urban climate in Harbin can be summarized:
The urban temperature gradually intensified. Under the three emission scenarios, the projection showed that the trend of urban climate change in Harbin has been accelerating, and with the increase in greenhouse gas emissions, this change trend will become more significant. This is comparable to other studies of the urban temperature rising trend for cities in northern mid-latitude climates in the US (1–4 °C) (Harp, 2000). In addition, the number of summer days and the average daily temperature increased obviously of Harbin; however, the change trend of the freezing days was relatively weak. With the continuous acceleration of urbanization and the expansion of land use, the number of urban artificial heat sources and secondary heat storage sources increased and the urban temperature of Harbin will continue to increase.
Significant regional climate background effect. Although the annual average temperature, the lowest temperature in the coldest month and the highest temperature in the hottest month in Harbin increased to a certain extent across the 30 years, the average temperature in the winter for six months experienced a relatively small change range, the urbanization process had limited influence on the temperature of the regional macro-climate background, and the low temperature, frequent snowfall and insufficient sunshine in winter remained the dominant climatic environmental characteristics in Harbin, which is similar to Chaobin Yang’s conclusion (Chaobin et al., 2020).
The number of extreme weather increased gradually. Although the types and intensity of extreme weather events in cities in severe cold regions are less than those in cities in warm regions (Barnett et al., 2012), there was also a certain upward trend in recent years. Besides the extreme precipitation and high temperature heat wave, considering the regional climate background, Harbin was mainly affected by the extreme weather of snowfall and low temperature. When experiencing extreme weather, the burden of urban transportation, energy and other infrastructure increases, which has a great impact on the space environment. Therefore, adaptive planning to cope with temperature and snowfall changes is also the main direction for formulating policies and actions in the future, which is key to reducing the impact and losses caused by extreme weather events in Harbin.
4.2 Interaction characteristics of urban climate and built environment
For cities in severe cold regions, the impact of the built environment on the temperature in the winter and summer is significantly different (Hinkel et al., 2003). Based on the statistical analysis results in this research, the impact of the urban built environment on the winter temperature primarily met the average maximum value, whereas the impact on the summer temperature mainly met the average minimum value. With the increase in urban construction intensity, the average maximum temperature in the winter in Harbin decreased, whereas the average minimum temperature in the summer increased, and the Pearson’s correlation coefficients were almost all above 0.6. The data reflect that the urban built environment of Harbin has formed an irreversible impact on the increase in urban temperature. In addition, the average wind velocity in the urban area was significantly affected by the urbanization process, which was the most affected of the urban meteorological parameters, demonstrating a significant correlation with all urban built environment indicators. The overall performance showed that the faster the urbanization process, the smaller the average wind velocity. This conclusion is consistent with the study of Hinkel (Jaehyun et al., 2017).
It is worth mentioning that even though the average relative humidity in Harbin generally showed a weak downward trend in the 30 years from 1987 to 2016, there was a certain “dry island effect” in the city, whereas the average relative humidity change in the winter and summer was not affected by the urban built environment indicators, and there was no significant correlation between the two. The author speculates that the change of the average relative humidity in the city and the type of urban underlying surface structure, among other factors, are more closely related.
Among the various urban built environment indicators, the actual cultivated land area at the end of the year had the most significant impact on the climate of Harbin in the winter and summer. Except the average relative humidity in the winter and the average sunshine hours in the summer, there was a significant correlation between the actual cultivated land at the end of the year and the various climate parameters, with a significance level above 0.01. In addition, the impact of the urban greening coverage on the winter climate parameters was greater than that in the summer.
To sum up, the increase in urban temperature has both advantages and disadvantages for cities in severe cold regions, and simply controlling or increasing the urban heat island in severe cold regions is not the best method (Zheng, 2016). Based on the analysis results above, the urban built environment has a great impact on the urban temperature in Harbin. Therefore, from the perspective of climate adaptability, the main objective of optimizing the climate environment of cities in severe cold regions through reasonable planning and design of the built environment is to consider the differences in the local urban climate and environment in the winter and summer, proposing reasonable climate adaptability planning measures and strategies through which the high temperature in summer can be controlled and the climate comfort in winter can also be improved.
4.3 Climate adaptability planning strategies
According to the statistics of International Association of Winter Cities, more than 600 m people worldwide live in severe cold regions. Climate change research and policy making considering the severe cold climate background are of great significance. Nowadays, research on climate change adaptability is increasing across the world, and a basic climate adaptability planning system has been formed (Peng and Lu, 2012). For cities located in severe cold regions, each stage of climate adaptability planning in the system should reflect regional climate characteristics according to the climate change measurement method used in this study and relevant analysis results of this study, as shown in Figure 9. It will enhance the cities’ ability to cope with climate change while improve the livability of urban environments.
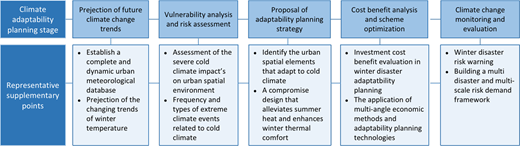
Framework of urban climate adaptability planning in severe cold regions
Source: Created by authors
Framework of urban climate adaptability planning in severe cold regions
Source: Created by authors
In addition, it has become an international mainstream policy to integrate the objectives of adaptability to climate change into spatial planning and design. Based on the above related analysis results in Harbin, this paper focused on the indicators of actual cultivated land at the end of the year and the greening coverage, which were the two indicators with the greatest impact on local temperature, advancing relevant spatial planning and design strategies to optimize the climate environment under the dual background of regional cold climate and climate change, to improve the climate adaptability of cities in severe cold regions.
4.3.1 Optimize urban and rural spatial structure.
Cities in severe cold regions should control rapid growth of urban construction land. Some research show regional climate will cool down due to the irrigation effect of cultivated land area, thus protecting suburban arable land can alleviate the heat island effect of cities. In addition, it is important to control the city population size and capacity, select appropriate and compact urban spatial forms and optimize land use structure. For example, maintain appropriate building density in urban development and construction, reasonably coordinate the relationship between the urban dominant wind direction and high-rise building layout and enhance the natural adjustment effect of the urban climate (Huawei and Guifang, 2021). Although the above strategies are also applicable to other cities, they are more significant for cities in severe cold regions. They can effectively reduce the traffic and energy consumption problems caused by cold weather and ice and snow in the winter, thus reducing the greenhouse gas emissions caused by adapting to a regional cold climate.
4.3.2 Overall planning of urban and rural ecological space.
To enhance the climate adaptability of the city through the urban green space system, it is necessary to determine the green space layout mode and reasonable green space planting structure to adapt to the severe cold climate characteristics (Huang et al., 2018), so as to form a reasonable and effective green space landscape pattern and improve the overall greening coverage of the city. For example, strengthening the construction of urban ecological corridors along the dominant wind direction of the city, introducing surrounding fresh air into the city and maintaining the protective forest belt along the river, to effectively reduce the invasion of the cold air in winter, while regulate the high temperature in summer. Urban ecological corridors are mainly composed of ventilation corridors at all levels, compensation space and action space. Compensation space and action space can be divided into different levels based on the scale of urban streets or greenland, thus forming complete urban ecological corridor system, as shown in Figure 10.
 The image is a diagram depicting the layout of compensation spaces and corridors related to Harbin City. It features a central area identified as Harbin City, bordered by a main river and surrounded by compensation spaces in large cities and regional contact areas. The corridors are classified into primary, secondary, tertiary, fourth level, and fifth level categories, indicating their hierarchical relationships. The diagram includes directional elements such as air inlets and dominant wind direction, represented by arrows. Grid-like sections show varying compensation spaces outlined in different shades, with dotted boxes indicating smaller areas within the corridors. The overall structure allows for a clear understanding of spatial relationships and connections among various elements within the diagram.
Construction sketch of urban ecological corridor in Harbin
Source: Created by authors
The image is a diagram depicting the layout of compensation spaces and corridors related to Harbin City. It features a central area identified as Harbin City, bordered by a main river and surrounded by compensation spaces in large cities and regional contact areas. The corridors are classified into primary, secondary, tertiary, fourth level, and fifth level categories, indicating their hierarchical relationships. The diagram includes directional elements such as air inlets and dominant wind direction, represented by arrows. Grid-like sections show varying compensation spaces outlined in different shades, with dotted boxes indicating smaller areas within the corridors. The overall structure allows for a clear understanding of spatial relationships and connections among various elements within the diagram.Construction sketch of urban ecological corridor in Harbin
Source: Created by authors
4.4 Limitation of the study
Due to the restriction of data acquisition, the number of selected urban built environment indicators was very limited. The urban climate may be influenced by other built up environment indicators in severe cold regions (Gideon, 1996). In further studies, the relationship between the urban temperature and urban built environment need to be studied in more depth (Fei, 2022; Kedia et al., 2021), as well as socioeconomic elements. Besides the regional climate, the urban temperature maybe also affected by water use and air pollution, and research related to much more factors need to be discussed in depth. We will focus more on considering urban climate change trends under multi model comparisons according to IPCC’S recommendation in the next step of research, as well as more data observations and theoretical analysis. More precise calculation and simulation results will be extremely useful for the cultivation of environmental urban policy and promoting the climate adaptability planning practice in severe cold regions.
5. Conclusions
The study took a typical winter city, Harbin, located in a severe cold region as the research objective, developing research on the urban temperature and its relationship with some built environment indicators. It drew the conclusion that Harbin shows a certain degree of heat island effect with the significant characteristic of regional climate background compared to cities in warm regions. The urban temperature gradually increased; meanwhile, low temperature, frequent snowfall and insufficient sunshine in the winter remained the dominant climatic environmental characteristics in Harbin. In addition, the built environment in Harbin was significantly correlated with the urban climate, which also showed seasonal characteristics. With the increase in urban construction intensity, the average maximum temperature in the winter decreased, whereas the average minimum temperature in the summer increased. The most significant impact indicator of built up environment was the actual cultivated land area at the end of the year. The average wind velocity was the most affected of the urban meteorological parameters.
Based on the related analysis results, this study advances some urban planning and design strategies to improve the city’s climate adaptability under the dual impact of the regional cold climate and climate change. This includes the optimization of the urban and rural spatial structures, the overall planning of urban and rural ecological spaces and proposing the framework of urban climate adaptability planning in severe cold regions. It provides planners and designers with useful experiences in improving the urban climate environment in severe cold regions.
Publisher’s Note: The publisher of International Journal of Climate Change Strategies and Management wishes to alert readers that the article Jiang C, Hu Y, Yuan Z, Yuan Q (2025), "Study on the temporal and spatial evolution of the urban temperature and climate adaptability planning strategy in severe cold regions – a case study of Harbin, China". International Journal of Climate Change Strategies and Management, Vol. 17 No. 1 pp. 982–999, doi: Link to Study on the temporal and spatial evolution of the urban temperature and climate adaptability planning strategy in severe cold regions – a case study of Harbin, ChinaLink to the cited article, was published in error; no formal request to withdraw the article prior to publication was received from the authors at the time, however. The correct version, as designated by the authors, can be found at Cunyan Jiang, Zide Liu, Chenxi Peng, Yuxing Hu, Qing Yuan, and Biao Li (2026), “Study on the Temporal and Spatial Evolution of the Urban Temperature and Climate Adaptability Planning Strategy in Severe Cold Regions—A Case Study of Harbin, China”, Weather, Climate, and Society, vol. 18, no. 1, pp. 113-25, Link to Study on the Temporal and Spatial Evolution of the Urban Temperature and Climate Adaptability Planning Strategy in Severe Cold Regions—A Case Study of Harbin, ChinaLink to the cited article. The authors and publisher apologize to the readers.
Notes
Adaptation to heat stress in Antwerp (Belgium) based on detailed thermal mapping. 2020.
U.S. Environmental Protection Agency Climate adaptation and action plan. 2021.
Copenhagen carbon neutral by 2025-Copenhagen climate adaptation plan. 2010.
Climate in Norway 2100-a knowledge base for climate adaptation. 2017.

