


The purpose of this paper is to assess the extent of climate change likely to be manifested in the MENA region using statistical tools as well as outputs from physics‐based General Circulation Models (GCMs).
Atmospheric temperature and precipitation primarily capture climate change features and are considered the drivers of other manifestations of climate change such as rises in sea‐level, tropical cyclone intensities, severe floods, prolonged droughts, and retreating ice. Data on atmospheric temperature and precipitation have been statistically analysed for trend, distribution and variability in this study. Long‐range prediction is then made using time series analysis. Long‐range projections have also been made by many investigators using physics‐based GCMs and the Fourth Assessment Report of IPCC provides a summary. IPCC projections are not indisputable because of some inherent limitations of GCMs. A comparative study is made between statistical predictions and IPCC projections, as well as forecasts from some GCMs specifically applied to the region, to develop a more reliable forecast scenario. Water resources projects are quite vulnerable to changes in atmospheric temperature and precipitation amounts. The various aspects of planning, design and management of water resources projects which are likely to be influenced by climate change are discussed.
There is considerable variability in atmospheric temperature and precipitation in recent observations but if the variability is filtered out and the underlying trend extrapolated it is found that there is in general an agreement between IPCC projections and statistical predictions. For rise in atmospheric temperature projections made from many GCMs applied to the region, as well as projections summarised in the Fourth Assessment Report of IPCC, appear to be good estimates to be included in design considerations. For precipitation, statistical predictions are perhaps a better choice because GCM projections are less reliable with precipitation since associated meteorological processes occur at a much smaller scale than the grid size of a GCM. For low‐lying coastal regions sea‐level rise and more frequent extreme climatic events such as tropical cyclones add to the dimensionality of design considerations especially for infrastructure design.
This paper presents a comparative study of possible climate change in the long‐term between physics‐based model projections and statistical predictions. This should provide greater insight into climate change that is expected in MENA and reduce uncertainty, thereby instilling greater confidence in water resources planners and practitioners to incorporate climate change aspects into decision making. This research is believed to be particularly helpful because of scant research work done on this part of the globe on climate change.
Introduction
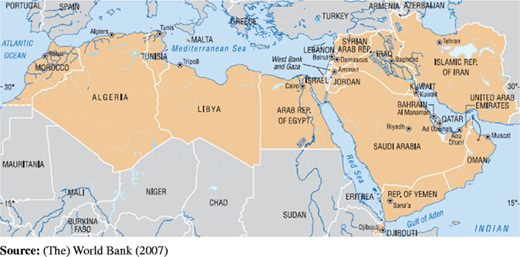
MENA (Middle East and North Africa) which encompasses 12 million square kilometres of land area hosts 5.5 percent of the world's population but possesses only 0.6 percent of the world's renewable water resources (UNESCO, 2006). It is the driest part of the world which has been the seat of many ancient civilizations. The MENA countries are identified in Figure 1 (The World Bank 2007). Societies across this part of the world grew over centuries adapting to the variability and scarcity of water through ingenuous methods, innovative ideas, sophisticated hydraulic structures and organizational skills. Perhaps, the most significant turning point in this rich history of adaptations occurred when the low‐cost drilling technology became available in the 1960s. People started extracting water from the aquifers in the absence of any overarching planning. MENA is now using more water than it receives. (UNESCO‐IHP, 2005; Chapagain and Hoekstra, 2003).
According to The World Bank (2007) the demand for water in MENA in future is likely to augment quite drastically. The population is growing at a rate greater than 2 percent per year. Per capita renewable water resource in the area was 4,000 m3 in 1950 and is currently at 1,100 m3 per year compared to global average of 8,900 m3 per person per year today. Water resources planners are already faced with a massive challenge of ensuring acceptable level of supply for the future generation – which against the backdrop of an area that has the lowest precipitation with the highest variability, and possible adverse consequences due to climate change – is truly a daunting task.
Throughout history water has been very precious for the people of MENA and has led to many conflicts. Since many rivers are transboundary, water remains a very sensitive issue in the region and any adverse impact on its water resources due to climate change has the potential of far reaching consequences. Raleigh and Urdal (2007) assert that climate change has already been a contributing factor in the current conflicts of Darfur. The need to address the effects of climate change is therefore critical, but the greatest hurdle to any action is the uncertainty associated with it. There is uncertainty in the degree of climate change as well as in the effectiveness of any proactive measure. There are primarily two types of proactive measures to deal with climate change – one is mitigation and the other is adaptation. Mitigation measures involve adoption of strategies that would reduce the contributing factors to climate change, in particular reduction of emission of greenhouse gases into the atmosphere. To be effective mitigation measures are required to be embraced globally, but the developed nations have been reluctant to do so due to anticipated adverse effects on their economy; their argument is that unless all nations can agree on certain level of carbon emission targets, the nations who adopt low carbon emission policy would suffer from increased cost of production thereby reducing competitiveness of their produce in the world market.
By contrast, the scope of adaptation measures is often regional. Usually, adaptation measures are implemented when symptoms begin to manifest. In such an approach there is less uncertainty. Adaptation measures are amenable to what Lind (1997) describes as “dynamic flexibility”, which means we can monitor the progress and effectiveness of adaptation measures, and change strategies whenever observations support such moves. Adaptation measures can be either “autonomous” or “engineered”. In autonomous adaptation, nature adjusts itself to climate change to a certain degree; for example, higher temperatures would cause increased evaporation from oceans which would form more clouds reducing incoming solar radiation on the earth's surface that acts as negative feedback. Engineered adaptation measures are essentially human interventions to cope with climate change.
Since engineered adaptation measures may require significant amount of public fund, the United Nations Framework Convention on Climate Change (UNFCCC) contain two articles (Articles 4 and 12) which require the assessment and reporting of vulnerability and adaptation. Unless a system is proven to be sufficiently vulnerable to climate change, governments may rue the decision to invest in adaptation measures at a later date. Vulnerability itself though is a difficult concept to grasp. Cutter (1996), for example, identifies 18 definitions of vulnerability from hazards literature alone. Barnett (2001) suggests that vulnerability to climate change stems from location and lack of power or social disadvantage. This lack of power reduces access to resources and in turn narrows the range of options available to a population in times of stress.
The climate change aspect and its implications in MENA countries have been addressed earlier by some investigators. Perhaps, due to relative sparseness in data of the region, a relatively small volume of research focusing on the regional climatic phenomena exists. Several studies on trends in local climatology based on ground station data have been performed for several localities (Rahimzadeh et al., 2009; Hamdi et al., 2009; Freiwan and Kadioglu, 2008; Kostopoulou and Jones, 2005; Cohen et al., 2002) as well as vast areas (Zhang et al., 2005; Nasrallah and Balling, 1995) and modelling with observations assimilated (Ghasemi and Khalili, 2006; Chakraborty et al., 2006; Turkes and Erlat, 2005). Zhang et al. (2005) report the outcomes from a series of five regional climate change workshops held in 2004 and 2005 to analyze changes in extreme climate indices for regions not studied before. Delegates from 15 countries in the Middle East and adjacent region brought in data which were analyzed for the period 1950‐2003. They report statistically coherent increasing trends in temperature in the northern part of the region with the percentage of stations showing significance in excess of 60 percent. They concluded that overall there have been significant increases in the number of warm days and significant decreases in the number of cold days but less so in the desert regions. Regarding precipitation, they found that precipitation climatology varies considerably from one place to another place; showing both increasing and decreasing trends and lack of spatial coherency.
Freiwan and Kadioglu (2008) and Hamdi et al. (2009) report for Jordan warming of maximum temperature, more statistically significant warming of minimum temperature, decreasing trend in diurnal temperature range, and statistically insignificant decreasing precipitation trends, which are enhanced by heat island, urbanization, pollution and aerosol effects. Rahimzadeh et al. (2009) report marked negative trends in the number of frost days, the number of cool days and nights, diurnal temperature range and positive trends in the number of warm days over most regions of Iran. They also found that the eastern and western regions of Iran showed negative trends in precipitation while the central region showed positive trend in precipitation. Elagib and Abdu (1997) report the fluctuating nature of the climate of Bahrain suggesting that there could be very long‐term cycles in the climatology.
This study makes an independent statistical analysis of observed high quality data from selected stations in MENA and compares the results with the outcomes from General Circulation Models (GCMs). These findings build on the findings reported by other investigators in the published literature. The overarching objective of this study is to reduce the uncertainty on climate change by comparing and inferencing statistical outputs with physics‐based GCM projections. Once a water resources practitioner has a reasonable perspective of the expected climate change, this paper addresses the engineered adaptation measures that are relevant to his/her strategic planning and management. The paper is structured such that the next major section is on the historical trends, which is followed by another major section on projections. The section after that is on water resources project design considerations that are likely to be impacted by climate change. The paper ends with some discussion and concluding remarks.
Historical hydrological trends
The hydrologic cycle of an area is driven to a large degree by its atmospheric temperature and precipitation. The universal yardstick for climate change is understood to be the atmospheric temperature and precipitation (Pfister et al., 1999). Other aspects of climate change are regarded as offshoots from these two parameters. Climate change has been occurring from time immemorial but Ammann et al. (2007) and Karl and Trenberth (2003) assert that the recent footprints of climate change are so rapid that it cannot be explained by natural causes alone. To identify climate change footprints in MENA we are confronted with the paucity of data as well as spatial variability. Dai et al. (1997) have identified that for the purpose of large‐scale water resources project planning in MENA the zone of influence of a pluviometric station is about 300 kilometres. Limited by sparsely observed data and at the same time the need to account for spatial variability, the hydrological analysis of MENA has been done in this paper as comprised of five sub‐regions, which are: the Gulf area (Arabian peninsula), Asian Mashrek (North Middle East), Northeast Africa, Mid‐North Africa, and the Maghreb (Northwest Africa).
The focus of this study is basinwide planning since different water resources projects usually share the common resources of a basin, and basins in MENA are generally large often extending from coast to far inland, and therefore, distinction has not been made if a project's location is at the coast or inland. The hydrological data used for statistical analysis is for the period 1950‐2004. The primary sources of data are IRI/LDEO Climate Data Library (http://iridl.ldeo.columbia.edu) and NASA (http://data.giss.nasa.gov/gistemp/station_data), which have been expanded by other sources such as Zhang et al. and personal communications. The reason for choosing the period after 1950 is that published literature indicate that appreciable manifestation of anthropogenic forcing of climate change began after 1950 (Ammann et al.). Where data was obtained by personal communication, data quality check was done by methods described in Zhang et al., and when necessary data imputation for missing data was made using modelling approach described in Ali and Wasimi (2007, p. 28).
Trends in temperature
From paleoclimatic observations, especially from polar ice cores and deep oceanic benthic fossils, many cycles have been detected in the earth's temperature. Notable among these cycles are the Milankovitch cycles of 100, 40 and 25 thousand years (Yang and Goodrich, 2008) caused by variations of eccentricity, axial tilt and precession of the earth's orbit around the sun. In the dominant 100 thousand year cycle, the earth takes about 90 thousand years to cool and another 10 thousand years to warm up. Unfortunately, we are now at the stage where it is warming up. These cycles are global, but cycles of smaller time scale are regional and vary from region to region. The sceptics of climate change often refer to these cycles as natural variability to explain recently observed climate change phenomena. But these are cycles with periods of hundreds and thousands of years, and the rate of change has never been so rapid as we are witnessing today.
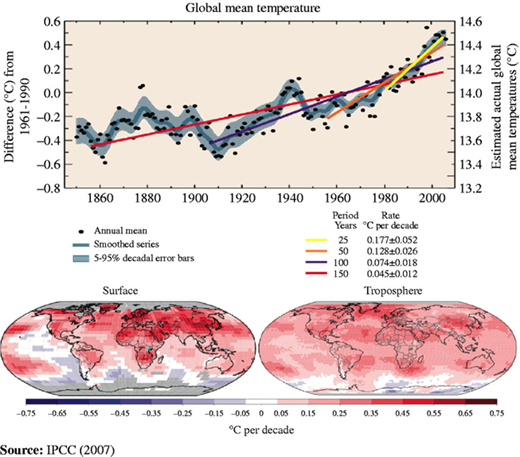
The global warming phenomenon of the recent times is attributed by a vast body of scientific research to anthropogenic activities, specifically to the industrial revolution which actually started in 1850s, but climatic records such as given in Figure 2 reveal significant rising trend to appear around 1950. It is therefore relevant to use observations of stations where records are available from 1950 onwards, if not earlier, to project future temperatures. Emanuel (2008) reports a general decline of atmospheric temperature during the period 1950‐80 which may be attributable to anthropogenic contributions of sulphate aerosols into the atmosphere. The dominant effects of anthropogenic contributions of greenhouse gases into the atmosphere as is experienced today therefore can be assumed to start around 1980. This study looks at trends from 1950 onwards and also after 1980.
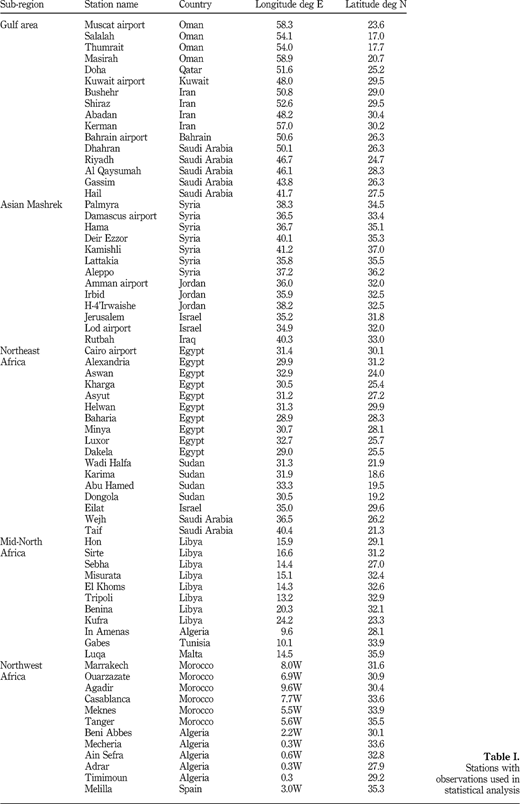
For the Gulf area annual temperature data of 16 stations have been analysed in this study. Most of the stations are on the coast. The name and location of the stations whose observations have been analysed in this study are given in Table I. The average temperature gradient for the Gulf area has been found to be 0.029°C per year after 1980. All the stations showed a positive gradient except Muscat. Muscat has a negative gradient of (−)0.014°C/year. The gradient of the stations which are rapidly growing metropolitan areas are significantly higher than non‐metropolitan areas. Kuwait has a gradient of 0.05°C/year and Riyadh has a gradient of 0.04°C/year. Alkolibi (2002) reports that Riyadh has the highest temperature gradient in Saudi Arabia and attributes that to the heat island effect. Dhahran is the only other station that records a negative gradient but the downward trend continues only from 1950 to 1975 and then there is an upward trend. None of the trends are statistically significant which is a similar conclusion arrived at by Zhang et al. who state that “trends over the south, the desert areas of Saudi Arabia and Iran, are generally not significant”, but using the non‐parametric sign test (Miller and Miller, 1999, p. 529) to elicit a qualitative answer to the question if there is a significant temperature rise or not, 15 out of 16 spatially distributed stations recorded a rise which translates, according to the sign test, to having a significant temperature rise in the region occurring since 1980.
Annual temperature data from the 13 stations in the Asian Mashrek analysed in this study revealed rather surprisingly that all stations except Rutbah have consistent declining trends from 1950 to 1980 and then consistent rising trends. The longest record available is at Jerusalem. It manifests an increasing trend of 0.011°C/year from 1880 to 1960, then a declining trend from 1960 to 1983 at (−)0.09°C/year, and thereafter an increasing trend of 0.055°C/year. The average rising trend for all 13 stations since 1980 is 0.045°C/year, the worst being Amman at 0.067°C/year. Therefore, this region is now experiencing a sharper gradient than the Gulf area in recent past. None of the slopes are statistically significant but using the nonparametric sign test we can conclude that the temperature rise in the region is significant.
Stations from Northeast Africa presented more spatial variability than the previous two regions. Among 17 stations whose data have been analysed, three stations with long records (Aswan, Asyut, and Helwan) showed a cyclical trend, which has a trough around 1900, a peak around 1940, a trough again around 1980 and then rising to date. The average temperature gradient since 1980 is 0.041°C/year, the highest being in deep inland at Dongola at 0.075°C/year and the lowest being at Karima at 0.028°C/year. Again using the nonparametric sign test we can conclude that temperature rise in the region is significant.
Data analysis of 11 stations for Mid‐North Africa showed that all stations have non‐negative trends in annual temperature except Misurata and Luqa. These two stations recorded falling trends between 1950 and 1980 and rise thereafter. The average annual temperature gradient since 1980 is found to be 0.042°C per year. Similar to other areas, the coastal stations manifested generally lower gradients than inland places. The lowest gradient is 0.012°C/year at Benina and the highest gradient is 0.06°C/year at Sebha. Using the nonparametric sign test we can conclude that temperature rise in the region is significant.
In the Maghreb area data from 12 stations have revealed that the average annual temperature gradient since 1980 is 0.039°C per year, the lowest being 0.029°C/year at Marrakech and the highest being 0.06°C/year at Agadir. It is rather surprising to see Agadir to have the highest gradient since it is on the coast. Perhaps, the influence of the Atlantic ocean on this sub‐region is less than expected due to predominant wind direction from east to west. Again, using the nonparametric sign test we can conclude that atmospheric temperature rise in the region is significant after 1980.
Figure 3 captures and summarises the annual gradients of temperatures as described in the previous paragraphs for the period 1980‐2004. Since the focus of this study is change in temperature rather than the absolute values, the gradients are given as degrees Centigrade per year.
Trends in temperature distribution
To determine trends in distribution pattern of temperature, quantile regression (Chamaille‐Jammes et al., 2007) of monthly temperature data of some important population centres in each region for the period 1950‐2004 has been done in this study. In this method, quantiles of observed data for a station for each year are estimated and then regression analysis of a quantile over the years is performed. After doing the analysis it has been found that for Riyadh (Gulf area), the slope of the lower quantiles is around 0.004°C/year which means the minimum temperatures have changed little, but the slope of the median and higher quantiles are in excess of 0.05°C/year, which implies warmer months are getting hotter and the highest slope is in the maximum temperature with a gradient of 0.068°C/year. For Bahrain, the slope in the lower quantiles is slightly negative (−0.005°C/year), which means that the cold days are getting colder; the median temperature has the highest gradient (0.02°C/year); and the maximum temperature has a gradient of 0.014°C/year – this implies that the minimum or the maximum temperatures have not changed much but the number of warmer days has increased. For Deir Ezzor (Asian Mashrek), the gradient of lower quantiles is (−)0.01°C/year, which means cold days are getting colder; the median and higher quantiles have a gradient of 0.02°C/year, which means moderate and warm days are getting warmer. For Aswan (Northeast Africa), all the gradients below the median are negative and all the gradients above the median are positive, which means winters are getting colder and summers are getting warmer – the maximum negative gradient (−)0.022 is in the first quartile and the maximum positive gradient 0.021 is in the third quartile. For Tripoli (Mid‐North Africa), the lower quantiles have negative gradients and the upper quantiles have positive gradients, which implies that the cold days are getting colder and the warm days are getting warmer – the gradient of the maximum temperature is 0.034°C/year. For Marrakech (Maghreb), all quantiles have positive gradients of around 0.04°C/year implying a uniform rise in temperature across seasons. These results agree in general with the findings reported in Zhang et al.
Trends in precipitation
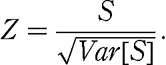
To analyse the precipitation characteristics of MENA, perhaps the most important feature that confronts an analyst is that the area is predominantly semi‐arid to hyper‐arid with a plethora of zero values in rainfall data of almost all stations. This will distort the outcome of any parametric analysis. Furthermore, there are many missing values, and because of low network density, any data imputation process is difficult. Therefore, a nonparametric approach, Mann‐Kendall (M‐K) test (Xu et al., 2005), which is the World Meteorological Organization's (WMO's) recommended method has been adopted to explore significant trends in precipitation, and only annual rainfall values for stations with significant rainfall amounts are considered because in many stations there is no rain for the entire period of record only interspersed with few storm events, which makes trend analysis a meaningless exercise. M‐K test can only indicate the direction but not the magnitude of significant trends (USGS cited in McBean and Motiee, 2008). The test statistic for the M‐K test for a time series xi of length n is given as follows: Equation 1 The variance of S is given by: Equation 2 and for hypothesis testing for the significance of the trend, the computed Z‐statistic is given as: Equation 3 Statistical significance in this study is assumed to be at 5 percent level of significance which is the standard practice.
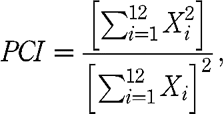
To assess the trend in intra‐annual variability of data, precipitation concentration index (PCI) has been computed for each station using the following formula which is given in Ceballos‐Barbancho et al. (2008): Equation 4 where Xi is the precipitation amount in month i.
PCI values of lower than 10 indicate a uniform distribution of the monthly rainfall throughout the year, values between 11 and 20 denote the distinct presence of seasonality, and values higher than 20 indicate high variability in the monthly distribution of rainfall with a concentration lasting one or two months.
For the Gulf region it has been found in this study that there is in general a positive slope in the annual rainfall trend with an average value of 0.05 mm/year, but the M‐K test shows the trend is insignificant for all stations. The PCI ranged between 20 and 25 with consistent positive trends indicating somewhat increased seasonality in rainfall.
For the Asian Mashrek region there is in general a negative slope in the annual rainfall trend with an average value of −1.50 mm/year though the slope tends towards positive as we move from east to west, but the M‐K test shows the trend is insignificant. The PCI ranged between 16 and 20 with no consistent variation in seasonality of rainfall. However, Evans (2010) report from analysis of FAO data that there is a strong increase of precipitation northward and outward from the deserts of Saudi Arabia, eastern Jordan, western Iraq and southern Syria, toward the mountains, and the Mediterranean Sea.
For Northeast Africa large storms occur once in many years which introduce large perturbations in data. After removing the outliers identified by box plots, slight positive slope could be noticed in general with filtered data, and the M‐K test showed the trend is insignificant except in Taif where a Z value 2 was obtained with a positive slope showing significance at 5 per cent level of significance. The PCI ranges between 15 and 20 showing somewhat increased seasonality in rainfall.
For the Mid‐North Africa about half the stations have increasing slope and the rest have decreasing slope in the coastal areas but the M‐K test shows the trend is insignificant. For inland stations there is practically no rain ever. The PCI ranged between 14 and 18 for stations with significant rain showing little variation in seasonality of rainfall.
For the Maghreb region there is in general a negative slope in the annual rainfall but the M‐K test shows the trend is insignificant. The PCI ranged between 10 and 15 with no consistent variation in seasonality of rainfall.
Trends of climate indices
The joint WMO CCI/CLIVAR Expert Team on Climate Change Detection, Monitoring and Indices (ETCCDMI) came up with 27 indices for climate based on temperature and precipitation. Some of these indices can be useful for water resources planners. The description of these indices can be found in Zhang et al. The indices which the author considered important for water resources projects were analysed in this study.
For the Gulf region, ETCCDMI indices of number of hot days (SU), number of warm nights (TR), maximum daily temperature (TXx), minimum daily temperature (TNn), annual minimum of maximum daily temperature (TXn), annual maximum of minimum daily temperature (TNx), diurnal temperature range (DTR), maximum 24 hour precipitation (RX1) and maximum number of consecutive dry days (CDD) showed through M‐K test, respectively, trends as flat, rising but insignificant, flat, rising but insignificant, flat, rising but insignificant, flat, both rising and falling but insignificant with too much variability, and falling but insignificant.
For Asian Mashrek region, the ETCCDMI indices SU, TXn, TNx, RX1 and CDD showed through M‐K test, respectively, trends as rising but insignificant, flat, flat, rising but insignificant, and rising but insignificant. Among the significant indices: TR is rising significantly at 5 per cent level of significance, TXx is rising significantly in some stations, TNn is rising significantly in most stations, and DTR is falling but significant only in a few stations of the east.
For Northeast Africa region, the ETCCDMI indices SU, TNn, TXn, RX1 and CDD showed through M‐K test, respectively, trends as rising but insignificant, flat, flat, falling but insignificant, and falling but insignificant. Among the significant indices: TR is rising significantly, TXx is rising significantly in majority of stations, TNx is rising significantly in some stations, and DTR is falling but significant only in inland stations.
For Mid‐North Africa region, the ETCCDMI indices SU, TXx, TNn, TXn, TNx, RX1 and CDD showed through M‐K test, respectively, trends as falling in most stations but insignificant except Kufra where the fall is significant, falling consistently in all stations but insignificant, rising consistently in all stations but insignificant, falling consistently but insignificant, flat, rising but insignificant, and flat. Among the significant indices: TR is rising significantly in most stations and DTR is falling consistently but very significant in a few stations.
For the Maghreb region, the ETCCDMI indices SU, TR, TXx, TNn, TXn, TNx, DTR, RX1 and CDD showed through M‐K test, respectively, trends as falling but insignificant, rising but insignificant, falling but insignificant, rising but insignificant, falling but insignificant, flat, falling but insignificant, rising but insignificant, and rising in about half the stations and falling in the rest but insignificant.
Future projections
The effects of climate change are slow and may be masked for decades by natural variability in a region. For water resources project planning and operation, climate change is only worth considering when significant changes in temperature and precipitation would occur to shift the long‐term regime of evapotranspiration, crop growth cycle, water availability, water usage, and water temperature in surface reservoirs. This calls for long‐term projections. Not many forecasting tools are available to make long‐term projections of a variable especially when the variable is non‐stationary. In this section projections of atmospheric temperature and precipitation are presented from two types of forecasting tools – one is physics‐based models namely General Circulation Models (GCMs) and the other is statistical methods.
Predictions from GCMs
GCMs are the primary tools available today for climate projections. These are numerical representation of the dynamics of the earth's atmosphere, ocean, cryosphere and land. Many different GCMs are in operation with different assumptions and parameterizations of the physical processes – modelling the entire world in grid‐points with typical grid sizes of 150‐300 km. Due primarily to poorly understood ocean circulation processes, difficulty to include sub‐grid scale processes such as cloud formation, and need to lump hydrological processes there are variations in assumptions that each GCM uses. Different assumptions and approaches lead to no two GCMs to yield the same result. Despite widely varying outputs, they are found useful because certain GCMs simulate well certain areas and others simulate well other areas (Matondo et al., 2004).
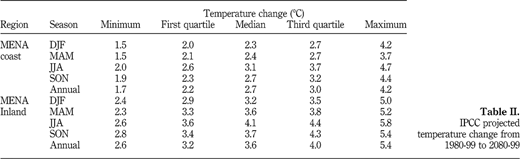
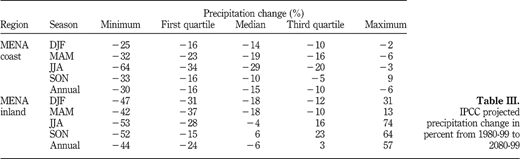
To predict future temperature and rainfall, IPCC (2007) collated the findings from 21 GCMs, to estimate the change from the base year 1980‐99 to 2080‐99 with the A1B scenario. The scenarios are described in SRES (Special Report on Emissions Scenarios) contained in the third assessment report of IPCC, which capture possible future developments under four narrative storylines – A1 (world markets), A2 (state enterprise), B1 (global sustainability), and B2 (local stewardship) – no scenario is more likely than the other. A1 storyline with rapid economic growth has three technological emphasis: fossil intensive (A1FI), non‐fossil energy sources (A1T) or balanced energy (A1B). IPCC's (Regional Climate Projections, Chapter 11, Working Group 1, Fourth Assessment Report) future projections for MENA as to temperature change (°C) are given in Table II and for precipitation change (per cent) are given in Table III.
A literature search by the author on the application of GCM or RCM (Regional Climate Model) specifically for MENA revealed that very little work has been done on this part of the world perhaps primarily because of the dearth of data. Rosenzweig and Tubiello (1997) mention the application of three GCMs – GISS developed by NASA, GFDL developed by Geophysical Fluid Dynamics Laboratories, and UKMO developed by UK Meteorological Observatory – for the Mediterranean portion of MENA. They concluded that by doubling of atmospheric carbon dioxide mean annual temperature would increase in the range 3.5‐5.5°C and seasonal precipitation gradients would widen. Husain and Chaudhary (2008) applied three GCMs (Hadley Centre's HADCM3, Canadian CCMa, and NCAR) to the Gulf region and predicted for A2 scenario over a century a temperature rise between 1.33 and 3.37°C and precipitation change from −157.4 mm to 485.9 mm per annum. Onol and Semazzi (2009) applied an RCM ICTP‐RegCM3 coupled with NASA's GCM fvGCM to the eastern Mediterranean portion of MENA. They found that for the A2 scenario temperatures would increase by 2‐4°C and precipitation would decrease by 20‐60 per cent in some areas. Alpert et al. (2008) applied the same models to Israel and besides reporting similar results concluded that there is a tendency towards extreme weather events. Evans (2009) in examining A2 scenario with 18 GCMs for IPCC reports for the Middle East that mean temperature rise from 2005 to 2095 will be 3.95°C and mean decline in annual precipitation for the corresponding period will be 25.45 mm. He identifies an increase in precipitation in the south (due to northward movement of inter‐tropical convergence zone) which agrees with historical observed trend in the Gulf region. Conway and Hulme (1996) found that in the Nile basin annual precipitation would decrease by 2 per cent using GFDL and increase by 7 per cent using GISS for doubling of carbon dioxide. Alkolibi (2002) makes some general remarks from the findings of several GCMs and states reduced likelihood of rain in MENA and increased desiccation of Arabian Peninsula.
Ramanathan and Feng (2009) point to the likelihood that GCMs in general may be exaggerating global warming. According to them the amount of radiative forcing required to increase atmospheric temperature by 1°C at the surface of the earth is 3.3 W/m2, but GCMs reported in IPCC use 1.25 W/m2 for 1°C rise in atmospheric temperature. The reason for using a lower value is positive feedback on climate from global warming, which includes phenomena such as melting of ice into water will reduce reflection of solar radiation into space and higher temperature would increase evaporation resulting in more atmospheric humidity which in turn will trap more of earth's radiation because water vapour is one of the strongest greenhouse gases. GCMs fail to account for negative feedback such as global dimming from pollution. If negative feedback is included in the modelling of GCMs, predictive scenarios of global warming would have less pronounced changes.
Statistical predictions
There are many types of statistical models available for predictions. The basic premise with many of the statistical models is that the process is stationary. Where the process is stationary or the data can be transformed to be stationary, Box and Jenkins type of models are the most popular, but they are reliable only for short forecast lead time. In fact, for a forecast lead time of the order of 50 to 100 years especially when the process is non‐stationary, which is the fundamental hypothesis of this study that the earth is changing in unprecedented ways, there is no reliable statistical model available. Therefore, sticking with the basic regression technique, extrapolations of the past trends were made into the future. Regression techniques for long‐term prediction of atmospheric temperature and precipitation have been used before by McBean and Motiee (2008). In order to remove short‐term variability of data a 9‐year moving average (MA) of annual values of temperature data of all stations in each region were computed. This was done based on visual effects of smoothing on data and appeared to perform better than the 7‐year MA reported in a report of USAID (2005).
The underlying hypothesis has been that by performing spatial and temporal smoothing, the long‐term trend would appear as the filtrate, which can be used for long‐term projection. Table IV presents such linear extrapolated values for different regions. The long‐term projections were made using at least 50 years of data because it was deemed that using only data after 1980 is too short a period to make such a long‐range projection. However, since temperature rise during the period 1950‐1980 has been modest for most stations and negative for some stations, the projected values using the gradients after 1980 are also given in Table IV. In order to gauge uncertainty with such projections, the 95 per cent confidence interval estimated for the gradients after 1980 are used to provide an interval estimate of projected temperature in Table IV as well. To gauge visually the probability of current temperature regimes exceeding, the probability distribution of projected temperatures that follows from normality assumption of errors in regression technique are given in Figure 4 with after 1980 observations.
To forecast precipitation, annual precipitation sums of all stations in a region were taken and 9‐point MA values were estimated and future projections have been made in a similar fashion as with temperature. The results are given in Table V. Obviously, the summing process unlike temperature gave more weight to stations with higher precipitation amounts. Such bias is not undesirable while estimating water availability over a large basin because it is the cumulative amount of water that is of most interest in water resources planning. Table V also provides 95 per cent confidence interval of the projections based on confidence interval estimate of the slope. The gradient only for the period after 1980 was not considered because of high variability and too short a period in data which caused negative precipitation to be included in the confidence interval estimate for the slope. To get a visual impression of the probability of rainfall regimes being lower or higher than the current regimes, the probability distributions of changed rate of precipitation in percent for all regions are captured in Figure 5 around the projected mean.
Climate change related adaptation considerations for water resources projects
Following the adoption of food security concept in 1970s MENA region now uses over 80 percent of its water supply for agriculture (The World Bank, 2007). Agriculture as a sector is quite vulnerable to climate change. Increased temperature would cause more evaporation resulting in more system loss in irrigation systems. Increased evapotranspiration would require more water for crops. There are many studies available in published literature that report on the effect of increased temperature and atmospheric carbon dioxide on crop yield especially through simulation runs of crop models such as CERES (Tao et al., 2008). Wasimi (2006) presents the findings of an analysis of how different crops react to differences of temperature and water availability at different stages of their growth from field data. Conversely, reduction of minimum temperature could increase instances of frost. Frosts damage standing crops. Other important considerations of temperature change are: Increased temperature may increase disease and pest incidences, and temperature changes may call for shifting of crop calendar which would change delivery schedule of an irrigation project.
For dam projects increased temperature would translate to increased loss of stored water primarily through evaporation. Increased temperature may favour parasitic growth in reservoirs affecting water quality (Bonetto et al., 1987) resulting in increased treatment costs. Where dams provide municipal water supply, experience shows that domestic water consumption increases with increased atmospheric temperature. This not only puts additional demand on water supply provisions but also creates further problem by generating more wastewater. Proper treatment and disposal of wastewater is vital for a healthy community, prevention of contamination of groundwater, and for environmental quality. The cost of excess wastewater treatment can be much higher than the increased cost of additional water supply. However, wastewater reuse is already being pursued in many countries including UAE, Oman, and Kuwait which adds extra value and justification to treatment costs. In Amman, Jordan a new wastewater treatment plant has been built that is 95 per cent self‐sufficient in energy because the gas turbines are powered by digestion biogas, and treated effluent has potential for agricultural and industrial reuse (Samra Plant Company, 2008).
Reduced precipitation from climate change would reduce capacity of surface water sources to meet demands which would undoubtedly increase strain on groundwater resources. Already water is being pumped from groundwater at a rate at which it cannot be replenished by precipitation (The World Bank, 2007). If the current rate of groundwater extraction continues, the quality of water will deteriorate by brackish water that is extensively present in the region in deeper parts of the aquifers. Already in Dammam aquifer system, which extends from Saudi Arabia to Bahrain, upcoming brackish water from deeper aquifers (Rus‐Umm Radhuma aquifer) and intrusion of seawater resulting from excessive lowering of water table have caused substantial deterioration of water quality (Khouri, 2003). Typically, the region contains groundwater in multilayered aquifer systems containing fine‐grained detrital sediments. Inelastic compaction of these argillaceous formations will not occur until water levels are lowered below a critical value. This critical value has already been reached in some areas as evidenced by collapse of sinkholes. These are multifaceted problems of increased need for water treatment, preservation of the quality of natural resources, and prevention of land subsidence which require integrated policy framework to regulate groundwater use and at the same time seek sustainability through recharge of groundwater.
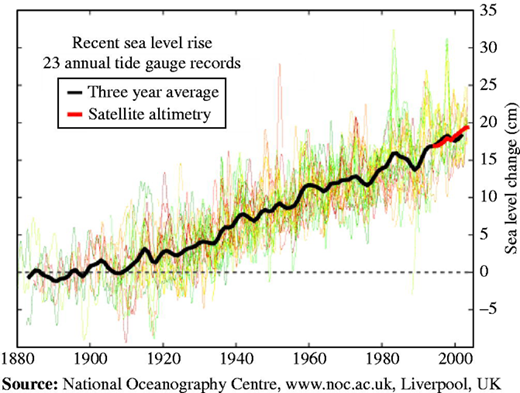
Where projects are planned for low‐lying coastal areas, an additional consideration is sea level rise. Sea level will rise due mainly to thermal expansion of ocean waters and melting of the land ice. Although this rise is not going to be spatially uniform because of ongoing geoid change, it will affect the coastal areas all over the world. Figure 6 shows the historical rise of sea level as observed through tide gauges. In the 20th century, the sea level rose by 0.8 to 3.3 mm/year with an average of 1.8 mm/year. Since 1993 satellite altimetry records a rising rate of 2.8 mm/year, however, it is unclear whether the record is actual variability or there have been problems with satellite calibration (Douglas, 1997). The Fourth Assessment Report of IPCC summarises from many GCM outputs the possible sea level rises from 1980‐99 values to 2090‐99 values. Table VI presents the projections. However, some analysts consider these projections as conservative and suggest that the actual sea level rise that may occur at the end of this century can be as high as 1.4 metres (Rahmstorf, 2007). From extensive published literature, it appears that IPCC projections on sea level rise can be considered as reliable. The areas in MENA which have been identified as vulnerable to sea level rise are primarily the delta areas of Nile, Moulouya, Sebou and Shatt‐el‐Arab (TS.8, Page 41, Parry et al., 2007, IPCC, 2007). Among these, the Nile delta has been identified as the most vulnerable. Areas where land accretion cannot keep pace with rising sea level will experience inundation, higher flood risk, water logging, salinity intrusion into estuaries and groundwater; and any water infrastructure planning in these areas should take a closer look into all these aspects. The problem would compound with the probability of increased extreme climatic events such as tropical cyclones. Singh et al. (2001) and Webster et al. (2005) cite evidences of intensification of tropical cyclones, which would require additional safety provisions from their adverse effects in design considerations.
Discussion
With the United States, China, and India – the largest emitters of greenhouse gases in the world – not being a signatory of Kyoto Protocol and no tangible benefit coming out of the Copenhagen Protocol, the future does not look bright for reduction of atmospheric greenhouse gases. Thus, global warming and climate change may continue unabated in effect for quite some time. Recent trends of atmospheric temperature and precipitation in MENA have been analysed in this paper which suggests that there is a clear manifestation of climate change in this part of the world. This part of the world is also least endowed with water resources which means it deserves most attention to factor in effects of climate change in its water resources planning and management.
On atmospheric temperature
Observations of recent trends in temperature and projections from GCM and statistical models all point to the fact that there will be an across the board rise in temperature in MENA. The rise will be more in inland areas than in coastal areas and more in maximum temperatures than in minimum temperatures. Asian Mashrek region experienced rather decline in temperature during the period 1950‐1980; the region may now experience the highest gradient in temperature increase. The gulf region surrounded by seas is experiencing relatively modest rise in temperature. Observations in many locations point to the fact that the gap between minimum and maximum temperatures is widening which implies that effects of lowering of minimum temperature should be taken into consideration where minimum temperatures have an effect on water resources projects.
Considering the recent trend of temperature rise since 1980, the IPCC forecasts rather appear to be conservative. If no mitigation measures are adopted and emission of greenhouse gases continues unabated, the rise of atmospheric temperature is likely to be higher than that projected by IPCC.
On precipitation
Trends in recent history, projections from GCMs, and linear extrapolation values agree in some aspects overall on trends of precipitation amounts but differ in variability. All point to changes, which is indicative of the fact that there will be changes in precipitation regimes. Station to station variability has been so much that no significant trend could be identified in any region with the observations, however with spatially and temporally averaged data it appears that Northeast Africa is most likely to experience significant reduction in precipitation, the Maghreb and Mashrek regions are also very likely to experience significant reduction in precipitation. The Gulf region and Mid‐North Africa along the Mediterranean coast may experience some increase in rainfall.
IPCC forecasts indicate that the seasonality of precipitation is likely to increase, low rainfall events would be less frequent and high rainfall events may even increase. The statistical predictions point to different variability than IPCC's for each region and the climate indices estimated in different regions do not tend to support IPCC's view so far. Precipitation is dominated by much smaller processes, such as landscape variation, which a coarse grid of a GCM cannot capture. This deficiency is sometimes addressed by dynamical downscaling into Regional Climate Models (RCMs), which is basically a nested modelling approach. However, Somot et al. (2008), Wang and Yang (2008) and others have demonstrated that dynamical downscaling may not be capable of providing adequate feedback loop to the parent model and therefore may not improve the accuracy. It is therefore perhaps logical to infer that the precipitation forecasts made by the GCMs and as presented by IPCC for the MENA region should not form a basis in the planning process for the water resources of a region, but rather statistical projections captured in Figure 3 are more reliable. Since statistical predictions are not based on observations made after 1980 only, more variability in precipitation is warranted for more conservative estimates.
On sea level rise
Sea level rise seems inevitable and if confirmed, this will have a profound effect in MENA coasts. Both models and observations point to sea level rise. The dynamics of the process is such that sea level rise will continue even if emissions are reduced and it will take lot longer than a century for the process to revert. Many water resources projects in coastal communities will need to factor in possible sea level rise – projects such as prevention of saline contamination of groundwater, seawall to protect from onslaught of storms or prevent erosion, water supply network along coastline, and other water infrastructures on coast are most exposed. Where costs are prohibitive, migration and planning for resettlement can be an alternative.
On extreme climatic events
In different parts of the world, global warming has been attributed to increased occurrences of extreme climatic events such as tropical cyclones (see, for example, Wasimi, 2009), but there is not sufficient recorded evidence that this is occurring in MENA since such events are rare. The cyclone Gonu that hit Oman coast with unprecedented ferocity in 2007 is widely believed to be the result of climate change. It is difficult to establish both numerically and statistically if one or two events are telltale evidence of a process. Nonetheless, dust storms in the region have increased several‐fold since 1950 (Goudie and Middleton, 2006), and that may indicate that climate change could induce extreme climatic events. The extreme climatic events would affect the coastal regions the most. However, on the positive side Gonu experience has demonstrated that big storms can break the drought spell replenishing water reservoirs of a region.
Conclusions
Projections from physics‐based GCMs suggest that atmospheric temperature would rise across the board in MENA. This rise is supported by statistically extrapolating the recent trends. Therefore, increased confidence can be placed in these projections of atmospheric temperature values and should be accounted for in future water resources planning and management. The rise in temperature, as manifest in recent observations, would have significant spatial variations and the year to year rise is going to be far from uniform. The study of temperature distribution at selected locations point to the fact that the quantile distribution is widening at least in some locations which means the minimum temperatures could be decreasing and the maximum temperatures increasing.
Precipitation projections from GCMs matched to some extent with statistical projections of recent observational trends. But the observed trends did not show any statistical significance due to high variability in data. This suggest that there would be greater uncertainty in precipitation, and design considerations in water resources projects should factor in greater variability in precipitation rather than either rise or fall of precipitation amounts for short‐term operation. There is increased likelihood that precipitation amounts will increase in the Gulf area and Mid‐North Africa and decrease in other regions.
The study of climate indices on daily data did not reveal any statistically significant trend in the Gulf area and the Maghreb region. But in other regions the nights are getting significantly warmer. In Asian Mashrek region maximum and minimum daily temperatures are experiencing significant rise. In mid‐North and Northeast Africa the diurnal temperature range is declining.
Undoubtedly, the water resources of MENA will experience the greatest strain due to adverse effects of climate change but research work has remained scanty in this regard. Water resources planners of nations in MENA have very little information available to them to base their future strategies to adapt to climate change. This paper is a modest effort to provide some insight of what to expect in general from climate change. Obviously, a paper with a broad scope such as this can by no means be comprehensive for a specific water resources project planning. Water resources practitioners should plan for climate change and accommodate what Lind (1997) describes as “dynamic flexibility” in strategic planning and management.


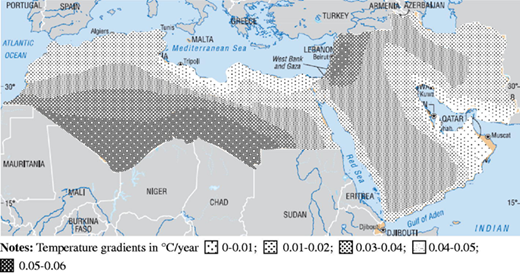
Trends in atmospheric temperature in MENA based on observations for the period 1980‐2004
Trends in atmospheric temperature in MENA based on observations for the period 1980‐2004
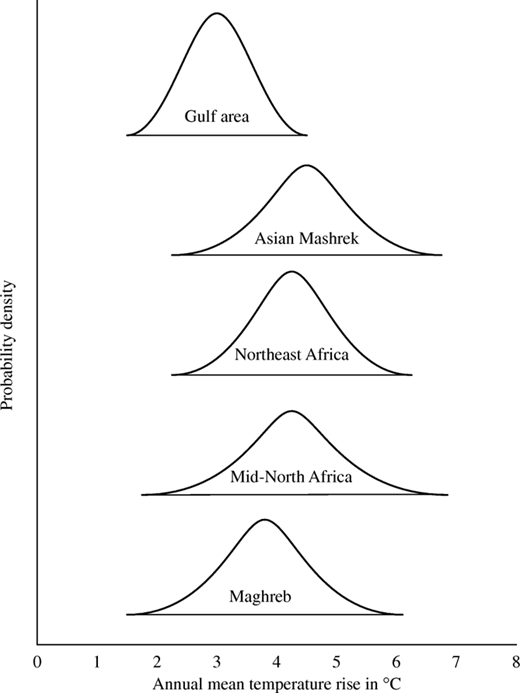
Probability distribution of annual atmospheric temperature rise from 1980 to 2080 for various regions of MENA using statistical predictions
Probability distribution of annual atmospheric temperature rise from 1980 to 2080 for various regions of MENA using statistical predictions
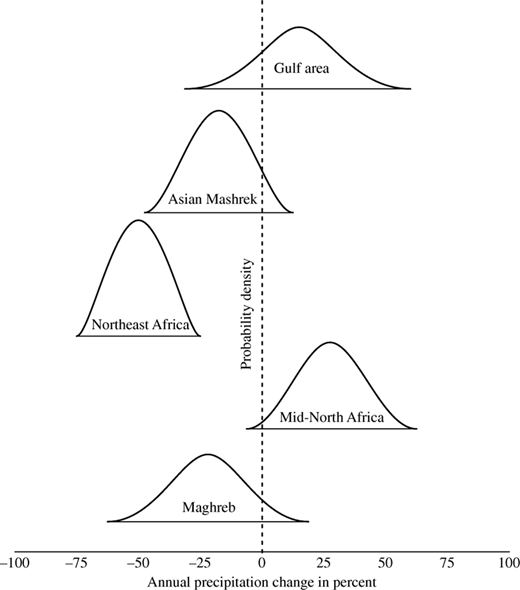
Probability distribution of annual precipitation from 1980 to 2080 for various regions of MENA using statistical predictions
Probability distribution of annual precipitation from 1980 to 2080 for various regions of MENA using statistical predictions
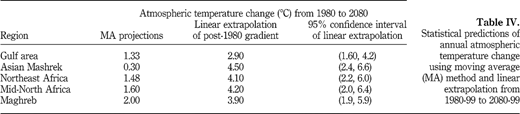
Statistical predictions of annual atmospheric temperature change using moving average (MA) method and linear extrapolation from 1980‐99 to 2080‐99
Statistical predictions of annual atmospheric temperature change using moving average (MA) method and linear extrapolation from 1980‐99 to 2080‐99
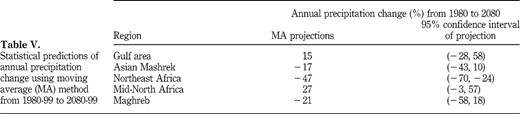
Statistical predictions of annual precipitation change using moving average (MA) method from 1980‐99 to 2080‐99
Statistical predictions of annual precipitation change using moving average (MA) method from 1980‐99 to 2080‐99

References
About the author
Saleh A. Wasimi joined CQ University in Australia in 1993 where he is currently working as an Associate Professor. As a professional he organized several international seminars and served in the editorial board of international journals. He has authored several books, book chapters, and over 50 research articles. Saleh A. Wasimi can be contacted at: s.wasimi@cqu.edu.au

