


The Indian state of Assam is situated in a high rainfall zone and the river Brahmaputra flowing through the state causes annual floods which adversely impact the agro‐economic base of the region. The situation is likely to become exacerbated under the impact of climate change. The purpose of this paper is to quantify the vulnerability of the farmers in Assam to floods in the scenario of the present climate variability taking a case study of the Majuli Island of Jorhat district.
The current vulnerability of the farmers in the Majuli Island of Jorhat district of Assam is quantified using the “indicator method”. A Composite Vulnerability Index is calculated taking into account various indicators reflective of the exposure, sensitivity and the adaptive capacity of the farmers' community to floods. The indicators have been quantified based on the data obtained from household surveys and participatory rural appraisals (PRAs) in the villages and secondary data sources.
The results show that biophysical factors have the greatest impact on the overall vulnerability of the study area and that strengthened adaptive capacity, proper scientific planning and management is required to protect the Majuli Island from the adverse effects of recurrent floods.
This paper shows that the more decentralized the spatial unit of vulnerability assessment is, the more helpful it would be for policy makers and stakeholders to formulate efficient mitigation measures, plan apposite developmental programmes and improve the adaptive capacity of Assam as a whole to face the natural phenomenon of floods.
1 Introduction
Agriculture and allied activities account for almost 25 per cent of the gross domestic product of India (TERI, 2003; Mall et al., 2006), with 68 per cent of the country's population being directly or indirectly dependent on them (O'Brien et al., 2004). This sector is likely to be negatively impacted by climate change and variability (Mall et al., 2006) with 60 per cent of the cropped area in the country being rainfed. While “climate change” is defined as “a statistically significant variation in either the mean state of the climate or in its variability, persisting for an extended period (typically decades or longer)”, “climate variability” refers to the:
[…] variations in the mean state and other statistics (such as standard deviations, the occurrence of extremes, etc.) of the climate on all temporal and spatial scales beyond that of individual weather events.
It may result from natural internal processes within the climate system or from variations in natural or anthropogenic external forces (IPCC, 2001).
There is a general scientific consensus that the susceptibility and the adaptive capacity of a sector to climate change in the long term is a function of its present vulnerability and its ability to cope with the current climate variability (Spanger‐Siegfried and Dougherty, 2005; Thomalla et al., 2006; Prabhakar and Shaw, 2008). “Vulnerability” of a system is “the degree to which a system is susceptible to, or unable to cope with, adverse effects of climate change, including climate variability and extremes” (IPCC, 2001). Mathematically, it is expressed as (Brenkert and Malone, 2005): Equation 1 Here “exposure” refers to “the nature and degree to which a system is exposed to significant climatic variations”, “sensitivity” to “the degree to which a system is affected, either adversely or beneficially, by climate‐related stimuli” and “adaptive capacity” is defined as:
[…] the ability of a system to adjust to climate change (including climate variability and extremes) to moderate potential damages, to take advantage of opportunities, or to cope with the consequences (IPCC, 2001).
A wide variation in the vulnerability of similar systems or sectors across different regions is expected as a consequence of regional differences in local environmental conditions and pre‐existing stresses to ecosystems (IPCC, 1997). Such regional variations can also be attributed to the differences in the socio‐economic states of the exposed communities (Das et al., 2009). In India, a number of studies have evaluated the vulnerability of various sectors to climate change. However, at the regional or local level not many studies of vulnerability assessment have taken place in India.
The North Eastern Region (NER) of India, comprising the eight states of Arunachal Pradesh, Assam, Manipur, Meghalaya, Mizoram, Nagaland, Sikkim and Tripura, is believed to be highly vulnerable to the impacts of climate change because of its geo‐ecological settings and fragility, heavy dependence on monsoon rains, massive deforestation, socio‐economic instabilities and occurrence of natural disasters like floods, droughts, cyclones and earthquakes (Das et al., 2009). The Brahmaputra and the Barak rivers drain this region. Although it is the presence of these rivers which has led to agricultural prosperity in certain parts of the region, these, especially the Brahmaputra, are also responsible for various water induced disasters like annual floods, flash floods, river‐bank erosion, and sand casting (Das et al., 2009). With 40 per cent of its land surface susceptible to flood damage, the Brahmaputra valley of Assam represents one of the most acutely hazard‐prone regions in the country, having a total flood prone area of 3.2 million ha (Das, 2005). Floods in Assam are caused by a combination of natural and anthropogenic factors and some large‐scale flood related damages were observed in the years 1954, 1962, 1966, 1972, 1977, 1984, 1986, 1988, 1998, 2000, 2002 and 2004, 2007 and more recently in Goswami (2008, undated). These floods affect the farming community the most, destroying crops and large areas of arable land and property (Das et al., 2009).
Past flood records have shown that the damage potential, intensity and frequency of floods have increased significantly over the years. This situation will, in all probability, be exacerbated under the climate change scenario as the projected changes in the hydrological cycle due to the influence of climate change and variability are likely to alter precipitation patterns resulting in changes in river runoff (Sharma et al., 2009) with negative implications for infiltration and groundwater recharge (Goswami, 2006).
The present study attempts to quantify the vulnerability of the farmers in Assam to floods in the context of the present climate variability, based on a case study of five villages within the Jorhat district. Since vulnerability assessment reflecting micro‐level contexts are suitable for planning local adaptation to climate change, this analysis is attempted at two spatial scales – at the district and village level to emphasize that even the same sector within a single region (say, a district) may be under the influence of a complex interplay of differing ecological and socio‐economic factors when considered at a more decentralized level (say, different villages within the same district), thereby requiring a different set of adaptation strategies.
2 Materials and methods
2.1 Study area
Assam, situated between 24°08‐27°59' N and 89°42'‐96°01' E and covering an area of 78,438 km2, is drained by the mighty Brahmaputra‐Barak river systems and their tributaries. The Brahmaputra valley in the northern part of the state is a flat plain arising out of the depositional works of the river. Its geographical location and physical features make the state prone to natural disasters. The south west monsoon influences the region from June to September contributing more than 80 per cent of annual rainfall (Jamir et al., 2008). Besides, the valley also gets a good amount of rainfall in the month of April and May due to thunderstorm activities which lead to flooding during heavy rain in June. The Barak River flows through a valley in the southern part of Assam and is surrounded by North Cachar Hills, Manipur and Mizoram.
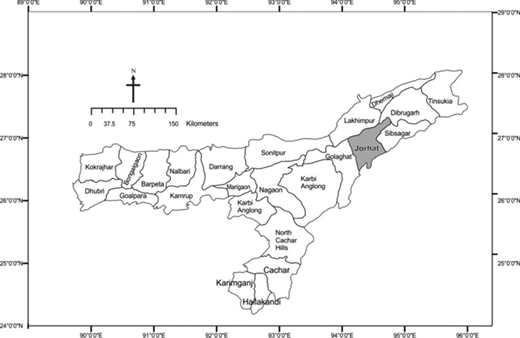
Regional census shows that some of the worst flood affected districts in Assam are Dhemaji and Lakhimpur. However, these districts were inaccessible to the researchers as the study was carried out during the rainy season and hence the nearest accessible district, which is also badly flood affected, was chosen. The Jorhat district (27°35'−26° 30' N and 93° 45'−94°30' E), selected for the study (Figure 1), is situated on the south bank of River Brahmaputra in Assam. As per the 2001 census, the total population of Jorhat is 1.09 million and 83 per cent of them live in rural areas. People in this region are largely dependent on natural resources for their subsistence which makes them highly vulnerable to increasing climate variability.
The climate of Jorhat is mesothermal wet. January is the coldest month with an average temperature of 6.1°C. July and August are the hottest months with an average monthly temperature of about 29°C. The yearly average relative humidity is 78.7 per cent (Central Ground Water Board, 2008). The average rainfall for the June‐September (JJAS) period has been estimated to be about 960 mm for the years 2000‐2007 (Water Resources Department, Government of Assam, 2000, 2001, 2002, 2003, 2004, 2005, 2007). The district faces the vagaries of extreme rainfall especially during the summer monsoon (Table I).
The villages surveyed are located on the Island of Majuli (26°45‐27°15′N and 93°45‐94°30′E), in the northern part of Jorhat. The total area of Majuli is 421.65 km2 as per 2001 census. Majuli was the world's largest inhabited river island with an area of 1,256 km2 (1891), but it has been shrinking in size over the years primarily due river‐bank erosion rendering hundreds homeless especially during floods (Sarma and Phukan, 2004). The total population of Majuli is 150,000. The villages studied include Botiamari, Balisapori, Guwalgaon, Juginidhari and Satra Bengenaati, with population density of 55, 1.2, 2, 2 and 3 persons per kilometer square, respectively. All of them are situated in lower Majuli. The selection of these five villages was based on statistics on worst flood affected areas available at the block offices (Government of Assam).
2.2 Approach adopted
In order to assess the farmers' vulnerability to floods, an indicator‐based approach was adopted. “Indicators”, in general, are defined as “variables (not values) which are an operational representation of an attribute, such as quality or/and characteristics of a system” (Gallopin, 1997). Specifically so far as vulnerability assessment goes, an indicator is:
[…] an operational representation of a characteristic or a quality of a system able to provide information regarding the susceptibility, coping capacity and resilience of a system to an impact of a disaster (Birkmann, 2006).
Vulnerability is commonly characterized as a function of three defining factors – exposure, sensitivity and adaptive capacity, which basically concerns a coupled human and environmental system. Thus, there are three‐dimensional components that must be integrated into the vulnerability assessment irrespective of the differences that may exist in the levels or intensities of the three components. This requires a framework for selecting indicator criteria that characterize the vulnerability of the coupled human‐environment system. Indicators are commonly used to monitor trends on regional and national scales and, should not be confounded with a method that seeks to inform stakeholders of a place‐base specific reaction in response to climate change impacts. It is therefore important to elucidate existing local knowledge bases for any existing adaptation strategies within a community as part of the evaluation of adaptive capacity. Stakeholder interests (past, present or future interest) play important roles in vulnerability assessment.
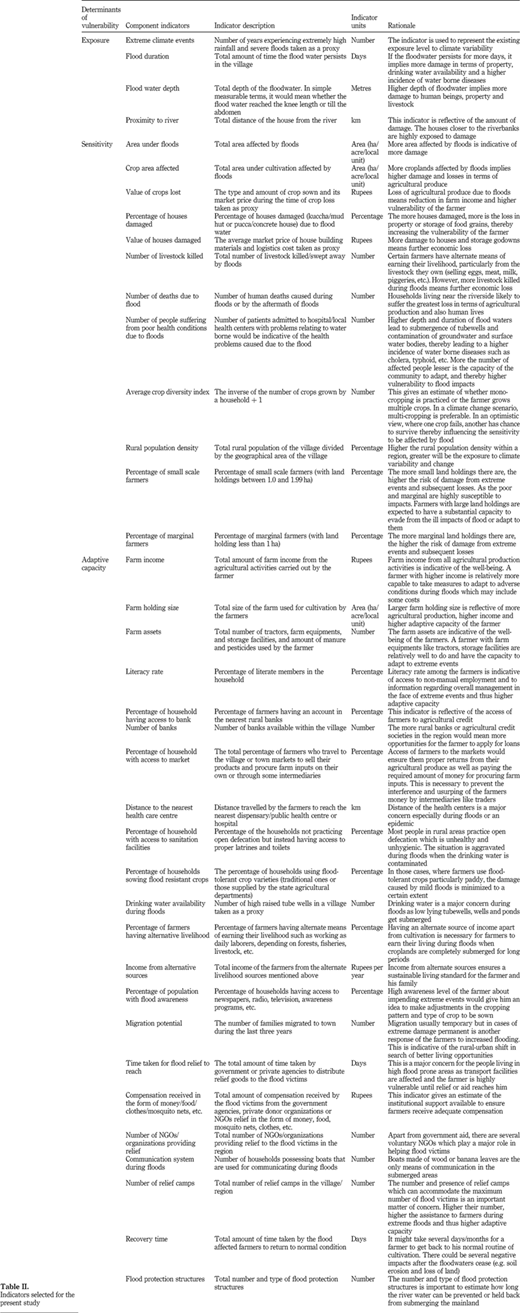
Going by this definition, in the present context, indicators are variables which are reflective of the exposure, sensitivity and the adaptive capacity of the farmers with respect to climate‐induced extreme events such as floods in the agriculture sector. Accordingly, the first step was to identify the indicators relevant for the present study and categorize them in terms of their representativeness of exposure, sensitivity or adaptive capacity. Selection of indicators was based on literature review, availability of secondary data and on the practicality of collecting the required data from village survey method. The indicators, grouped under the respective heads are in Table II.
In order to quantify each of these indicators, household questionnaire surveys and participatory rural appraisals (PRAs) were conducted in the villages. From the household survey questionnaires an understanding of the intensity and impact of flood in the last decade, situation of flood relief and awareness among the villagers, the farmer's farm produce and income, source of irrigation, situation of drinking water and sanitation facilities, other socio‐economic conditions like access to health care, market, transport facilities was gained. Some of the questions inter alia that were asked to the farmers during the survey are:
What is the total area of land owned by a household/farmer?
What is the area under farm?
What use is made of the land that is not used for farming?
What is the livestock population in the household?
What are the sources of irrigation?
Which is the most common source of drinking water?
Is there any scarcity of water in the area during floods?
Is there any provision of drinking water storage during floods?
What distance is generally travelled to sell the products and to procure the farm inputs and what mode of transport is used?
What is the average depth of flood water?
What is the average duration till which the flood water remains in the village and farmlands?
What is the average value of crop that is destroyed during floods?
What is the number of livestock lost by the farmer during floods?
What is the average number of human deaths during the floods?
What is the number of patient admitted to hospital/local health centres with problems relating to water borne diseases?
What is the number and capacity of flood relief camps?
What kind of flood protection structures is present in the village?
The field work for the collection of data through household survey and PRA was conducted in the month of May 2010. Based on the response of farmers in the course of the household survey and PRA, the mean, minimum and maximum values for each of the above indicators were obtained.
For the indicators which could not be quantified by the survey approach, such as the literacy rate and the rural population density, secondary data from office records was used. Also, proxies had to be used for some of the indicators (Table II). Obtaining data on the amount of farm produce from crops and livestock and calculating the market price of each of them gave an estimate of the farm income and income from alternative sources of livelihood.
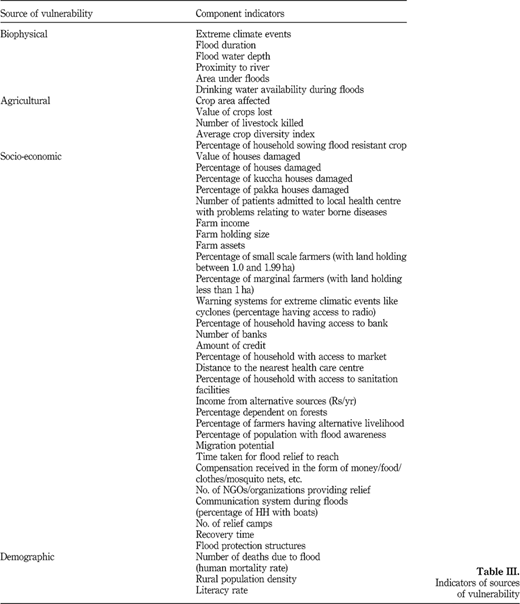
Since the indicators were varied and were measured in different units, it was essential to normalize them (render them unit less) in order to aggregate them into a single value (dimension index). Normalization of the values for each of the indicators was carried out following Patnaik and Narayanan (2005) by using the formula given below: Equation 2 The basis of classification of the indicators was in terms of the three functions of vulnerability, i.e. exposure, sensitivity and adaptive capacity (Table II). The indicators could be also classified on the basis of sources of vulnerability: demographic, biophysical, agricultural and socio‐economic (on the lines of Patnaik and Narayanan, 2005), as shown in Table III.
For each of the sources of vulnerability hereby identified, an average index was calculated by taking a simple mean of the normalized indicator values by using the following formula (Patnaik and Narayanan, 2005): Equation 3
I1 … Ij = Indicators reflective of source of vulnerability i.
J = Number of indicators reflective of source of vulnerability i.
During the PRA, the farmers were asked to rank the sources of vulnerability (biophysical, agricultural, socio‐economic and demographic) on a scale of 1‐4 based on their own perceptions regarding the contribution of each source to the overall vulnerability. These ranks were then assigned as weights to the average indices calculated for each source and then the aggregated or the Composite Vulnerability Index was calculated using the following formula: Equation 4 where:
V = Composite Vulnerability Index.
Weight i = rank assigned to source of vulnerability i.
n = number of sources of vulnerability
α = order of the norm.
{α norm is defined as ‖x‖a=[∑i=1n(|x|i)α]1/α} (Golub and Van Loan, 1996).
The Composite Vulnerability Index (V) hereby derived was taken to be representative of the agricultural vulnerability of the farmers of the district with respect to floods.
Using the same method, the Composite Vulnerability Indices, representative of the climate variability induced agricultural vulnerability for each of the five villages under study, were computed based on the data generated from the questionnaire survey and PRA.
3 Results
3.1 District level
The data generated from the household survey and the PRA, supplemented by secondary data were used to calculate the indices representing the vulnerability of Jorhat district due to the four sources of vulnerability – biophysical, agricultural, demographic and socio‐economic. The four average vulnerability indices, so obtained, are shown in Table IV.
The indices calculated were apportioned weights according to the ranks assigned to the sources of vulnerability by the farmers based on their perceptions during the PRA. The final weight to be apportioned was calculated by the following formula: Equation 5 Table V shows the ranks given by the farmers in the five villages to the different sources of vulnerability where a rank of 4 indicates “very high” contribution to vulnerability. Ranks 3, 2 and 1 indicate “high”, “moderate” and “low” contribution of a particular source to overall vulnerability, respectively.
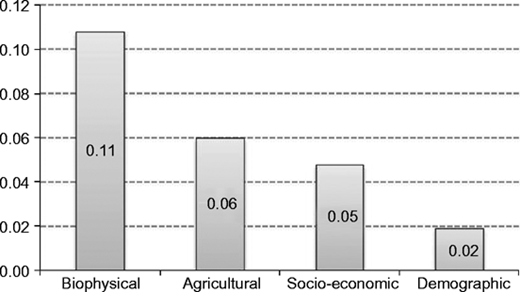
After the assignment of the weights to the indices calculated for each source of vulnerability, the weighted biophysical vulnerability index was found to be the highest (0.11), followed by the weighted Agricultural Vulnerability Index (0.06), Socio‐economic Vulnerability Index (0.05), and the weighted Demographic Vulnerability Index was the least (Figure 2).
The Composite Vulnerability Index, representative of the climate variability induced flood vulnerability of the resident farmers of the Jorhat district was then calculated using the formula: Equation 6 The Composite Vulnerability Index so computed for Jorhat was 0.03.
3.2 Village level
A similar approach as that adopted for calculating the Composite Vulnerability Indices of the district was used for computing the Composite Vulnerability Indices of individual villages in Jorhat district. At the village level, for some of the indicators however, data could not be generated for all the villages and even secondary data for these were lacking. So, these could not be quantified. Also, in certain cases, although data was available, the values could not be normalized because of their uniformity (all values were same; there were no minimum or maximum value). Hence, there were quite a few data gaps in the quantification of indicators for all the villages.
In order to make the comparison of vulnerability between the villages more robust, the indices were calculated considering only those indicators for which data could be normalized for all the five villages. Thus, the indicators considered at the village level include: proximity of the village to the nearest river, value of houses damaged, number of patients admitted to local health care centres with problems relating to water borne diseases, farm assets, average crop diversity index, percentage of small scale farmers, percentage of household sowing flood resistant crop, number of NGOs/organisations providing flood relief and percentage of households with boats. Using these indicators, the average Biophysical, Agricultural and Socio‐economic Vulnerability Indices were calculated for each of the villages. Table VI shows these indices for each of the five villages.
Biophysical vulnerability was found to be highest in Juginidhari village (0.56), followed by Guwalgaon (0.38), Balisapori (0.37), Bengenaati (0.31) and Boitamari (0.23). Juginidhari village also showed the highest agricultural vulnerability index (0.48), followed by Bengenaati (0.35), Boitamari (0.30), Balisapori (0.28) and Guwalgaon (0.15). Socio‐economic vulnerability was highest in the case of Bengenaati (0.56), followed by Juginidhari (0.48), Guwalgaon (0.42), Balisapori (0.31) and Boitamari (0.19) (Table VI).
Following this, weights were apportioned to each of the average vulnerability indices based on the ranks given by the residents of each of the villages during the PRA. However, since none of the indicators used for the calculation of the vulnerability of the villages belonged to the demographic category, only biophysical, socio‐economic and agricultural vulnerabilities were considered. Since, for all the villages, on a scale of 1‐4, demographic vulnerability had been ranked 1, for the purpose of the computation of the village level vulnerabilities (where the demographic category is not being considered), the ranks were considered on a scale of 1‐3 where 3, 2 and 1 indicated “high”, “moderate” and “low” contributions of the sources of vulnerability. The final weights apportioned were calculated by the formula: Equation 7 The final weights hereby calculated for the different sources of vulnerability of each of the villages are shown in Table VII.
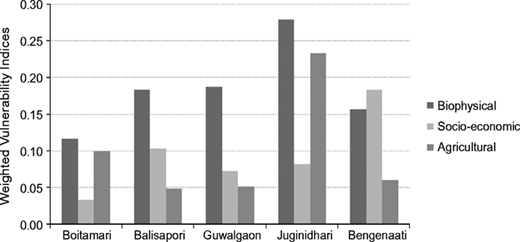
The weighted Biophysical, Agricultural and Socio‐economic Vulnerability Indices of the villages calculated by multiplying the apportioned weight by the average index calculated for each source of vulnerability are shown in Table VIII. Weighted biophysical and agricultural vulnerability indices are highest for Juginidhari (0.28 and 0.23) whereas the weighted socio‐economic vulnerability index is highest for Bengenaati (0.18).
Of the five villages, Juginidhari shows the highest weighted biophysical and agricultural vulnerability indices while Bengenaati shows the highest weighted socio‐economic vulnerability index. The least weighted biophysical and socio‐economic vulnerability indices are recorded for Boitamari while Balisapori and Guwalgaon are found to have the least weighted agricultural vulnerability index (Figure 3).
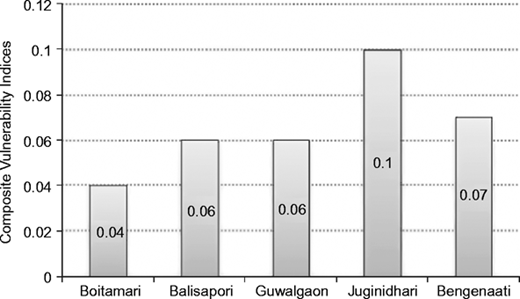
The composite vulnerability indices for each of the villages were calculated using the following formula: Equation 8 The Composite Vulnerability Index of Boitamari was found to be the least (0.04) while Juginidhari was found to be the village having maximum vulnerability to floods (0.10). For both Balisapori and Guwalgaon, the overall vulnerability index was calculated to be 0.06, while Bengenaati was found to be the second most vulnerable village (Figure 4).
4 Discussion and conclusions
The main outcomes of the study are the Composite Vulnerability Indices which reflect the climate variability induced vulnerability of the farmers' community to floods in Jorhat, taking five villages in the district as a sample. The study also assessed the vulnerability of the five villages within the district independently. Of the five villages sampled – Boitamari, Balisapori, Guwalgaon, Juginidhari and Bengenaati – the computed Composite Vulnerability Index of Juginidhari is the highest while that of Boitamari is found to be the lowest. Juginidhari also shows the highest biophysical and agricultural vulnerability indices. Bengenaati, Balisapori and Guwalgaon were perceived to be similar during the field survey, as is shown by the results of the present study. However, Boitamari was found to be as vulnerable as Juginidhari but the result shows that it is least vulnerable. This discrepancy of the results against the field observations with respect to Boitamari can be explained on the grounds that the village hardly has any arable land as large tracts of land have submerged in river water and the question of estimating agricultural vulnerability to floods does not arise which is a shortcoming of the method applied. The poor condition of Boitamari can be attributed to the alarming erosion activities of the Brahmaputra River during floods which has resulted in a loss of 1‐10 km2 over the last few years, thereby rendering many inhabitants landless (Naik and Singh, 1996). A study by Kotokey et al. (2003) has, reported features like liquefaction of sediments and flow of the bank materials into the river in Boitamari.
It needs to be understood that the vulnerability index computed is simply meant to give a comprehensive snapshot of the village level vulnerability. Due to paucity of time, in the present study the district vulnerability has been computed by taking into account only five villages. Further study in other parts of the district to asses flood vulnerability would give a comprehensive picture of the situation in the district. Moreover, as has been mentioned earlier, for some of the indicators, values could not be obtained either from the field survey or secondary data for all the five villages. Again, for certain indicators like percentage of houses damaged, percentage of kuccha (mud based) houses damaged, percentage of pukka (concrete) houses damaged, percentage of small scale farmers, and of marginal farmers although data was available for all the villages, the values could not be normalized as per the formula for dimension index mentioned earlier in the paper because of their uniformity (all values were same, there was no minimum or maximum value). Inclusion of these indicators might have been more apposite for the computation of the indices and might have presented results tallying with the field observations.
Despite these shortcomings, the study clearly shows that frequent floods and the consequent erosion have affected the Island of Majuli. Data from Census 1891 and 2001 also substantiate the fact that the Island has reduced in size. The inhabitants fear that the island area may be further reduced, if recurrent flood and erosion is not checked through proper scientific planning and management. At a higher level, the flood situation here as well as in other parts of Assam is an obstacle to the state's growing economy. At present, knowledge about future climate change in the Brahmaputra basin and consequent impacts on the Brahmaputra flood plains is limited – an issue which demands immediate attention. This should include regional vulnerability assessments, on the lines of the present study.
The analyses at two spatial scales – the district and the village levels – show that the biophysical factors have the greatest impact on the overall vulnerability at both the scales. The study also shows that even within the same district, different villages do have variable vulnerability to floods. From this one can comprehend that more decentralized the spatial unit of vulnerability assessment is, more efficient would be the implementation and execution of adaptation and mitigation measures, which would be based on local needs.
The Composite Vulnerability Index will provide a useful tool for decision makers to formulate efficient adaptation measures to flood and plan apposite developmental programmes in the Jorhat district. However, this bottom up approach may not be easily extrapolated for a larger scale (Fekete et al., 2010). Further research is required to understand and apply the current methods of vulnerability assessment on a larger scale and enhance the adaptation strategies to flood in the context of climate change.








Weighted biophysical, socio‐economic and agricultural vulnerability indices of study villages
Weighted biophysical, socio‐economic and agricultural vulnerability indices of study villages
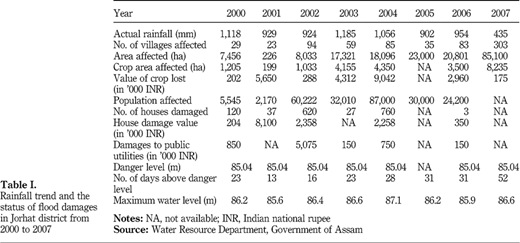
Rainfall trend and the status of flood damages in Jorhat district from 2000 to 2007
Rainfall trend and the status of flood damages in Jorhat district from 2000 to 2007

Average biophysical, agricultural, socio‐economic and demographic indices of Jorhat
Average biophysical, agricultural, socio‐economic and demographic indices of Jorhat



Weights apportioned to the average vulnerability indices for calculating village level vulnerability
Weights apportioned to the average vulnerability indices for calculating village level vulnerability

Weighted biophysical, agricultural and socio‐economic vulnerability indices of the study villages
Weighted biophysical, agricultural and socio‐economic vulnerability indices of the study villages
Swati Chaliha acknowledges the support received from the Centre for Sustainable Technologies, Indian Institute of Science, Bangalore to carry out research work for her master thesis. She would like to thank Indu K Murthy, Research Officer, EarthWatch Project Office, Centre for Sustainable Technologies, Indian Institute of Science for her critical remarks and constructive suggestions while writing this paper.
References
Further Reading
About the authors
Swati Chaliha is a Postgraduate in Environment Management from Forest Research Institute, Dehradun, India. Her research interests focus on the broad areas of climate change adaptation, governance and policy issues of REDD and biofuels. Swati Chaliha is the corresponding author and can be contacted at: swatichaliha@gmail.com
Asmita Sengupta is a Research Assistant at the Centre for Sustainable Technologies, Indian Institute of Science, Bangalore. She is a Postgraduate from Forest Research Institute, Dehradun, India.
Nitasha Sharma is a Research Assistant at Centre for Sustainable Technologies, Indian Institute of Science, Bangalore. Her research areas are Ecosystem Services, Environmental Policy and Governance.
N.H. Ravindranath is a Professor at Centre for Sustainable Technologies, Indian Institute of Science. Broad areas of his research include forestry, rural energy, community and sustainable development, natural resource monitoring, climate change and related issues. His main scientific contributions are in the fields of climate change – mitigation, impacts, vulnerability and adaptation in the land use and forest sector including inventory of land use sectors, clean development mechanism (CDM) and reducing deforestation (REDD) in forest sector, bioenergy and sustainable forestry. He has authored eight books and over 100 peer‐reviewed papers – largely focused on climate change, energy and forestry. He is an author for eight IPCC Assessment Reports during the last ten years, including the latest IPCC Report, 2007 and was one of the principal authors for the two reports on greenhouse gas inventory guidelines of IPCC for land use sectors and these reports have been accepted by the UNFCCC and are in use by all the countries.

