


The purpose of this paper is to present and discuss the methodological approach and the results of the investigation of greenhouse gas emission abatement costs in Upper Austria.
The assessment covers the quantification of marginal abatement costs (MACs) of greenhouse gas (GHG) emissions and the emission reduction potentials of various energy efficiency and fuel switch measures with a special emphasis on the heat, electricity and transport sectors in Upper Austria during the period from 2010 to 2030.
The expert‐based assessment in Upper Austria shows negative abatement costs for 19 of 56 evaluated strategies. While these measures are very efficient from an economic point of view, the remaining 37 measures are associated with higher costs. The evaluation reveals a significant reduction potential of 5.2 million tons CO2e (which represent 21 per cent) of the current GHG emissions in Upper Austria for the examined period.
MACs are generally limited to a certain time frame. Furthermore, the expert‐based approach is based on several assumptions and neglects behavioural and learning aspects.
This contribution uses a multi‐criteria approach that reveals the economic efficiency and the ecological effectiveness of the considered strategies/technologies with regard to greenhouse gas emission reductions, the improvement of the overall energy efficiency, and the competitiveness of a fuel switch towards renewable energy sources. Drawing upon the findings of this study, policy recommendations can be elaborated and the necessary improvements of the regulative framework can be implemented.
Introduction
Legally binding commitments for reducing carbon emissions arise in many countries of the world and are primarily based on the multilateral agreement of the Kyoto protocol. The protocol applies mostly to industrialized countries in the period from 2008 to 2012 and provides for a reduction of six greenhouse gases (GHGs) (CO2, CH4, H2O, HFC, PFC, SF6) by approx. 5 per cent in comparison to 1990. Moreover, the European Union decided to reduce GHG emissions by at least 20 per cent of 1990 levels by 2020. In addition, the European Union has offered to increase its emission reductions to 30 per cent by 2020, contingent on the behaviour of other major emitting countries in developed and developing countries. Within this framework, Austria was assigned a GHG reduction target of 13 per cent by 2012 as compared to 1990. Given this setting, the question arises whether certain measures to reduce GHG emissions can be implemented cost‐efficiently. The concept of marginal abatement costs (MACs) allows for the illustration of the marginal costs and the total emission abatement, indicating the ecological effectiveness with regard to a business‐as‐usual (BAU) scenario of certain GHG emission abatement measures. Strictly speaking, abatement costs are defined by a cost‐benefit ratio which displays the monetary input necessary for the reduction of 1 ton of GHG emissions. Hence, this procedure can be used by policy makers to evaluate the implementation of certain abatement measures and assist decision‐making at the international, national and regional level. By comparison, various countries have already carried out investigations in this field. For example, an in depth analysis was carried out in Germany (McKinsey & Company, 2007), which still represents a milestone in the analysis of abatement costs.
This paper presents the main results and conclusions of the scientific research project “Analysis of CO2e abatement costs in Upper Austria”. The assessment covers the quantification of abatement costs of certain GHG emissions (CO2, CH4, N2O) of various energy efficiency and fuel switch measures, and puts special emphasis on the heat, electricity and transport sector in Upper Austria in the period from 2010 to 2030. The evaluated energy efficiency measures include, among others, thermal renovation activities, improving building standards, promoting efficient vehicles and enhancing domestic appliances. Additionally, the fuel switch measures incorporate the increased utilization of renewable energy sources for heating systems, for vehicles and for the generation of electricity. Furthermore, the absolute reduction potentials of the analyzed measures (in tons of CO2 equivalents (CO2e)) for each year and for the entire period from 2010 to 2030 were evaluated. To our knowledge, no other sector or measure‐specific assessment has been conducted for Upper Austria up to now. Thus, the multi‐criteria approach of this paper reveals the economic efficiency and the ecological effectiveness of the considered methods with regard to:
GHG emission reductions;
the improvement of the overall energy efficiency; and
the competitiveness of a fuel switch towards renewable energy sources.
In addition, the MACs resulting from 31 energy efficiency measures are compared to 25 technologies focusing on fuel switch measures. Thus, a direct comparison of energy efficiency concepts and the intensified utilization of renewable energy sources is possible. Furthermore, this enables the generation of a comprehensive overview and the prioritization of measures/technology changes. Drawing upon the findings of this study, policy recommendations can be elaborated and the necessary improvements of the regulative framework can be implemented.
The next section starts with an explanation of the concepts of MAC curves which focuses especially on the expert‐based approach. In the following, the findings of the quantification of MACs and the reduction potentials in Upper Austria are presented. In the section afterwards the idea of policy‐making via MAC curves is addressed. Finally, the paper ends with conclusions and suggestions for future work.
The concept of MACs
MACs cover those costs incurred by the reduction of a defined quantity of GHG emissions compared to a reference or BAU scenario. Accordingly, they provide a cost‐benefit ratio and analyse the economic efficiency and ecological effectiveness for the evaluation of measures or technology changes.
Thus, the MAC curve displays the costs generated with the last unit of emission reduction for changing the quantity of reduced emissions. Consequently, a BAU scenario has to be derived in order to calculate the MACs against this baseline abatement. As stated in Kesicki (2010):
[…] a MAC curve allows one to analyse the cost of the last abated unit of CO2 for a defined abatement level while obtaining insights into the total abatement costs through the integral of the abatement cost curve.
The concept of MAC curves in general provides advantages with respect to the ability to derive the MACs for any given total reduction amount. Further, MAC curves display the total costs which are required to mitigate a defined amount of carbon emissions. On the other hand, MACs estimates are generally limited to one point in time, exhibit a lack of certainty because they focus on the future and do not consider ancillary benefits like improved energy security and the abatement of other GHGs. Thereby, two fundamental concepts for deriving MAC curves exist:
- 1.
expert‐based MAC curves based on a managerial approach; and
- 2.
model‐derived MAC curves generated by energy and environmental policy models (Kesicki, 2010).
The latter is based on top‐down models including endogenous economic reactions within the whole economy. Accordingly, conventional top‐down models typically are deficient in details on present and future technological alternatives which may be important in regard to a suitable evaluation of different energy policies. Generally they do not provide for essential physical constraints such as the preservation of energy. These models offer great perception of the effects of policy measures such as taxes or subsidies causing market distortions. The second species are so‐called bottom‐up models which represent only the energy sector. They account for cost minimization or maximizing consumption and producer surplus in the focused sector and do not reflect macroeconomic reactions. Compared to top‐down approaches, these models comprise more features of energy technologies along the conversion from primary to final energy (Shukla, 1995; Hourcade et al., 2006; Böhringer and Rutherford, 2008).
In the following, the first manner to derive MAC curves – the expert‐based approach – is described and the definitions as well as the interpretation of the derived results are given in more detail. Expert‐based MACs are conceived through the evaluation and assessment of various technologies by experts who make assumptions for the BAU scenario, the CO2 reduction potential and the costs for investment as well as energy prices at a single point in time. This concept of MACs, also known as technology cost curves, illustrates a ranking of the cheapest and most expensive technologies and therefore shows the potential of various measures/technology changes with respect to emission reductions.
According to the concept of expert‐based MACs, the following formula is used for the quantification of specific abatement costs of GHG emissions based on a technology i with respect to a reference technology j (BAU situation without implementation of any measure): Equation 1 with:
ΔCt (total annual costs technology i (euro) in t) − (total annual costs BAU technology j (euro) in t).
ΔEt (total annual GHG emissions BAU technology j (tons) in t) − (total annual GHG emissions technology i (tons) in t).
As shown for a yearly observation in formula (1), the model can also be used to calculate the MACs for an extended time period.
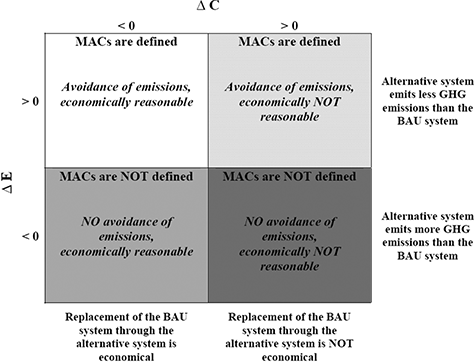
After the quantification of the MACs of a measure or technology change, the outcome is classified. Figure 1 thus shows an evaluation model for MACs including the possible results and how those can be interpreted.
In general, it can be said that negative MACs for the case when ΔC<0 and ΔE>0 (and therefore MAC<0), indicate that cost‐saving options exist. The combination of a positive total annual cost difference and a positive difference in GHG emissions, thus ΔC>0 and ΔE>0 (and therefore MAC>0), causes environmental effectiveness in terms of GHG emission reductions, but also higher costs. It should be noted that in regard to a positive total annual cost difference and a negative difference of GHG emissions, thus ΔC>0 and ΔE<0 (and therefore MAC<0), and a negative total annual cost difference associated with a negative GHG emission difference, thus ΔC<0 and ΔE<0 (and therefore MAC>0), no relevant conclusions regarding the MACs can be derived, since no reduction of GHG emissions takes place.
Basically, when interpreting the values of the specific mitigation costs it has to be noted that neither the resulting cost difference nor the difference of emissions should be very low, so that the calculated values are comparable. Furthermore, the essentiality of consistent reference scenarios has to be pointed out as this provides the fundamental prerequisite for statements about the economic efficiency of GHG emission reductions. As a consequence, of lower costs of the considered technology (alternative system) as compared to the reference system, and due to a minimal avoidance of emissions, high negative MACs result in an increased need for interpretation.
While the amount avoided (in tons CO2e) reflects the effectiveness of each system in terms of meeting the aim of emission reductions, the specific avoidance costs (in €/ton CO2e) are a measure regarding the efficiency of each activity and/or technology change. Hence, the expert‐based MAC represents the cost‐benefit ratio for the implementation of measures, since those costs display the monetary input necessary to avoid 1 ton of CO2e. Accordingly, negative abatement costs are an indication for particularly efficient mitigation measures/technology changes.
MACs present the abatement costs required for any given total reduction amount, however they are generally limited to a certain time frame. The expert‐based approach, which is examined in this paper in greater detail, considers individual technologies associated with specific details but neglects behavioural and learning aspects. Furthermore, the expert‐based MACs conclude the possibility of different BAU scenarios which leads to an inconsistent perception. Due to these assumptions, the model is based on uncertain information, such as investment costs, efficiencies, etc.
MACs and reduction potentials in Upper Austria
General assumptions are discussed, before presenting the main results of the quantification of MACs and the reduction potentials in Upper Austria. As already mentioned, MACs can be quantified for an extended time period, in this case for the period from 2010 to 2030. Thus, the expert‐based MACs for the period from 2010 to 2030 are calculated as follows: Equation 2 According to formula (2) ΔCt represents the cost difference between the alternative system and the BAU scenario for the period from 2010 to 2030, and ΔEt implies the spread between the GHG emissions through the BAU scenario as compared to the alternative system for the same period.
The quantification of MACs of GHG emissions includes the abatement costs for CO2, CH4 and N2O emissions. The quantification of fluorinated GHGs is not feasible due to the lack of necessary data. In general, the observation of CH4 and N2O emissions allows for the quantification of GHG abatement costs. It should be noted that in the case of reduced CH4 and N2O emissions as a result of the implementation of a measure (in a situation of reduced CO2 emissions), the CO2e abatement costs are lower and therefore more positive than the abatement costs considering only CO2. This can be explained by the fact that the same costs reduce more emissions.
The quantification of MACs, including CH4 and N2O emissions, is based on the global warming potential (GWP) of these gases in relation to CO2. Table I contains the relationship between CO2, CH4 and N2O.
The separation of the quantification of the abatement costs for CH4 and N2O emissions does not seem appropriate, since the shifting the conversion and energy costs of a specific measure on these low distinctive types of emissions (compared to the level of CO2) would distort the individual results too much. For this reason, the authors limit themselves to a representation of the total CO2e abatement costs.
In terms of costs, a total cost approach is applied including end‐user costs as well as costs of public service, whereat costs for energy are also taken into consideration. Furthermore, it is assumed the investment into a measure/technology depreciates over the life span of the particular technology. Finally, in addition to the abatement costs of GHG emissions, this investigation also determines avoidance potentials of various measures until the year 2030.
Based on the definition of expert‐based MACs within this assessment, 56 measures/technology changes were assessed. 31 of which concern the enhancement of energy efficiency. In the end, 25 of these evaluated GHG technology changes actually imply a fuel switch towards renewable or low‐carbon technologies. The following areas of energy services were evaluated:
heating and cooling (H);
electricity (E); and
transportation (T).
Since, the BAU scenarios are an essential part within the concept of MACs, the following reference scenarios were defined for each segment within this assessment:
- 1.
Segment heating/cooling:
Energy efficiency measures. Individual scenario.
Fuel switch measures. Single‐family house, with heating technologies based on fossil fuels.
- 2.
Segment electricity:
Energy efficiency measures. Average new device/appliance.
Fuel switch measures. Four reference scenarios (European electricity mix, Austrian electricity mix, Upper Austrian electricity mix, electricity by a combined‐cycle plant).
- 3.
Segment transportation:
Energy efficiency. Individual scenario.
Fuel switch. Vehicle with an average fuel consumption.
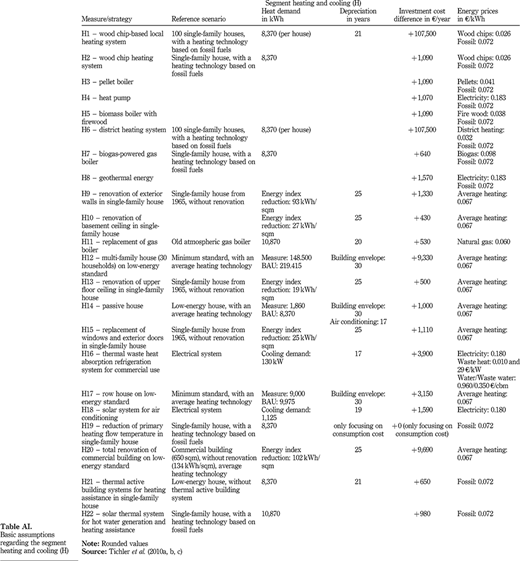
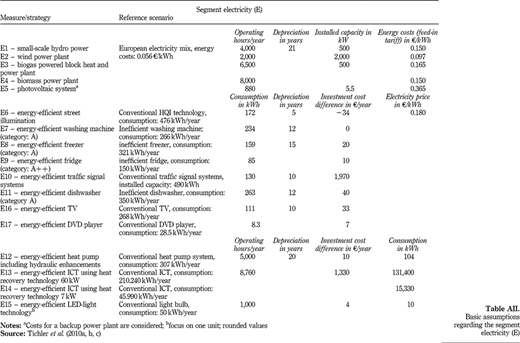
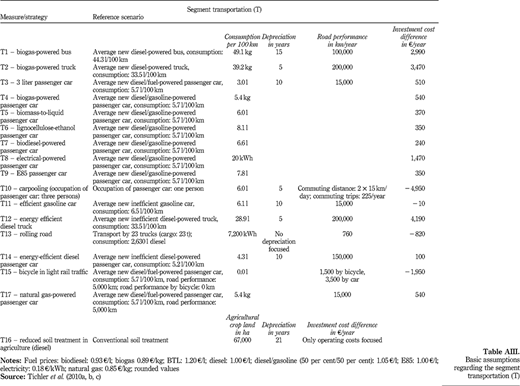
The Appendix contains detailed information on each abatement measure, in terms of the BAU, depreciation rates, energy consumption, investment costs, energy prices and so on. It must be stated that the quantification of individual measures is not very expedient. In contrast, the comparability of the measures with each other in order to design an expert‐based abatement cost curve is far more significant. Therefore, the assumptions should simply be seen as general guidance for understanding the quantification of expert‐based MACs (Tables AI‐AIII).
On the basis of the BAU scenarios mentioned, Table II illustrates the main results of the GHG reduction costs and potentials in Upper Austria through the 31 energy efficiency measures examined within this project. The evaluation represents the anticipated costs and reduction potentials in 2030.
Finally, Table III displays the main results of the abatement costs and reduction potentials in Upper Austria that were generated by the 25 fuel switch strategies investigated within this project. The evaluation represents the anticipated costs and reduction potentials in 2030.
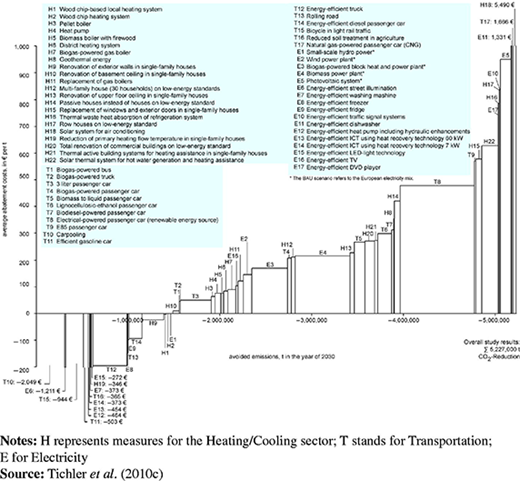
Summarizing the economic efficiency of all evaluated measures, it is apparent that 19 out of the 56 strategies (which represent 34 per cent) have negative abatement costs. Thus, even in the absence of other financial incentives it makes sense to invest in these measures as they pay off within their projected time of use or generate a positive cash flow. According to the assessment scheme in Figure 1, these measures are very efficient from an economic point of view and exhibit ΔC<0 and ΔE>0. The remaining 37 measures/technology changes (which represent 66 per cent) generate positive abatement costs, which implies ΔC>0 and ΔE>0. Thus, although their ecological footprint is positive, it is not possible to justify an investment in these technologies from a purely economic point of view.
Figure 2 shows a summary of the expert‐based MACs of the evaluated measures in Upper Austria in the year 2030.
The assessment of the overall reduction potential of GHG emissions in Upper Austria shows that by the year 2030 a reduction of GHG emissions of 5.23 million tons CO2e is possible. This represents 25 per cent of the current GHG emissions of Upper Austria and 52 per cent of the emissions outside the industrial sector which was not part of this analysis.
The possible reductions are by all means significant. Measures aimed at improving the overall energy efficiency account for a total of 1.76 million tons of CO2e emission reductions (this represents 8 per cent of the current GHG emissions or 18 per cent of CO2e emissions outside the industrial sector). On the other hand measures, which imply a fuel switch, are capable of reducing GHG emissions by 3.47 million tons CO2e (which represents 16 per cent of the current GHG emissions or 35 per cent of the emissions outside the industrial sector).
In 1990, GHG emissions in Upper Austria accounted for 21.9 Mt CO2e in Upper Austria, which means a required reduction to 19.1 Mt CO2e by the year 2012. Based on the latest available figures from the Upper Austrian pollutant inventory in 2009, GHG emissions accounted for 21.3 Mt CO2e (compared to 24.5 Mt CO2e in 2008), of which 53 per cent originate from the industrial sector. Even though the economic crises caused a slump of the industrial production, which is mainly responsible for the GHG reduction between 2008 and 2009 as it is the most relevant emission source, followed by transportation and households, the province of Upper Austria is far away from achieving its reduction target (Environmental Agency Austria, 2011).
An overall vulnerability assessment for Upper Austria revealed good preconditions for coping with climate change, due to the fact of a highly adaptive capacity and moderate impacts of climate change to relevant sectors. However, some crucial vulnerabilities can be identified, which mainly concern water management, forestry, transportation and energy production. Within the governmental working program 2009‐2015 the federated government of Upper Austria has fixed severals sectoral mitigation measures and goals, focusing primarily on water management and forestry. Furthermore, climate change mitigation is addressed by the recent Upper Austrian Traffic Concept (promotion of public transport) and the Energy Strategy 2030 (reduction of GHG emissions of up to 65 per cent by 2030) (Birngruber et al., 2011).
Policy‐making via MAC curves
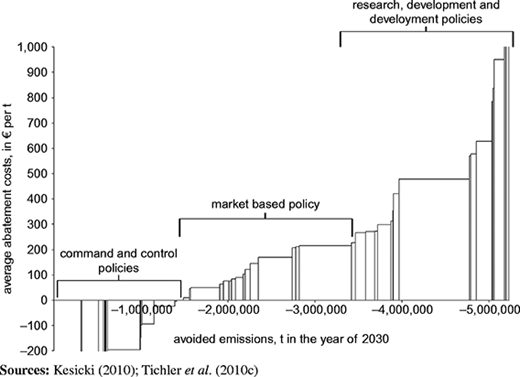
According to a generally accepted distinction between different policy instruments, incentive‐based and non‐incentive‐based instruments are distinguished. The first category contains the most prominent climate policy approaches, namely the taxation of undesired pollution (e.g. carbon tax) and the limitation of overall carbon emissions (i.e. cap‐and‐trade). The second category includes instruments targeted at research and development, as well as command‐and‐control policies. Both types can be applied to different problem sets. However, from an economic efficiency point of view, market‐based instruments are preferred. The various existing approaches can be further characterized by the measure/technology change under scrutiny. Here, a similar taxonomy according to Kesicki (2010) is used, which defines three categories of policy instruments that can be applied to different measures.
Furthermore, a group of economically viable technology shifts exists that will ultimately be implemented due to their (economic) advantage for the user (investor). These measures can be regarded to be best suited for command‐and‐control policies as the economic aspect of their implementation is already represented by their (negative) MACs. The second category involves market‐based policies like carbon taxation and carbon permits. These measures typically exhibit positive MACs, although they are also the most interesting category from a policy point of view. They require a profound mix of policy‐instruments and thus are in great need of further research. The third and last category contains measures, technologies and strategies that result in (mostly large) positive MACs. These measures often require further research and development efforts in order to become economically viable.
The various policy instruments can thus be summarized into three groups, which are also shown in Figure 3.
Conclusions
In numerous international studies aimed at evaluating measures for the reduction of GHG emissions, the concept of MACs is a frequently used procedure to illustrate the marginal costs and the total emission abatement, displaying the economic efficiency and ecological effectiveness of measures or technology changes. As demonstrated at a regional level, an expert‐based assessment in Upper Austria (for the period from 2010 to 2030) shows a significant reduction potential of GHG emissions (25 per cent of the current GHG emissions), consisting of 34 per cent of energy efficiency measures and of 66 per cent of measures focusing on fuel switch. These results can therefore be used by policy makers to promote the implementation of certain GHG abatement measures. Applied to Upper Austria the investigation can support the implementation of the governmental working program, as well as the Energy Strategy 2030.
The concept of MACs is generally limited to a certain time frame, furthermore the approach is based on several assumptions, such as investment costs and efficiencies. With regard to the expert‐based MAC curve, future work should focus on creating different technological learning rates and on sensitivity analyses, since parameters such as investment, energy costs and the performance of new technologies have a deep impact on the shape of the MAC curve.



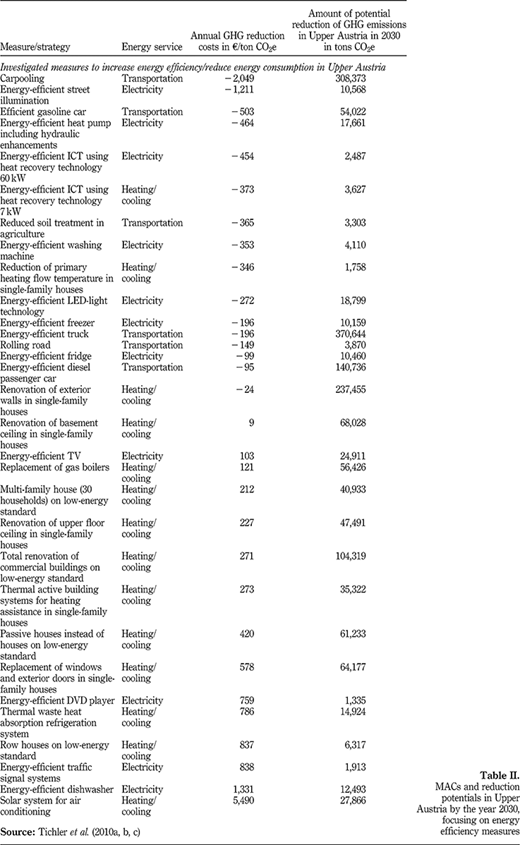
MACs and reduction potentials in Upper Austria by the year 2030, focusing on energy efficiency measures
MACs and reduction potentials in Upper Austria by the year 2030, focusing on energy efficiency measures
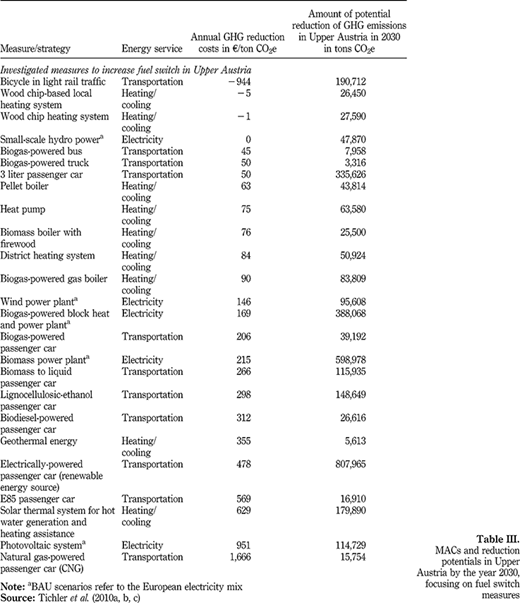
MACs and reduction potentials in Upper Austria by the year 2030, focusing on fuel switch measures
MACs and reduction potentials in Upper Austria by the year 2030, focusing on fuel switch measures
For the purpose of this scientific research project, the authors would like to acknowledge the support and funding received from the province of Upper Austria. They also gratefully thank their colleagues at the Energy Institute at the Johannes Kepler University of Linz, amongst others Martin Luger, for his critical remarks and constructive suggestions for writing this paper. Finally, the authors are deeply grateful for the reviewers' comments and opinions on this paper and their suggestions on how to improve it.
References
Appendix
About the authors
Markus Schwarz is currently working as a Research Associate in the Department of Energy Technologies of the Energy Institute at the Johannes Kepler University Linz. His research interests focus on the ecological and economic evaluation of renewable energy technologies, on Smart Grid related topics, in particular on the integration of distributed energy resources, as well as on the assessment of energy efficiency measures. Markus Schwarz is the corresponding author and can be contacted at: schwarz@energieinstitut‐linz.at
Sebastian Goers is currently working as a Research Associate in the Department of Energy Economics of the Energy Institute at the Johannes Kepler University Linz. His research interest focuses on environmental economics, EU climate policy and (macro)econometric analyses and modelling.
Michael Schmidthaler is a member of the scientific research team in the Department of Economics of the Energy Institute at the Johannes Kepler University Linz. He completed his Master's in Economics and Environmental System Sciences (M.A. & M.Sci.) at the University of Graz and gained international experience in various student and research stays in the USA, Spain and South America. Since March 2010, he has been working on a variety of projects at the Energy Institute with a focus on the economics of energy supply security, smart metering and grid services, as well as greenhouse gas abatement and energy efficiency efforts.
Robert Tichler is researcher and project leader at the Energy Institute at the Johannes Kepler University Linz. His research focuses on economic simulations and the analysis of energy and climate policy problems and questions. His self‐conceived and self‐programmed macroeconometric simulation model MOVE has been applied in several economic analyses at the Institute. He is currently leader of several projects, which include energy topics from regional resource plans to the quantification of greenhouse gas emissions reduction costs. Robert Tichler holds a doctoral degree in Economics from the Johannes Kepler University Linz. In addition, he worked at the Institute for Environmental Management in Companies and Regions at the Johannes Kepler University Linz.

