


– This paper aims to explore true technical efficiency in order to select the most competitive manufacturing industries in China. And the paper intends to discuss how environmental variables measured by energy consumption affect performance in different industrial sectors under the restriction of low-carbon economy.
– In order to measure the calculated efficiency of industrial sectors more accurately, Three-stage DEA model is presented in the empirical analysis using data from 2007 to 2010 covering 29 manufacturing industries in China. The advantage of using this method is enabling us to separate the managerial factor from external environmental factors and random errors factors on the technical efficiency.
– The results using this Three-stage DEA model show that textile manufacturing sector has the highest technical efficiency, and when environment variables are not considered, efficiencies in machinery and electronics manufacturing industries have a significant increase. Moreover, this empirical model enables us to evaluate the technical performance in various manufacturing sectors more accurately.
– This study provides a useful efficiency measurement tool (Three-stage DEA model) to calculate technical efficiency among different industrial sectors. Technical efficiency plays a key role in building the competitiveness of manufacturing industry. Based on the objective efficiency evaluation, the paper can make a better selection of the most competitive industries.
– The paper contributes to the existing literature by developing a Three-stage DEA to examine the technical efficiency and competitive power of manufacturing sectors in China. This study has great policy implications for the research of China's manufacturing in both ideas and methodology.
1 Introduction
Global awareness on climate change has attracted much attention in the analysis of the trend in the consumption of energy in the world. Climate change is largely due to the emission of greenhouse gas such as carbon dioxide (CO2) resulting from the burning of fossil fuels (Xu et al., 2010). As the world's second largest economy, the largest energy consuming country and the largest CO2 emitter, China nowadays is facing tremendous pressure in the international negotiation on climate change (Chmutina et al., 2012). In order to take a leading role in this global political game, China must implement new policies to achieve a low-carbon economy (Xu et al., 2010; Chmutina et al., 2012). As Wang et al. (2011) points out, “low-carbon” means that economic development must minimize or eliminate dependence on carbon-based fuels, achieving both an energy transformation and an economic transformation.
Given the significance of the effective use of energy under the constraint of low-carbon economy, we are contributing to the existing literature by evaluating the energy efficiency in manufacturing sectors in China. Manufacturing sectors not only make huge contribution to China's economic growth but also account for two-thirds of the total energy consumption and dominate the energy-related CO2 emission leading to substantial amount of energy waste and pollutant emission (CSC, 2012). Therefore, an analysis of energy use and overall technical efficiency of manufacturing sectors in China under the constraint of CO2 emission is of particular importance.
Evaluating efficiency in the manufacturing sectors has been widely studied using data envelopment analysis (DEA) approach. Lee et al. (1998) decomposes the nonparametric Malmquist productivity index for 36 Korean manufacturing sectors into two components: technological change and technical efficiency change and studies relevant determinants. Önüt and Soner (2007) provides a CRR model to conduct the evaluation of energy efficiency in 20 medium sized companies in Turkish manufacturing sector. Moreover, Mukherjee (2008) presents a nonparametric analysis tool to calculate the efficiency of energy use in US manufacturing and finds that paper and allied products sector become more efficient than overall manufacturing sectors while the primary metals industry is the worst in terms of energy use efficiency. Meanwhile, Margono and Sharma (2006) estimates the technical efficiencies and total factor productivity (TFP) growths in food, textile, chemical and metal products industries from 1993 to 2000 in Indonesia by using the stochastic frontier model. In exploring the efficiency and energy use performance of manufacturing sectors, many studies propose to use the traditional DEA (e.g. CRR and Banker, Charnes and Cooper (BCC) model) or systematic method to measure different industrial sectors, such as size and efficiency in African manufacturing firms (Söderbom and Teal, 2004); energy efficiency developments in the manufacturing industries of Germany and Colombia, 1998-2005 (Martínez, 2009); efficiency analysis of industry and manufacturing in Japan (Hitomi, 2004); efficiency discussion of energy intensive manufacturing sectors (Azadeh et al., 2007). Liu and Wang (2009) provide a two-stage DEA approach to evaluate the performance of PCB manufacturing firms in Taiwan.
However, existing studies of manufacturing efficiency have not considered the impact of environmental factors. Besides, most of the studies are using traditional DEA models instead of improved DEA models. To contribute to this field of study, we follow Fried et al. (2002) by constructing an exogenous variable, namely environmental impact and then building the framework for evaluation of technical efficiency in manufacturing sectors in China using advanced Three-stage DEA model. The reason why this approach is better will be introduced in next section.
The rest of this paper is organized as follows: Section 2 contains the Three-stage DEA methodology; followed by data description in Section 3, including inputs and outputs variables. The discussion of results is shown in Section 4 before we conclude.
2 The Three-stage DEA methodology
Technical efficiency refers to the capability of a decision making units (DMU) to obtain the maximum outputs under the condition of given inputs or minimal inputs under the condition of given outputs (Coelli and Perelman, 1996). The widely used method is the production frontier approach. To measure the production frontier, we use an output distance function approach introduced by Shephard (1970). The advantage of the distance function approach is that it allows for a multiple-input and multiple-output technology when price data is missing. The distance function can be estimated in two typical ways, parametric analysis and nonparametric analysis. And we often use stochastic frontier analysis (SFA) for the former and DEA for the latter.
DEA approach has recently been widely applied to evaluate technical efficiency of different DMUs in extant literature. But we cannot ignore the fact that three factors including managerial efficiency, operating environment, and statistical noise have influence on the technical efficiency. The first factor is an endogenous variable, and others are exogenous variables. Hence, it is vital for us to distinguish and evaluate the impact of these three factors on efficiency. This paper proposes a new efficiency evaluation model, a Three-stage DEA, to explore the true technical efficiency in order to select the most competitive manufacturing industries in China. The new method enables us to remove the managerial factors, making the calculated value more accurately reflect the internal efficiency of manufacturing industries in China.
2.1 The first stage: DEA model
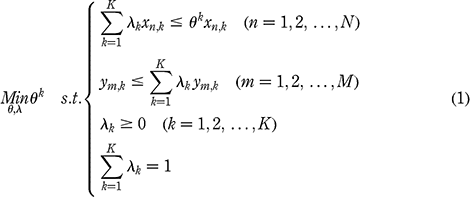
In the first stage, we use a typical DEA model, that is BCC model (input oriented) extended by Banker et al. (1984) based on the CCR model, to measure technical efficiency. Suppose that there are K DMUs, and DMU k has M inputs and N outputs. The efficiency score of DMU k is given by solving the following fractional programming model: Equation 1 where, x n,k is the nth type input of kth DMU; y m,k is the mth type output of kth DMU. And λ k is the power variable of inputs and outputs. k stands for the relative technical efficiency between 0 and 1. For the efficient units, their efficiency value is 1, which forms the efficient frontier. The first stage DEA model cannot separate the external environment factor, the random error factor or the internal management factor on the value of efficiency. So if an industry sector has a low efficiency value, at this stage, we cannot tell exactly which factors of the three lead to the low efficiency.
2.2 The second stage: SFA model
As in Fried et al. (2002), we can gain efficiency score and input slacks of each DMU. Slacks denote the input difference under real condition and the production frontier. The input slacks include managerial inefficiency, environmental factors and random errors. At this stage, regression analysis can be conducted with the SFA to adjust the uncontrollable factors, the total input slack of the items s n,k, which is the dependent variable in the SFA regression mode (Shyu and Chiang, 2012).
First, the slacks can be defined as: Equation 2 where s n,k is the slack variable of the nth type input of kth DMU.
Then, we build the SFA equation with slacks and environment variables showing below: Equation 3 where z k=[z 1,k,z 2,k, … ,z p,k], (k=1,2, … ,K) denotes p observable environmental variables and f n(z k;β n) represents the deterministic feasible slacks frontier. As a general rule, let f n(z k;β n)=z k β n.β n be the environmental factor parameter vector for our estimation. As for v n,k+u n,k, we consider this composite error the residual. v n, k˜N(0,σ v,n2) a statistical noise; and u n,k≥0,u n, k˜N+(μ n,σ u,n 2) refers to the managerial inefficiencies. Both v n,k and u n,k are independent and uncorrelated. And specifically, we assume γ=σ u,k 2/(σ u,k 2+σ v,k 2), as γ approaching to zero, random errors factor will become the dominant factor, however, if γ increases to one, the managerial factor will be playing a more important role.
Finally, we adjust input variables. According to the SFA regression results, we can remove the random errors from environmental inefficiency conditions. Following Lovell and Pastor (1995), we make use of both regression results (β^ n,u^ n,σ^ u,k 2,σ^ v,k 2) and conditional estimation of managerial inefficiency E^[u n,k/v n,k+u n,k], the random errors then can be written as: Equation 4 Based on input variables of the efficient units, the adjustment equation for the input of each DMU can be expressed as follows: Equation 5 where, x n,k A and x n,k denote adjustment input value and original input quantity. The first brackets in model (5) represent all the DMU adjusted to the same environment, the second brackets parentheses representatives all decisions making units adjusted to the same natural situation.
2.3 The third stage: adjusted DEA model
In the third stage, we put each value of x n,k A which is adjusted in the second stage instead of the original input x n,k into the BCC model, and then obtain technical efficiency which has excluded the effect of environmental and random error term. Thus, the resulting efficiency in the third stage of the modified DEA represents a more realistic reflection of managerial efficiency. An increasing number of studies is presenting a Three-stage DEA to evaluate more accurate technical efficiency among different fields such as true managerial efficiency of bank branches in Taiwan (Shyu and Chiang, 2012) and Spanish football teams (García-Sánchez, 2007).
3 Data and variables
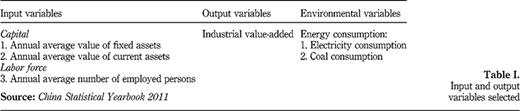
According to the two-digit industry code in China, manufacturing sectors include 30 sectors such as foodstuff processing, oil processing and refining and, etc. This paper takes each industrial sector as a DMUk. The number of evaluated DMUs should be more than five times the total selected number of inputs and outputs (Golany and Roll, 1989); otherwise, the credibility of empirical results will be seriously compromised (Shi et al., 2010). Hence, we select three factors as input variables and one as output variable following many relevant studies (Rashe and Tatom, 1977; Lv et al., 2012), two environmental variables and one industrial value-added (IVA) serves as the single output. More detailed variables information is summarized in Table I. The annual average fixed assets in Table I have been adjusted by price index. Labor force (10,000 persons) represents the number of persons employed in the industrial sectors at the end of the corresponding years. Moreover, we use IVA instead of industrial output because we wish to measure the effect of final good on technical efficiency.
In this study, the environmental variables are considered as external factors meaning that they can only influence the production efficiency but cannot be changed or controlled by any DMUs in a short time. Coli et al. (2011) selected two environmental variables, namely nitrogen dioxide (NO2) concentration and PM10 concentration when monitoring environmental efficiency in Italy, while Mandal and Madheswaran (2010) chose CO2 emissions for calculating environmental efficiency for cement industry in India. In this section, taking low-carbon economy into account, we select energy consumption associated with carbon emissions resulting from the manufacturing sectors as the environmental variable. As a secondary energy source, electric power will not produce CO2 emissions directly. But it is well known that generation of electric power will consume lots of fossil energy, and forms energy consumption. Hence, we select coal, coke, crude oil, gasoline, kerosene, diesel oil, fuel oil, gas and electric power to measure energy consumption of manufacturing sector. Furthermore, when checking different kinds of energy, we find that coal and electric power are most widely used in manufacturing sectors. So in this study, coal consumption and electric power consumption are selected as the final environmental variables. All data covers the period between 2007 and 2010 obtained from the China Statistical Yearbook during 2008-2011. Because National Bureau of Statistics have not calculated the data of IVA since 2009, so the data of IVA from 2008 to 2010 is not available from any statistical yearbook or database. In order to overcome this problem, we assume that both IVA and industrial output value (IOV) increase at the same rate and the estimation equation of IVA can be written as follows: Equation 6 In addition, recycling and disposal of waste sector is not included in our study due to missing data. Hence, technical efficiency of other 29 industries is examined from 2007 to 2010.
4 Empirical analysis
4.1 The first stage: empirical results of DEA
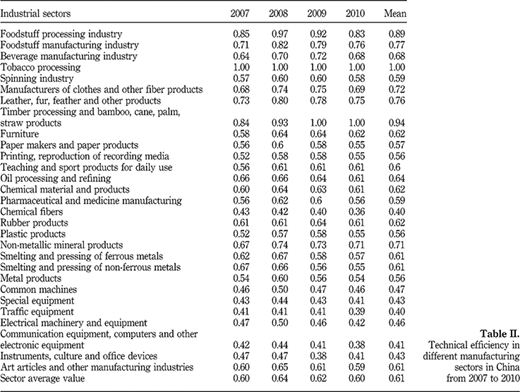
In this section, we discuss the technical efficiency of manufacturing sector in China using the data selected as input and output variables. In the first stage, the DEAP2.1 software is used to evaluate technical efficiency, as shown in Table II which provides us with the results obtained from BCC model analysis. When environmental factors are not considered, technical efficiency in manufacturing sectors in China has the following characteristics.
First, the difference in technical efficiency among industrial sectors is substantial. For example, in 2007, the technical efficiency of the most efficient industrial sector, tobacco processing, is 1, while that of the least efficient industrial sector, traffic equipment, is only 0.413. The former is bigger than the latter by 0.587. The relative performance was similar in the following year. Moreover, technical efficiency of tobacco processing is higher than that of instruments, culture and office devices by 0.622 in the year of 2009. In 2010, both tobacco processing and timber processing and bamboo, cane, palm, straw products have a score of 1 which indicates their strong competitiveness over the period of our study among 29 different industrial sectors.
Second, the average efficiency score reported is around 0.61 implying the quantity of inputs still needs to be reduced to achieve optimum resource allocation while remaining the same level of output. It is obvious that China's manufacturing sector arises from an unbalanced production structure. In general, manufacturing sector in China has much room to improve in the terms of technical efficiency.
Finally, all industrial sectors have shown the best efficiency performance in 2008 before they started to decline at different rates in the following years.
According to the input slacks in the first stage, we can find that the input slacks of current assets are mostly near zero excluding individual industrial sectors. This result indicates that decreasing current assets does not reduce efficiency. In other words, technical efficiency may be improved if we increase the quantity of current assets. Conversely, slacks in terms of fixed assets and labor force are higher than that of current assets. Obviously, manufacturing sectors in China still follow the extensive growth pattern. Simply relying on expansion of scale and labor force cannot maintain the increasing returns to scale. We should promote economic growth on the basis of resource reservation.
Then, we employ the hierarchical clustering analysis method according to the calculated efficiency in the first stage, and divide the industrial sectors into three clusters, as shown in Table III.
The industrial sectors in Cluster 1 have the efficiency score of 0.826, 0.904, 0.898 and 0.868 from 2007 to 2010. It means that when environmental variables are not considered, those sectors perform well in terms of technical efficiency. Cluster 2 includes seven industrial sectors; the annual average efficiency scores among these sectors during 2007-2010 are 0.441, 0.454, 0.422 and 0.404. Notably, technical efficiency in this cluster is much lower than that of the first cluster. As for Cluster 3, it contains the rest of the 17 industrial sectors, which are not included in Cluster 1 or 2. During 2007-2010, the average technical efficiencies of the 17 industrial sectors in Cluster 3 are 0.598, 0.641, 0.624 and 0.599, lying between the average technical efficiency of Clusters 1 and 2.
Manufacturing sectors can be divided into three categories namely light spinning and textile, resources processing and mechanical-electronics. Each of these categories has distinguished and outstanding features:
Light spinning and textile sector is characterized by labor-intensive with little “technology content”. The products in this sector have low added-value.
Resources processing sectors are famous for their production of high polluting, high energy-consuming goods.
Mechanical-electronic manufacturing is a pillar industry for the Chinese economy, which has high added-value and “technology content”.
According to the clustering results, we can see that textile manufacturing (Cluster 1) has the highest efficiency followed by resources processing sectors (Cluster 3) and the efficiency rank of mechanical-electronic manufacturing (Cluster 2) is the third. This pattern can be explained by the fact that China has advantages of production in terms of abundant labor force and thus the associated highly developed textile industries. Meanwhile, the development of high and new technology industries has lacked behind. The above results are obtained excluding the impact of the environmental factors. Therefore, we move on to include the environmental factors in the next stage.
4.2 The second stage: empirical results of SFA
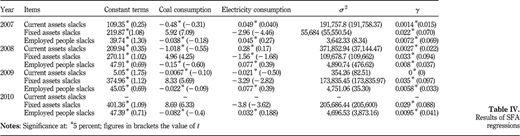
In the second stage, by adjusting using SFA, we wish to evaluate the impact of two environmental variables (electricity consumption, coal consumption) and statistical noise on input slack variables. The positive (negative) coefficients suggest that the environment is unfavorable (favorable) due to the greater (lesser) use of input (Shyu and Chiang, 2012). Regression coefficients are summarized in Table IV.
According to Table IV, in every input slacks equation, the γ value is close to zero, significant at 5 percent. It indicates that managerial inefficiency does not affect technical efficiency or it cannot be proved that efficiency differential comes from statistical noise. Hence, we can conclude that environmental factors exert great effect on the efficiency score of manufacturing sectors.
First, we take coal consumption for example. The negative coefficient of current assets and number of employed suggest that the greater the environmental variable is, the less quantities of current assets and employed people will be required while the sign of the coefficient of fixed assets shows the opposite story. In general, the increase in coal consumption may be due to the growth in the investment of fixed assets until a certain point. This can be explained by the fact that industries using more coal as the energy source tend to choose labor saving method.
Then, we turn to electricity consumption. Environmental factor is unfavorable (favorable) due to the greater (lesser) use of current assets and employees (fixed assets). This finding may indicate that increasing use of electricity leads to rising current production cost, while decreasing fixed cost.
After the adjustment of the uncontrollable factors in the second stage, we re-calculate the true managerial efficiency level of different industrial sectors.
4.3 The third stage: empirical results of adjusted DEA
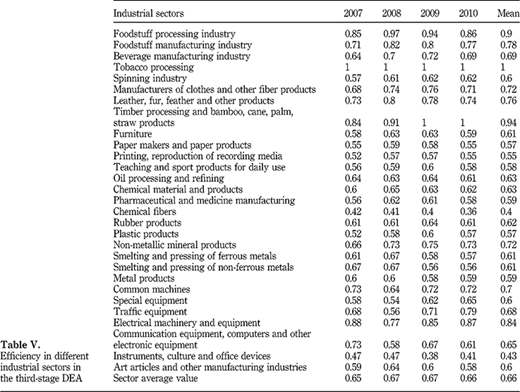
In third stage, this paper concludes with the DEA of the organizational performance using adjusted data from the second stage, thereby revealing a measure of performance based on true managerial efficiency only. Table V shows the efficiency analysis under the third-stage DEA estimate.
Table V shows that, after adjusting the uncontrollable factors, the average efficiency increases by 6.45 percent. Small efficiency change denotes that the increase of efficiency depends on both development of low-carbon economy, relevant policies and domestic and world economy. According to this result, low-carbon economy does not sufficiently restrict the development of manufacturing sectors in China. And we find there are five sectors with remarkable improvement in technical efficiency, namely common machines (up by 0.23), special equipment (up by 0.17), traffic equipment (up by 0.28), electrical machinery and equipment (up by 0.24) and communication equipment, computers and other electronic equipment (up by 0.24). Thus, we can infer that low efficiency in these sectors was mostly dues to the existence of environmental factors. By including the constraint of low-carbon economy policies, efficiency of all of the above sectors changes significantly.
As in Table VI, we present re-clustering results using hierarchical cluster analysis based on the adjusted technical efficiency. Cluster 1 includes six sectors, one more sector than that of the first stage. As the most efficient clustering, Cluster 1 has an average efficiency of 0.835, 0.878, 0.895 and 0.883, respectively, from 2007 to 2010. In contrast to the first stage, only two sectors have the worst performance in third stage, namely chemical fibers and instruments, culture and office devices. These two sectors have average technical efficiency 0.445, 0.44 and 0.39, 0.385, respectively, during the period of 2007-2010. Again, clustering three contains 21 sectors with all having medium level of efficiency compared to other sectors (i.e. 0.613, 0.627, 0.638 and 0.623).
5 Conclusion
This paper uses a Three-stage DEA approach to measure the technical efficiency of 29 industrial sectors in China from 2007 to 2010. Results show that under the constraint of low-carbon economy, manufacturing sector will be affected. Several interesting results emerge from our analysis.
First of all, we find that in general manufacturing industry in China is characterized by producing low quality goods with low productivity at high levels energy consumption and pollution. Low technical efficiency in the overall manufacturing sectors implies that there is plenty of room for improvement in productivity in those sectors. Again, when comparing the performance within manufacturing industry, we can find that textile manufacturing is relatively more efficient as a result of a long history of development while mechanical and electronic industry has bad performance. Today, textile manufacturing, mechanical and electronic industry and resources processing industry account for roughly the same percentage in terms of output (over 30 percent), therefore, relying only on one industry to ensure sound and rapid economic growth is not feasible. With the economic and technological development, the growth should be changed from the primitive mode into subtle mode.
Second, after controlling for the environmental variables and statistical noise, the average technical efficiency of manufacturing has changed. And the coal consumption and electricity consumption have different impact on slack variable. Increasing coal consumption helps to reduce inputs of current assets and number of employees but increases input in fixed assets. As for higher electricity consumption, we could reduce the amount of the waste of fixed asset investment, but it has a negative impact on the current assets and employment. This finding suggests that to achieve a low-carbon economy, China should invest more fixed assets in industrial sectors where coal is badly needed. In comparison, we can use more current assets and higher employment to ensure higher level of technical efficiency in industrial sectors which rely mostly on electricity consumption. Obviously, the biggest advantage of taking such different measures based on different sectors is that all sectors can improve their technical efficiency as well as meet acquirements of low-carbon economy.
Third, technical efficiency of manufacturing industry in China improves significantly in the third-stage DEA compared to the first stage. Moreover, it is shown that mechanical and electronic industry efficiency has a substantial increase from the conducted cluster analysis. Meanwhile, textile manufacturing keeps high level of overall technical efficiency all the time. The reason is that textile manufacturing has a strong industrial foundation, abundant raw materials and labor supply.
Based on our findings, we propose some policy recommendations to improve the technical efficiency of manufacturing industry in China. As for textile manufacturing, the first thing we can do is to consolidate this sector's strong competitiveness. And then, paying much more attention to improve the efficiency of Mechanical and electronic industry and resources processing industry. Forcing more on energy-saving management is as important as improving productive technique. In other words, Chinese Government mainly needs to strengthen its dissemination of information on energy conservation in industries and to achieve further optimization industrial structure in order to increase overall technical efficiency of Chinese manufacturing.
Of course, due to unavailability of data in China, the empirical study is based on data for the last four years, and there is a need for data to be collected over a longer period of time. Furthermore, the environmental variables used in the present study include two energy consumption variables, and other variables such as CO2 emissions and other qualitative variables. Finally, a closer look should be at the determinants of efficiency for industrial sectors, and the Three-stage model of how the DEA continues to be improved to better fit the actual situation of China's low-carbon economy will be the focus of future research directions.





Technical efficiency in different manufacturing sectors in China from 2007 to 2010
Technical efficiency in different manufacturing sectors in China from 2007 to 2010

Results of clustering analysis according to technical efficiency of industrial sectors
Results of clustering analysis according to technical efficiency of industrial sectors

References
This article is supported by the National Natural Science Foundation of China (Grant No. 71201139, 71171001), Program for New Century Excellent Talents in University (Grant No. NCET-12-0595), the Bureau of Statistics of China (Grant No. 2011LD002, 2012LD001) and Fundamental Research Funds for the Central Universities (2010221040). The authors would like to thank the editors and reviewers for their careful review and insightful comments, which have led to significant improvement of the article.

