


– The purpose of this paper is to investigate the effects of technology progress on carbon intensity in China. Abatement of carbon emission has become one of the most important targets for the Chinese government. Numerous studies confirm that technology progress is the main factor responsible for reduction in CI. However, very few studies analyze the impacts of technology progress on CI for various regions. There is also inadequate knowledge on the transmission mechanisms of the impacts. These are the motivations for this research.
– Given energy consumption and CO2 emissions, an improved MLPI, which stands for the generalized technology progress related to energy and environment, is introduced and decomposed into technical and efficiency changes. Using a panel data of 30 provinces from 1997 to 2012, the authors construct different panel data models to investigate the effects of technology progress (and its decomposition elements) on CI.
– Results show that technology progress is conducive for reducing CI, with the main factor being technical change. It also finds that the two components of technology progress have completely different effects in the three regions of China. Dynamic panel data models with threshold effects indicate that capital deepening enforces and weakens the negative effects of technical change and efficiency change on CI.
– The above conclusions provide new evidences for policy-makers with respect to capital deepening, technical innovation and allocative efficiency enhancement with a view to achieving CI reduction.
1. Introduction
1.1 Background
In recent years, the frequency and intensity of air pollution in China has aroused wide public concern. In years 2013 and 2014, haze covered over 1.3 million square kilometers area in east-central China for long period, and most cities experienced high levels of PM 2.5. These are evidence of the huge environmental costs of China’s economic growth. Since 2009, reducing carbon intensity (CI) – defined as the amount of CO2 emissions per unit gross domestic product (GDP) – has become one of the most ambitious targets of the Chinese government. Compared with reducing energy intensity, the above target is progressive because it implies China should not only enhance energy efficiency, but also optimize the energy consumption structure (ECS). It is generally accepted that industrial structure adjustment and technology progress are two main ways to improve energy efficiency. However, a recent study confirms that the impact of changes in industrial structure on energy efficiency has directional properties or “structural bonus” under a certain situation (Li and Lin, 2014). Thus, technology progress is the most important factor impacting energy conservation and emission abatement (IPCC, 2000) and CI.
Technology progress impacts CI in different ways. The most important as stated above is through energy efficiency. In addition, technology progress induces continuous factor shift from low-efficiency sectors to high-efficiency sectors, which is conducive for improvement in factor allocative efficiency (Harberger, 1998; Krüger, 2008) and CI reduction. Finally, technology progress is beneficial to energy substitution, that is, substitution of coal with clean energy.
Given the role of China in global climate change governance, a number of studies have investigated the CO2 emissions and CI of the country. Zhang et al. (2011b) adopted the log mean Divisia index (LMDI) method to decompose China’s CO2 emissions during 1995-2009, and found that its mitigation is highly dependent on technology development. Ren et al. (2014) applied the LMDI model and found that reduction in energy intensity was a crucial factor for reducing CO2 emissions. Using the same method, Lin and Ouyang (2014) confirmed that energy intensity was the major contributor to emissions mitigation. Using slacks-based measure (SBM) model incorporated with CO2 emissions, Wei et al. (2012) found that there exists a large gap in potential reduction capability and marginal abatement cost among the eastern, central and western regions of China.
Given China’s CO2 intensity target of 40-45 per cent reduction from 2005 level by 2020, many scholars have analyzed the goal’s feasibility and the influencing factors of China’s CO2 intensity. Stern and Jotzo (2010) indicated that China’s emissions intensity target for 2020 was not “business as usual” but ambitious and feasible. Yuan et al. (2012) claimed that China’s target was consistent with the long-term vision of its overall socio-economic plan. Geng et al. (2011) argued that it was urgent for China to implement various measures to achieve emissions intensity targets. Fan et al. (2007) adopted adaptive weighting Divisia index method (AWD) to decompose China’s CI, and found that energy intensity was the overwhelming contributor to the decline in CI. The results of He et al. (2012) showed that promoting technological innovation is not only beneficial for reducing CI, but also for reducing future total CO2 emissions. Adopting the LMDI, Li et al. (2014) found that technological progress was the main contributor to reduction in CI. The results of scenario analyses also concluded that technological progress is the most important factor for China’s emissions abatement (Li et al., 2012; Wang and Liang, 2013; Jiao et al., 2013).
1.2 Terminology illustration
Nearly all existing studies confirm that technological progress is a major contributor to CI reduction in China. However, there is no consistent definition of technological progress in these studies. Some studies applied energy intensity as technological progress (Ren et al., 2014). However, energy intensity is a comprehensive indicator, and it reflects not only technological progress but also industrial structure and energy mix change (Sun, 2002). Most studies take total factor productivity (TFP) as technological progress, as calculated by Solow residual (Yuan et al., 2009), the data envelopment analysis (DEA)-Malmquist model (Li et al., 2013; Chen and Yang, 2011) or the stochastic frontier analysis (SFA) model (Cao, 2008). There are some restrictive assumptions about the Solow residual method and the SFA model. DEA-Malmquist index approach or the Malmquist productivity index (MPI), based on the distance function and mathematical optimization, require neither specification of functional form for the technology nor any assumption about market structure and absence of market imperfection. It also can be decomposed into different elements.
Most studies adopt non-parametric deterministic frontier data envelopment analysis (DEA) framework and MPI to estimate TFP growth. The MPI expressed as a DEA has proved suitable for measuring TFP growth (Chen et al., 2008; Li et al., 2013; Shestalova, 2003; Kumar and Russell, 2002).
However, the MPI does not take the “bad” output (namely, CO2 emission in this paper) into consideration. Nanere et al. (2007) argued that the result was biased without considering environmental cost. In other words, it is a tendency to over-estimate TFP performance without considering “bad” outputs (Zhang et al., 2011a).
Li et al. (2013) measured TFP growth by DEA-Malmquist index and regarded it as technological progress. The study then analyzes the effects of TFP and its components (i.e. technical change, the pure efficiency change and the scale efficiency change) on energy intensity in China.
Similarly, in this research, we use an improved Malmquist–Luenberger productivity index (MLPI), which incorporates energy consumption and CO2 emissions, to measure the “generalized” and “true” technological progress or “green” TFP growth. For proper expression and to avoid confusion, we use the terminology “technology progress” rather than technological progress hereafter to indicate the MLPI. The components of MLPI – technical change and efficiency change – are called technical progress and efficiency improvement, respectively. They reflect energy- and environment-related technology progress from technological development and factor re-allocation effects, respectively.
Many previous studies adopt “technical change” to measure technology progress. However, we believe it is inaccurate. Here are two reasons. First, technical change only measures changes in production frontier, and this change is mainly related to the introduction of new or innovative technologies. Second, efficiency change reflects the ability to catch up with the current production frontier of an inefficient DMU, and it is the ability to improve the allocation efficiency (or the efficiency of resource utilization), which should be regarded as an indivisible part of technology progress.
Krüger (2008) argued that technology progress in evolutionary perspective was inevitably associated with structural change. This implies that technology progress can be driven by innovative or structural changes. As stated above, the former is reflected by technical change. Structural change, such as industrial restructuring or the emergence of a new industry, plays a very important role for productivity growth (in this paper, it refers to MLPI improvement or technology progress) through allocation efficiency improvement, such as the technology spillover effect (Fagerberg, 2000; Carree, 2003). Obviously, this is consistent with the meaning of efficiency change. Thus, it is reasonable to say that technical change and efficiency change are two types of technology progress.
1.3 Our motivation
The purpose of this paper is threefold:
we present an improved method to calculate the MLPI to estimate the generalized technology progress, and decompose it into technical change and efficiency changes;
we analyze the different effects of technology progress and its components on CI in the three regions of China; and
we investigate the transmission mechanism of the impact of technology progress on CI to provide evidence on a suitable technology progress path.
These are the main contributions of this paper.
2. Methodology
2.1 Technology progress: an improved Malmquist–Luenberger index approach
Economic theory suggests that sustainable growth only depends on technology progress, which is often measured by TFP growth (Zheng et al., 2009). Traditionally, TFP is calculated using just capital and labor as inputs in the production function, neglecting both the energy inputs required for economic growth and their environmental impacts. Chung et al. (1997) introduced a directional distance function and used it to calculate a new measure of TFP growth, known as the MLPI. This paper incorporates a “bad” output (CO2 emissions) and applies the MLPI to obtain the “true” evaluations of China’s technology progress.
The objective of this paper is to analyze the effects of technology progress on CI of 30 provinces in China (except for Tibet) for the period 1997-2012. Suppose that each province uses three inputs, including labor (L), capital (K) and energy (E), Inline Equation 1, and produces one “good” output, gross region product (GRP ∈ R+), and one “bad” output, carbon emissions (C ∈ R+). We can describe technology in a very general way via the output sets as follow: Equation 1
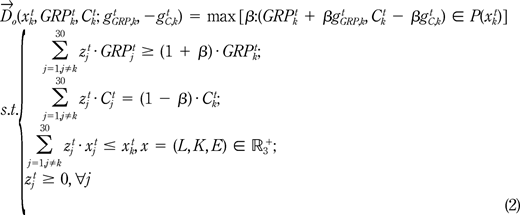
P(x) is a set that can maximize the “good” outputs (GRP) and minimize the “bad” outputs (C) at the same time by a given input vector x. We assume that P(x) meets some basic assumptions as mentioned in Färe et al. (2007). Also, we assume the vector of “directions” of province k at period t is Inline Equation 2, that is, good outputs are increased and bad outputs are decreased. Following Chung et al. (1997), the output sets for province k at period t that meet the above assumptions can be calculated by solving the following linear programming problem: Equation 2
The non-negativity of Inline Equation 3implies that the production technology exhibits constant returns to scale (Färe and Grosskopf, 1996). It is worth noting that Model (2) eliminates province k to construct the production frontier when evaluating it, meaning the super-efficiency DEA model is used to calculate the directional distance functions (DDF), so the results of Model (2) will be fully comparable across observations (Zou et al., 2013).
However, the super-efficiency DEA model may have infeasible solutions for efficient DMUs as shown in Zhang et al. (2011a). In fact, super-efficiency is interpreted as input saving or output surplus achieved by a specific efficient province; infeasibility does not necessarily mean the highest super-efficiency (Chen, 2004). However, infeasibility often occurs in the case of the variable returns to scale (VRS) super-efficiency model, while the constant returns to scale (CRS) super-efficiency DEA model is always feasible if one assumes that all data are positive (Seiford and Zhu, 1999; Zhu, 1996).
According to Chung et al. (1997), the output-oriented MLPI is Equation 3
Furthermore, it can be broken down into two components, namely: Equation 4 Equation 5
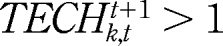
TECH measures the technical change in the production of good and bad outputs, and Equation 6 signifies technical progress or the shift in the production frontier under the total-factor framework. Otherwise, it indicates technical regress. EFFCH is the change in relative efficiency, indicating that the province is getting closer to or farther from its annual frontier (catch-up effect or fall-behind effect) (Chung et al., 1997; Hoang and Coelli, 2011; Zhang et al., 2011a).
In this paper, technology progress and its types are defined by MLPI and its components (TECH and EFFCH), and we analyze their impacts on CI in China. The results may give explanations of the transmission mechanism of the impact.
2.2 Basic models: specification and modeling issues
Similar to Li et al. (2013), we propose the following empirical model to analyze the effects of technology progress on CI: Equation 7
where CI, GPC, ES, ECS are CI, GDP per capita, economic structure (ES) and ECS, respectively. TP is technology progress, and is measured by MLPI or its components (TECH and EFFCH). Ln is the logarithmic operational. αiis the individual effect, and uit is a random term.
Model (6) is a static panel data model. Zhou et al. (2013) suggested the need to construct a lagged dependent variable to transform the static model into a dynamic one to avoid potential simultaneity bias, as well as reverse causality between the independent and dependent variables. Therefore, a dynamic model is expressed as follows: Equation 8
Model (7) is the basic model of this paper. An important empirical issue – endogeneity – should be addressed to avoid bias and inconsistency of parameter estimation. Here, the endogeneity is mainly embodied in the simultaneity bias, the lagged dependent variable (CIi,t−1), the omitted variables and the measurement errors.
Generally speaking, a province with higher TP usually has more resource and incentive to enable it to use cleaner coal or consume more energy, thereby lowering CI. Likewise, CI has been shown to affect TP – such as through adopting the latest equipments with advance technology[1]. In addition, GPC is believed to affect TP – through higher income, higher level of human capital and advanced equipments. TP is widely believed to be the main factor for GPC growth. In this paper, we correct for the above simultaneity bias by using lags of TP and GPC (up to one lags) as instruments.
For the endogenous variable in Model (7), that is CIi,t−1, a simple way is to adopt the instruments lags of CIi,t−1 (up to two lags) in GMM. In fact, both the difference GMM (Arellano and Bond, 1991) and the system GMM (Blundell and Bond, 1998) can effectively address this problem.
There are many factors that influence CI, but we cannot incorporate all related variables in a model and, hence, some omitted variables. When the omitted variables are systematically correlated with the explanatory variable, there is omitted-variable bias in the model. In Model (7), the lagged dependent variable (CIi,t−1) can reduce or prevent the omitted-variable bias (Hsiao, 2003). In addition, the differencing method in the process of the difference GMM or the system GMM will also eliminate the impacts of omitted variables either by remaining constant through time for a given province or for all provinces at a given point in time or a combination of both.
It is widely argued that energy data in China, and particularly CO2 emissions, have measurement errors. Note that any permanent additive measurement errors are absorbed into the time-invariant individual effects and, hence, controlled for and eliminated by the differencing process. However, the differencing method eliminates one source of bias but creates another, which may result in even more biased estimates than simple least-squares estimators (Griliches and Hausman, 1986). For the remaining measurement errors in CO2 emissions data, the preferred solution typically involves instrumental variables (Hsiao, 2003; Baltagi, 2005). The structure of the measurement error is unknown, hence the adoption of the lags of CI and TP as instruments, which will potentially allow consistent estimation results (Wansbeek, 2001; Bond et al., 2001).
Based on the above analysis, instruments lags of CI, GPC and TP are adopted in the difference GMM or the system GMM, and will eliminate the endogeneity caused by simultaneity bias, the endogenous variable and possible measurement errors. Furthermore, the differencing process will eliminate the reverse causality relationship and partly reduce or avoid the omitted-variable bias.
2.3 The improved models: heterogeneity analysis
Model (7) assumes that all provinces have the same impact of technology progress on CI, which may weaken its explanation in the case of China, because of huge differences in development and allocation of resources across provinces. Therefore, this paper improves Model (7) by two methods. First, we estimate the sample divided into three regions: the eastern region (including 12 provinces, namely: Beijing, Tianjin, Liaoning, Shanghai, Jiangsu, Zhejiang, Fujian, Shandong, Guangdong, Guangxi and Hainan), the central region (including 9 provinces, namely: Shanxi, Inner Mongolia, Jilin, Heilongjiang, Anhui, Jiangxi, Henan, Hubei and Hunan) and the western region (including 9 provinces, namely: Chongqing, Sichuan, Guizhou, Yunnan, Shaanxi, Gansu, Qinghai, Ningxia and Xinjiang).
Second, we apply threshold effects into Model (7). Similar to the method of Hansen (1999), the model of interest is: Equation 9
where I(qit<γ)is an indicator function. qit is the threshold variable and γis a threshold value. The effects of technology progress on CI depend on whether the threshold variable qit is smaller or larger than the threshold γ, and they can be measured by β4(I = 0) or β4+β5(I = 1). Two motivations underlie Model (8). First, although many empirical results declared that technology progress is beneficial for CI reduction, the relationship between them may be non-linear, and previous studies do not consider this. Second, we can identify the effect of technological or efficiency changes on CI, and the result is useful for understanding the transmission channels of the impact of technology progress on CI.
We use the difference GMM with two-step estimator to estimate Models (7) and (8). The GMM estimator minimizes the weighted sum squares of sample moments (J statistics) rather than residual sum of squares. So we estimate γ^by minimizing J statistics in Model (8), and obtaining the estimator at the same time, that is Inline Equation 4. The subscript D-GMM means that the estimation method is the difference GMM. In addition, the likelihood ratio statistic for tests on γintroduced by Hansen (1999) is unsuitable. We introduce a new statistic to test γ and name it F_J statistic.
To test the H0: β5 = 0, we note J statistics for Models (7) and (8) which are Inline Equation 5 and Inline Equation 6, respectively. Then, F_J statistic is: Equation 10
where M is the number of moments for Model (7) and m and k are the number of moments and parameters to be estimated for Model (8). Under H0, the threshold γ is not identified, so F_J statistic tests have non-standard distributions. This is typically called the “Davies Problem”. We obtain asymptotically valid p-values constructed from a bootstrap procedure. The calculation procedures are similar to Hansen (1999). The null of no threshold effect is rejected if the p-value is smaller than the desired critical value, and we choose Model (8).
3. Variables and data
3.1 Carbon intensity
CI is defined as the CO2 emissions per unit GDP, in which CO2 emissions are calculated by the reference method (IPCC, 2000). Energy consumption is broken down into eight fuel categories (including coal, coke, crude oil, gasoline, kerosene, diesel oil, fuel oil and natural gas). Each fuel consumption data are collected from the China Energy Statistical Yearbook.
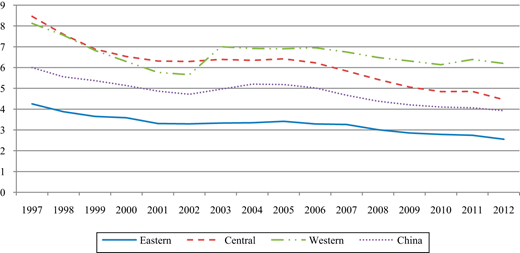
CI declined from 6.002 ton/10,000 RMB (constant 2000 price) in 1997 to 3.928 ton/10,000 RMB in 2012, indicating an annual decrease of 2.722 per cent (Figure 1). It can be seen that the CI in the eastern region is lower than the national average, while that in the central and western regions are higher than the national level. In addition, the trends of CI in the eastern and central regions are similar in that they are decreasing except in the period 2003-2005. For the western region, CI declined sharply at an annual rate of 6.947 per cent during 1997-2002. However, it increased in 2003 only to decline slowly at a rate of 1.322 per cent thereafter. In 2012, CI in the western region was 6.198, higher than in 2002 (5.568). During the entire sample period, the annual decrease rate in the western region is 1.522 per cent, lower than in the eastern and central regions (3.284 and 4.114 per cent, respectively).
3.2 Technology progress
Technology progress is considered to be the most important influencing factor of CI (Li et al., 2013). In this paper, technology progress and its types are calculated by equations (3)-(5) after determining the input and output variables. Therefore, we collect data on inputs (including capital stock, labor and energy inputs) and outputs (GRP and CO2 emissions) for China’s 30 provinces between 1997 and 2012. All data are provided by Li and Lin (2015).
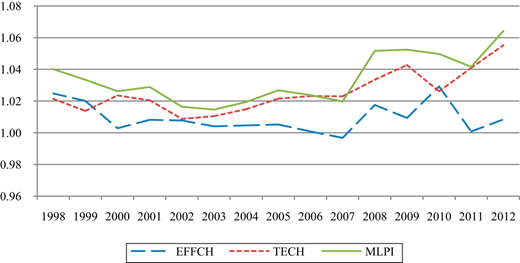
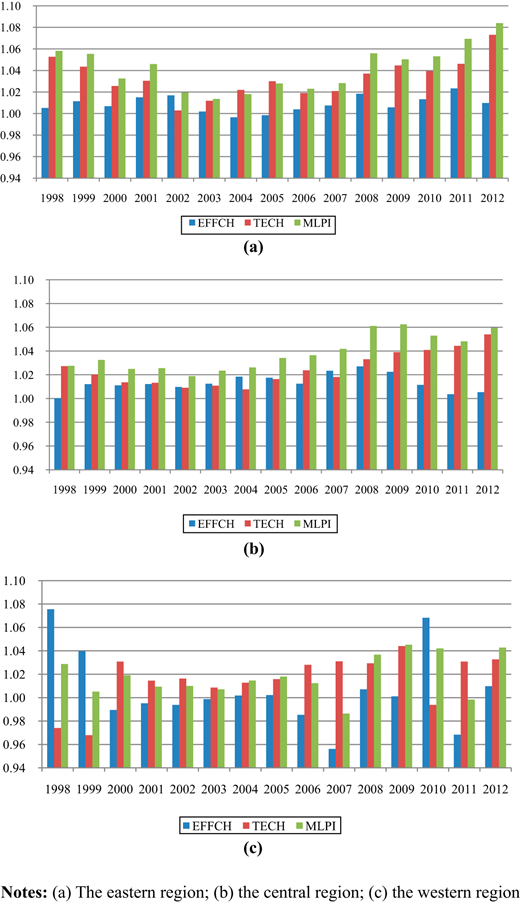
The results of MLPI show that the annual average increase in technology progress in China is 3.395 per cent (Figure 2). The decomposition results for MLPI show that although average efficiency (EFFCH) increased (0.939 per cent) over the 1998-2012 periods, technical changes (TECH) (2.532 per cent) were the main source of technological improvement.
As can be seen from Figure 3, technology progress was greatest in the eastern region (4.231 per cent per year), followed by the central region (3.836 per cent per year) and then the western region (1.837 per cent per year). It also shows that the contributions of TECH and EFFCH to technology progress are different in the three regions.
3.3 GDP per capita
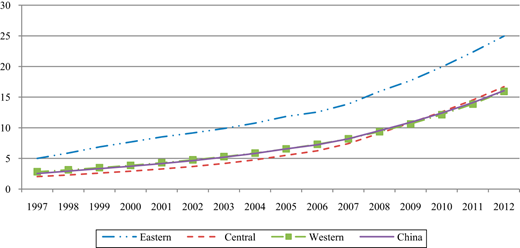
In this paper, GDP per capita (GPC, constant 2000 price) indicates the development level, and the data are collected from the National Bureau of Statistics of China. According to Figure 4, the eastern region has the highest development level, followed by the central and the western regions. In 2012, the GPC in the eastern region is about 1.72 times and 2.31 times higher than that in the central and western regions, respectively.
In general, the technical level and resource allocation efficiency vary with economic development. Hence, we have reasons to believe that CI performance will vary with economic development or regions in China.
3.4 Economic structure
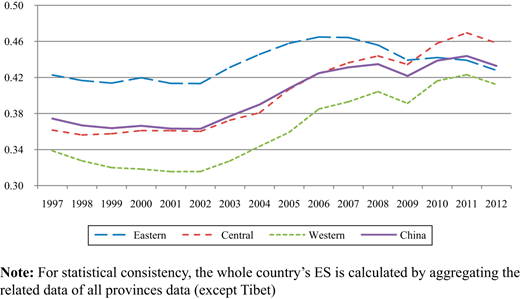
ES is defined as the percentage of value added by industry[2]to GDP, and the data are obtained from the National Bureau of Statistics of China. During 1997-2012, the value added of the secondary industry to GDP is always higher than 45 per cent, and in the secondary industry, the building sub-industry accounts for a small share. Because the industry is a major energy-consuming and carbon-emitting sector, it has an important impact on CI.
The proportion of industrial value added to GDP fluctuates around 40 per cent between 1997 and 2012 (Figure 5). But the proportion of the central and (especially) the western regions increased from 36 and 34 per cent in 1997 to 46 and 41 per cent in 2012, respectively. Obviously, this is consistent with the different levels of industrialization in the three regions.
3.5 Energy consumption structure
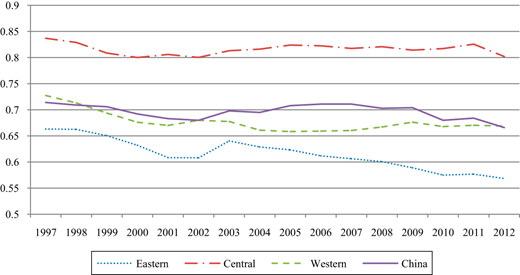
ECS is defined as the share of coal in aggregate energy consumption, and the data are obtained from the Statistics Yearbooks of each province. Coal burning emits a large amount of CO2. China is one of the few countries with coal serving as the primary energy source. It currently accounts for more than 65 per cent of total energy consumption. This makes the efforts to reduce the proportion of coal in the total energy consumption insignificant. In 2007, the ECS is as high as 71.1 per cent. During 2011-2012, it declined sharply and stood at 66.6 per cent in 2012 (Figure 6).
In terms of regions, the central region has the highest ECS, which is always above 80 per cent. This is followed by the western region, with an annual average of about 67.7 per cent. In the eastern region, ECS decreased from 64.1 per cent in 2003 to 56.8 per cent in 2012 (Figure 6).
3.6 The threshold variable: the ratio of capital to labor
In Model (8), the threshold variable has great impact on the estimate results. Since 1997, an important feature of China’s development is rapid industrialization, especially in heavy industries, which facilitates faster growth rate of capital stock than labor force, thereby increasing capital deepening (in this paper, it is measured by the ratio of capital to labor, and capital and labor are as discussed earlier) (Fisher-Vanden and Jefferson, 2008). Thus, China’s economic growth is an inevitable process of capital deepening. This process promotes not only industrialization but also productivity growth (Ahmed, 2012). However, the process of industrialization varies across the provinces (Chen et al., 2012). So we have reasons to infer that the process of capital deepening across the provinces is different. The capital-labor ratio in the eastern region is much higher than the other two regions (Figure 7).
In theory, capital deepening means the substitution of capital for labor, which would promote technology progress and industrial upgrading as a result of higher capital productivity relative to labor productivity (Judzik and Sala, 2015). Therefore, capital deepening helps to improve capital efficiency, increase the ratio of outputs to inputs, and thereby enhance the impact of technology progress on CI. On the other hand, capital deepening will reduce the employment elasticity of GDP, and it results in industries becoming energy intensive, which leads to energy shortages and environmental degradation. In short, capital deepening may not necessarily promote technology progress when energy and CO2 emissions are considered (namely, MLPI in this paper).
There are many studies analyzing the relationship between capital deepening and TFP (calculated by Solow residual or SFA). However, capital deepening means biased or non-neutrality technology progress, while TFP measures neutrality technology progress. So analyzing the relationship between them may have logical errors (Boucekkine et al., 2005; Felipe, 1999)[3]. This is why we calculate the MLPI using the DEA method. Logically, the MLPI calculated in this paper includes both neutral and non-neutral technology progress for the methodology in Section 3.2[4].
The purpose of this paper is to analyze whether the process of capital deepening which is accompanied by energy shortages and environmental degradation weakens the effects of technology progress on CI. If the answer is yes, then the question of “why” arises. In theory, China’s capital deepening is not consistent with its resource allocation, which may deteriorate the efficiency of resource allocation and consequently reduce the negative effects of efficiency change (EFFCH) on CI. On the other hand, there is a significant capital embodied technology progress in China, and it has negative effects on energy intensity (Li and Lin, 2014). So capital deepening may strengthen the negative effects of TECH on CI. Testing and confirming the above relationship is meaningful for China’s effort to undertake “energy-saving and emissions- reduction” effectively.
4. Results and discussion
4.1 The static model
Table I displays the regression results for the static model. The Hausman results show that the FE models are preferred for all the regions. Thus, only FE models are presented[5].
The results of Models 1, 5, 9 and 13 show that technology progress (MLPI) has negative impacts on CI at the aggregate level in China and in the three regions, and are statistically significant at the 10 per cent level or lower. Models 3, 7, 11 and 15 indicate that the main contributor of technology progress to CI is TECH or the best practice frontier moves outward.
After considering the possible endogeneity problem from simultaneity bias, omitted variables and measurement errors, we regard the variables of LnGPC and TA as endogenous variables, and use their lags (up to one lags) as instruments. These results are presented by FE_IV models (Models 2, 4, 6, 8, 10, 12, 14 and 16) in Table I. We can conclude that technology progress is conducive for CI reduction, and the main channel is through possible movement of production boundary outward (technical change) by developing and using the latest technologies.
4.2 The dynamic model
The dynamic model (7) is an interesting model, and the estimators obtained using the difference GMM with consideration of the endogeneity problem are displayed in Table II.
The Wald tests imply that the models provided a good explanation. The AR (2) test means there is no second-order serial correlation for the random term. The feasibility of the instrumental variables is confirmed through the Sargan tests. Based on these tests, the effectiveness and consistency of the GMM estimator in estimating Models (17) to (24) are verified.
The results of Models (17), (19), (21) and (23) confirm that the MLPI has negative effects on CI. In the central and western regions, the effects of MLPI on CI are much higher, implying that the regions can depend on technology progress to offset the adverse effects of ES and ECS on CI and ultimately reduce CI. In the eastern region, the absolute effect value of MLPI on CI is relative small, implying that the region should make great efforts to readjust its industrial structure and ECS to take advantage of technology progress to reduce CI.
We further decompose MLPI into TFECP and EFFCH, and the results are shown by Models (18), (20), (22) and (24) in Table II. Both TFECP and EFFCH have negative effects on CI, but it is not significant in the western region (Model 24). TFECP is the main contributor to reduction in CI (Model 18), suggesting that technical change (or the outward movement of the production possibility boundary through development and adoption of latest technologies) significantly reduce CI, while efficiency changes from allocation improvement have little effects on CI reduction. Based on the relationship between structural change and efficiency change, the negative effect of EFFCH implies that China’s structural transformation has a “structural bonus” on CI, but the impact is small. From another point of view, it means there is a great potential for structural transformation to achieve CI reduction.
The results of the eastern region are consistent with the results of the entire (aggregate) country, but the effect of efficiency changes is insignificant (Model 20). In the central region, the negative effect of EFFCH on CI is significant, while the negative effect of TECH is insignificant (Model 22). The low-level economy and technology may be a reason why TECH and EFFCH do not have significant effect on CI in the western region (Model 24).
In the eastern and central regions, ES has a significant positive impact on CI, which suggests that when other variables are controlled, a decrease in the proportion of industry in GDP will reduce CI. However, the coefficient of ES is insignificant in the western region (Model 23). Industries consume about 70 per cent of total energy and emit about 80 per cent of total CO2. In addition, six high energy-intensive industries[6] emit about 50 per cent of total CO2. Therefore, reducing the proportion of industry (especially energy-intensive industry sectors) in GDP is an effective strategy for reducing CI. However, China is in the process of industrialization, and the development of heavy industries is inevitable at this stage. So we do not think it would be appropriate to suppress the development of energy-intensive industry sectors. Perhaps, it is important to accelerate the development of some high-value-added industry sectors, such as communications equipment and electronics, as well as modern services, in a bid to reduce the proportion of industry in GDP.
Except for Models (21), (22) and (23), ECS is positively significant at the 5 per cent level, suggesting that a rising proportion of coal in total energy consumption increases CI. China has a huge coal reserve and coal dominates primary energy consumption. These make it difficult to change the ECS in the short term. Thus, the strategy should focus on accelerating the development of clean coal technology. In the long term, emphasis should focus on lowering the cost of clean energy through innovation and promotion of energy transformation.
The F_J tests in Table III suggests that capital deepening has impact on the relationship between technology progress and CI. Model (25) indicates that capital deepening enhances the negative effect of MLPI on CI. Specifically, when other variables are controlled, and the capital-labor ratio is lower/higher than 128,790 Yuan per capita, the effects of MLPI on CI are −0.439/−0.551(= −0.439 − 0.112). Model (26) reveals the possible reasons for this effect. Along with the process of capital deepening, technological changes (TECH) produce higher negative effect on CI, while efficiency changes (EFFCH) produce lower negative effect. Because the former is a major factor promoting reduction in CI, capital deepening still enhances the negative effect of MLPI on CI or the benefit of MLPI for CI reduction. These results indicate that although capital deepening is accompanied by increase in energy consumption and environmental pollution, it still improves the efficiency of carbon emissions through embodied technology progress.
There is no doubt that China is still in the process of industrialization and hence the yearly increase in the level of capital deepening. Our results reveal that capital deepening weakens the negative effects of efficiency change on CI. We believe that the main reason for this is that the distribution and structure of capital resources are at a very low level and need improvement. China is at the metaphase of industrialization, in which energy-intensive industries have a comparative advantage in terms of labor productivity and the marginal productivity of capital. However, these industries are energy intensive and emit large amounts of CO2. Hence, a forced mechanism must be immediately developed to accelerate structural upgrades, particularly by developing high-end manufacturing. In short, China should optimize the distribution and structure of capital resources among the manufacturing industries so as to improve the efficiency of resource allocation and consequently reverse the positive trend of EFFCH on CI.
5. Conclusions and policy suggestions
In this paper, we introduce a new MLPI, which combine super-efficiency DEA model with DDF, to measure generalized technology progress. Also, the decomposition results show two types or different sources of technology progress, namely, technical changes and efficiency changes.
Empirical results confirm that technology progress has the greatest effect on CI, and technical changes are the main transmission mechanism. However, this analysis is not applicable to the central and western regions because some conclusions drawn from the models may not be true. Technical changes have no significant influence on CI in the central region, and both technical changes and efficiency changes have no significant influence on CI in the western region.
Furthermore, we combine threshold effects with dynamic panel data models to analyze the impact of capital deepening on the relationship between technology progress and CI. The results show that capital deepening enhances the negative effects of technology progress on CI, and the main path is through technical changes. We also found that capital deepening weakens the negative effect of efficiency changes on CI.
The conclusions of this study reveal the impact and transmission mechanism of technology progress on CI, and also provide important policy implications.
First, technology progress, especially the narrow technical progress, could be the overwhelming contributor to the decline in CI. According to the DEA method and microeconomic theory, technical changes stand for the movement of production possibility frontier, and are promoted by technological innovation. In this sense, technical changes can be regarded as the narrow technical progress. Because the implementation of the reform and opening policy in 1978, China has participated in the global markets division through the “market in exchange for technology”, and through this, China has attracted substantial foreign direct investments. In this process, China has been enjoying the technological progress bonus of globalization. Meanwhile, China relies on foreign technology spillovers to promote innovation. As a result of the introduction of patented and proprietary technology, industrial process, advanced equipment and so on, China’s technology achieves a relatively low-cost and low-risk development, narrowing the technology gap with developed countries. In this way, China’s production possibility frontier moves outward. In other words, China promotes technology progress under the total-factor framework, thereby contributing to CI reduction. However, when the technology gap between China and advanced countries becomes narrow, the above path is accompanied with risk. For example, if the introduction of a new technology, which is usually embodied in equipment, does not match local resource allocation, then it may significantly worsen the efficiency to offset the negative effects of technical changes on CI because of capital deepening, thereby creating a disadvantage of technology progress on CI reduction.
Second, although efficiency changes plays a key role in CI reduction in the central region, its overall contribution is small. Generally speaking, efficiency changes measures the impacts of the factors allocation efficiency on productivity. The factors affect outputs through two ways – quantity effects (e.g. a huge capital accumulation) and efficiency effects. The latter means that the factors move from low productivity sub-sectors to high-productivity sub-sectors. Historically, China faced a shortage economy for a long time, and the development pattern paid more attention to quantity effects rather than efficiency effects. It results that some sectors (such as steel, cement) have a large inefficient and outdated capacity and face serious over-capacities. However, this over-capacity is hard to remove because of lagging factor market reforms. In recent years, the government has called for the closure of small plants and phasing-out of outdated and over-capacity in an administrative manner. In the short term, these measures could be effective. However, over-capacity is likely to occur repeatedly if we do not incorporate long-term polices and sustainable measures. In the context of policy design, we believe it is urgent to introduce market reforms (such as energy pricing reforms) and reduce barriers to factor mobility, so as to improve factors allocation efficiency.
Third, during the process of capital deepening, embodied technology progress (whether it is from innovation or introduction) may be conducive for improving capital utilization efficiency in the short term, but continued capital deepening will undoubtedly reduce the returns on capital. To maintain a certain rate of return on capital (and thus economic growth rate), a country may become over-reliant on inputs and, thus, fall into an extensive economic growth model, which makes transformation difficult to achieve. In fact, China’s return on capital has been declining sharply since 2003 (especially since 2008). This suggests that the path of China’s technology progress is not conducive for reducing CI in the long term. Therefore, it is urgent to enhance capacity for innovation and eliminate path dependence during technology introduction, so as to delay a downward trend of marginal outputs. This will thereby promote outward production possibility frontier movement, which is a long-term strategy to consistently reduce CI. The empirical results of this paper also reveal that technical efficiency is favorable to reduction of CI, but this effect weakened with capital deepening. This means that China should pay more attention to improving allocation of resources, as well as initiate corresponding policies and measures such as energy prices reform to make energy price signals real and effective and reduce investment barriers to promote capital flows.
Fourth, our results reveal that the technical level has impacts on the path of technological progress. For the central and the western regions, the relatively low levels of technology means their CI reduction can still mainly depend on technical introduction and imitation. Especially for the western region, the impacts of technical changes and efficiency changes on CI are not significant, indicating that this region, because of the relatively low level of technical basis, can take a variety of flexible measures to promote technological progress, thereby promoting reduction in CI through different types or sources of technology progress.














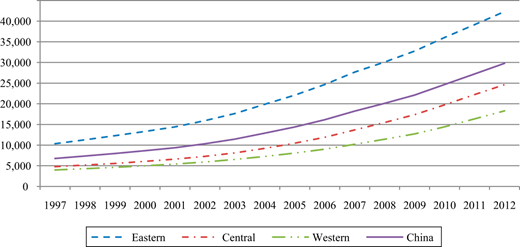
GDP per capita for three regions of China: 1997-2012 (RMB, constant 2000 price)
GDP per capita for three regions of China: 1997-2012 (RMB, constant 2000 price)
The ratio of capital to labor for China: 1997-2012 (10RMB/capita, constant 2000 price)
The ratio of capital to labor for China: 1997-2012 (10RMB/capita, constant 2000 price)
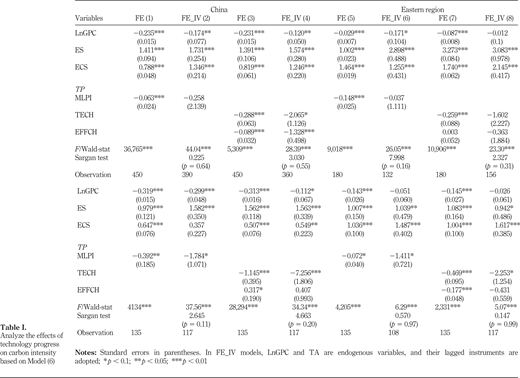
Analyze the effects of technology progress on carbon intensity based on Model (6)
Analyze the effects of technology progress on carbon intensity based on Model (6)
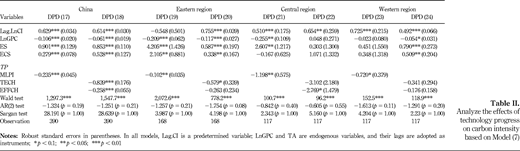
Analyze the effects of technology progress on carbon intensity based on Model (7)
Analyze the effects of technology progress on carbon intensity based on Model (7)
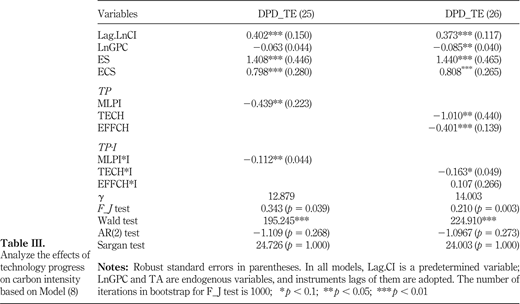
Analyze the effects of technology progress on carbon intensity based on Model (8)
Analyze the effects of technology progress on carbon intensity based on Model (8)
References
About the authors
Ke Li is an Associate Professor of Economics at Hunan Normal University (China). His research focuses on energy and environmental economics with a special emphasis on carbon emissions in China. He is devoted to using the frontier but appropriate econometrics methodologies to investigate energy and environmental issues. Currently, he is engaged in a study that shall integrate the market-oriented tools and administrative means into energy conservation and emissions abatement in China. Ke Li can be contacted at: likekent1208@163.com
Boqiang Lin. A “Chang Jiang Scholar” is a Professor, the Dean of China Institute for Studies in Energy Policy and the Director for China Center for Energy Economic Research at Xiamen University; the Vice Chinaman of China Energy Society; a Member of National Energy Consultation Committee under National Energy Commission; a Member of National Energy Price Consultation Committee under National Development and Reform Commission; a Member of Board of Directors and Chairman of Audit Committee of China National Petroleum Corporation; a Special Analyst for China Xinhua News Agency and a Guest Commentator for China National Radio. He is currently a member of the Energy Partnership Advisory Board and member of the Global Agenda Councils on Decarbonizing Energy of the World Economic Forum based in Davos Switzerland. His research focuses on energy and environmental economics. He has published close to 150 academic papers, several energy economics textbooks and several hundred column papers in most influential Chinese newspapers. Boqiang Lin is the corresponding author and can be contacted at: bqlin@xmu.edu.cn
The paper is supported by Xiamen University – Newcastle University Joint Strategic Partnership Fund, the Grant for Collaborative Innovation Center for Energy Economics and Energy Policy (No: 1260-Z0210011), Xiamen University Flourish Plan Special Funding (No: 1260-Y07200), and the China Sustainable Energy Program (G-1506-23315).
Notes
Standard econometric theory shows that reverse causality is the main reason for simultaneity bias. However, the dynamic panel model has avoided reverse causality between CI and its factors (Zhou et al., 2013).
It includes mining and quarrying sectors, manufacturing sectors and electric power, gas and water production and supply sectors. Here, it does not include the building sub-industry.
In the neoclassical growth framework, there is a dichotomy between capital accumulation and TFP, which ignores technology progress embodied in capital goods. Hence, TFP measures exogenous, disembodied or Hicks-neutral technology progress. It does not influence the proportions in which capital and labor are combined. However, if there is learning by doing, then the contributions from capital accumulation and technology progress to growth are interdependent. In other words, technology progress, except for Hicks-neutral, can also be capital augmenting or embodied in capital goods.
Different from TFP calculated by Solow residual, MLPI measures the technology progress induced by all factors or the generalized technology progress. It includes the advancements from developing and using the latest technology (TECH, “hard” technology progress) and the allocation efficiency improvement (EFFCH, “soft” technology progress). Generally speaking, the former is regarded as the non-neutral technology progress, and the later is regarded as the neutral technology progress.
We perform basic diagnostics tests for FE models. For example, the Wooldridge test for autocorrelation, and the modified Wald statistic for group-wise heteroscedasticity. Hence, the FE models in Table I (Models 1, 3, 5, 7, 9, 11, 13 and 15) have considered the above possible issues. In other words, they are estimated by GLS methods.
Manufacture of raw chemical materials and chemical products, manufacture of non-metallic mineral products, smelting and pressing of ferrous metals, smelting and pressing of non-ferrous metals, processing of petroleum, coking and processing of nuclear fuel and production and supply of electric power and heat power.

