


Bioenergy is a key component of climate change mitigation strategies aiming at low stabilization. Its versatility and capacity to generate negative emissions when combined with carbon capture and storage add degrees of freedom to the timing of emission reductions. This paper aims to explore the robustness of a bioenergy-based mitigation strategy by addressing several dimensions of uncertainty on biomass potential, bioenergy use and induced land use change emissions.
Different mitigation scenarios were explored by two different energy-economy optimization models coupled to the same land use model, which provides a common basis for the second generation bioenergy dynamics in the two energy-economy models.
Using bioenergy is found to be a robust mitigation strategy as demonstrated by high biomass shares in primary energy demand in both models and in all mitigation scenarios.
A variety of possible storylines about future uses of biomass exist. The comparison of the technology choices preferred by the applied models helps understand how future emission reductions can be achieved under alternative storylines.
The presented comparison-based assessment goes beyond other comparison studies because both energy-economy models are coupled to the same land use model.
1. Introduction
This paper presents scenario analyses that explore the sensitivity of climate change mitigation strategies to the interaction between the land-use system and the economy-energy system. The results of our modelling exercise confirm that the use of bioenergy is a meaningful mitigation strategy. While this is in line with former studies (Luckow et al., 2010; Azar et al., 2010; Rose et al., 2014; Klein et al., 2014a; Kanudia et al., 2014), we additionally demonstrate that using bioenergy is a robust mitigation strategy independent of the availability of carbon capturing and storage (CCS) technologies. This robustness is demonstrated by high biomass shares, reflecting different possible uses, in different mitigation scenarios explored with two energy-economic models which are coupled to a land use model that provides estimates of the cost of biomass supply.
Different aspects of uncertainty are discussed in the literature regarding bioenergy as mitigation option:
uncertainty on bioenergy supply;
uncertainty on bioenergy use;
uncertainty on induced land use change emissions; and
uncertainty about impacts on food security.
Addressing all these uncertainties is a challenging task. While we analyse aspects regarding the uncertainty of biomass supply and land use emissions, the primary focus of this study lies on the uncertainty of bioenergy use in climate change mitigation scenarios. The major contribution of the study is a novel evaluation of bioenergy-related mitigation strategies, based on the coupling of two energy-economy models to the same land-use model, and the application of this modelling framework to compare the results from the two models in different scenarios. Coupling the energy models to the same land use model is an innovation that provides the advantage of reducing the range of uncertainties that other comparable comparison studies (Rose et al., 2014) are subjected to. Indeed, uncertainty of biomass supply and land use change emissions is similar in the two modelling frameworks, as they use the same land use model. This allows us to focus on uncertainties in bioenergy use and related transformation pathways in the energy system. Furthermore, it enabled us to discover properties of the relationship between carbon prices and bioenergy prices.
In previous studies, uncertainty in bioenergy supply is manifested in varying estimates on biomass potentials which mainly differ based on the assumptions regarding the future development of agricultural yields, the competing demand for food and feed, and for the land that is considered to be used for bioenergy crops (Beringer et al., 2011; Haberl et al., 2010; Lotze-Campen et al., 2010; Popp et al., 2014a). Based on a number of studies, Creutzig et al. (2015) and Klein et al. (2014b) provided some estimates of global bioenergy potentials. The former study estimated a sustainable technical potential between 100 and 300 EJ per year with medium agreement. The latter study quantified a range of 28-655 EJ/year in 2050 for energy-purpose-grown second-generation biomass. Biomass can be converted by different technologies into useable final energy. The choice of conversion and final use in the future bears uncertainty and depends on assumptions that models, as the ones used in this study, make about the techno-economic parameters of these technologies. Moreover, additional uncertainties arise when bioenergy conversion is linked to the CCS technology which is not yet mature and subject to public resistance (Knopf et al., 2010; Kanudia et al., 2014). Reduced emissions from using biomass for energy production may be counteracted by induced land use change emissions (Creutzig et al., 2015). Some studies even report increased greenhouse gas (GHG) emissions on a life cycle balance (Searchinger et al., 2008). The present study applies GHG pricing for forest land which significantly reduces the level of induced land use change emissions (Klein et al., 2014b; Humpenöder et al., 2014).
In Section 2 of the paper, uncertainty of biomass supply and bioenergy deployment is addressed in designing the scenarios. Two scenarios with different assumptions on the availability of biomass are considered. In a similar way, we confront a full technology scenario with a scenario that assumes CCS technologies to be unavailable implying a reduced demand on biomass. Uncertainty in bioenergy use that is not explicitly covered by the scenario design is addressed implicitly by the two different energy-economy models applied – REMIND and TIAM-WORLD – which propose different bioenergy uses reflecting the versatility of bioenergy. These models are introduced in Section 2 jointly with a brief presentation of the land use model MAgPIE and the respective coupling with each of the energy-economy models. In Section 3, a comparison study of the results obtained with the two energy-economic models addresses the climate policy-driven transformation of the energy system with a focus on differences in technology choice. The role of bioenergy, the relationship between carbon prices and bioenergy prices and the impact of mitigation strategies on the land use system are highlighted in Section 4. Conclusions are given in Section 5.
2. Model framework and scenario design
The analysis is based on a model framework that links the economy-energy system with the land-use system. In the present framework, the land-use system is represented by the MAgPIE model and the energy-economy system alternatively by the REMIND model and the TIAM-WORLD model. REMIND and TIAM-WORLD represent optimization models and are used with perfect foresight. As it is the case for all such optimization models and by assuming competitive markets, the analysis takes the view of a benevolent planner, perfectly informed and able to consider the longer-term consequences of decisions. Factors such as information asymmetries, market power influencing decisions and non-market preferences are not fully represented in the proposed applications. In that sense, the objective of the study is not to predict future strategies but to explore the potential of optimal energy-related decisions in complex interrelated systems to guide decision makers at the moment of defining energy policies.
Main differences between the two models are the macro-economic component, more detailed in REMIND than in TIAM-WORLD, and the higher level of technological details in TIAM-WORLD than in REMIND. This allows REMIND to better track capital and labour production factors, in addition to energy, and TIAM-WORLD to better track capital turnover and technology and fuel competition in the energy system. Moreover, both models consider different economic and technical assumptions, such as fossil fuel reserves (higher scarcity in REMIND than in TIAM-WORLD) and cost decline of renewable energy technologies (more rapid decline in REMIND compared to TIAM-WORLD). All else being equal, aggregate economic costs of mitigation would tend to be higher in models with a more detailed macro-economic representation, like REMIND, where feedbacks to the entire economy are more detailed. On the other hand, differences in techno-economic assumptions tend to make mitigation easier in REMIND. The comparison of the reference and mitigation scenarios explores these differences between the two models.
Figure 1 presents all three models with the major information to be exchanged between them. A soft-coupling approach is used in which the models are run separately, and the coupling is achieved by an iterative exchange of data between the models until the model results converge into a stable solution. Data are exchanged from the energy-economy models to MAgPIE with regard to the regional demand on second generation bioenergy and the prices of greenhouse gas (GHG) emissions. Bioenergy prices and emissions from the land use sector are returned from MAgPIE to TIAM-WORLD/REMIND. Details of the regional mapping between the models are provided in the Appendix.
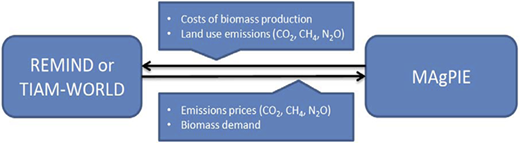
The operational implementation of the coupling was slightly different in both cases. For coupling REMIND and MAgPIE, which are managed at the same institute, the already existing coupling routines were used (Popp et al., 2011; Bauer et al., 2014; Klein et al., 2014a). TIAM-WORLD and MAgPIE are run by different institutes. New routines were written to define the exchange of data and the regional mapping between the two models. The transfer of data was based on a shared online interface. Moreover, preliminary to the iterative coupling, the supply curve of second-generation energy crops of TIAM-WORLD was calibrated to the MAgPIE model. The supply curve is represented by a step function where each step is characterized by a specific price.
2.1 REMIND
REMIND is a global, multi-regional, energy-economy-climate model (Leimbach et al., 2010) applied to long-term analyses of climate change mitigation (Bauer et al., 2012; Luderer et al., 2012). A detailed model description can be found at www.pik-potsdam.de/research/sustainable-solutions/models/remind. For this study, we applied the version REMIND 1.5.
The macro-economic core of REMIND is a Ramsey-type optimal growth model in which inter-temporal global welfare is maximized. The model computes a unique Pareto-optimal solution that corresponds to the market equilibrium in the absence of non-internalized externalities. The world is divided into 11 regions. Trade in final goods, primary energy carriers and, in the case of climate policy, emissions allowances is represented explicitly. Macro-economic production factors are capital, labour and final energy. The macro-economic core and the energy system module are hard-linked ensuring simultaneous equilibria on all energy and capital markets. Economic activity results in demand for final energy such as transport energy, electricity and non-electric energy for stationary end uses. Final energy demand is determined by a nested production function with constant elasticities of substitution. The energy system module accounts for endowments of exhaustible primary energy resources as well as renewable energy potentials. More than 50 technologies are available for the conversion of primary energy into secondary energy carriers as well as for the distribution of secondary energy carriers into final energy. Techno-economic parameters (investment costs, operation and maintenance costs, fuel costs, conversion efficiency, etc.) characterize each conversion technology. They essentially determine future technology choice and energy mix. The model accounts for CO2 emissions from fossil fuel combustion and land use as well as emissions of other GHGs. A reduced form climate module is used to translate emissions into changes in atmospheric GHG concentrations, radiative forcing and global mean temperature.
As part of the energy system, three types of bioenergy are modelled in REMIND:
small amounts of first-generation biomass coming from sugar, starch and oilseeds;
ligno-cellulosic residues from agriculture and forest; and
second-generation purpose-grown biomass from specialized ligno-cellulosic grassy and woody bioenergy crops, such as miscanthus, poplar and eucalyptus.
Biomass represents a very flexible primary energy carrier (similar to coal), as it can be converted into all types of secondary energy. REMIND also considers the possibility of combining several biomass conversion technologies with carbon capturing and sequestration.
2.2 TIAM-WORLD
The TIMES Integrated Assessment Model (TIAM-WORLD) is a technology-rich model of the entire energy/emission system of the world split into 16 regions, providing a detailed representation of the procurement, transformation, trade and consumption of a large number of energy forms (Loulou, 2008; Loulou and Labriet, 2008).
It computes an inter-temporal dynamic partial equilibrium on energy and emission markets based on the maximization of total surplus, defined as the sum of suppliers and consumers’ surpluses. In other words, the model finds optimal (cost-efficient) energy and technology mix to satisfy demands for energy services like lighting, cooking, heating, cooling of houses, kilometres driven by cars, trucks, tons of aluminum, cement to be produced, etc. Demands for energy services are specified by the user for the reference scenario and have each an own price elasticity. Each demand may vary endogenously in alternate scenarios in response to endogenous price changes, which accounts for a preponderant part of the price portion of the feedback effects from the economy to the energy system (Bataille, 2005).
The model contains detailed descriptions of more than 1,500 technologies and several hundreds of energy, emission and demand flows in each region, logically interconnected in a reference energy system. Such technological detail allows precise tracking of optimal capital turnover and provides a precise description of technology and fuel competition in the entire energy system. Technological learning is exogenous. The long-distance trade between the regions of TIAM-WORLD is endogenously modelled for coal, natural gas (gaseous or liquefied), crude oil, various refined petroleum products and biofuels. GHG emission trading is also possible.
TIAM-WORLD integrates a climate module for the modelling of global changes related to GHG concentrations, radiative forcing and temperature increase, based on the GHG emissions endogenously computed by the model. The model is set-up to explore the development of the World energy system until 2100. The model is calibrated to 2005 energy statistics of the International Energy Agency (IEA, 2013a, 2013b), augmented by more detailed data in several sectors.
2.3 MAgPIE
The global land-use model MAgPIE (Lotze-Campen et al., 2008; Popp et al., 2014b) is a recursive dynamic optimization model with a cost minimization objective function, which has been coupled to the grid-based dynamic vegetation model LPJmL (Bondeau et al., 2007). It takes regional economic conditions such as demand for agricultural commodities, level of agricultural technology and production costs as well as spatially explicit data (0.5 degree data aggregated to 200 clusters) on potential crop yields, land and water constraints (from LPJmL) into account and derives specific land use patterns, yields and total costs of agricultural production for each grid cell. Land use patterns are computed in MAgPIE based on specific soil, climate and CO2 conditions. For this study, we assume constant climate and CO2 conditions in all scenarios mainly due to the high uncertainty in CO2 fertilization effects. Furthermore, LPJmL computes potential irrigated and non-irrigated yields for each crop within each grid cell as an input for MAgPIE. In the case of pure rain-fed production, no additional water is required, but yields are generally lower than under irrigation. MAgPIE endogenously decides on the basis of minimizing the costs of agricultural production where to irrigate which crops. For this assessment, irrigation of bioenergy crops is restricted in MAgPIE aiming to avoid overexploitation of water resources (Bonsch et al., 2016).
The land use model minimizes total cost of production for a given amount of regional food and bioenergy demand. Regional food energy demand is defined for an exogenously given population in ten food energy categories. Bioenergy is supplied from specialized grassy and woody bioenergy crops, i.e. miscanthus, poplar and eucalyptus. All demand categories are estimated separately for ten world regions and have to be met by the world crop production. Additionally, the regions have to produce a certain share of their demand domestically to account for trade barriers (Schmitz et al., 2012).
Four categories of costs arise in the model: production costs for livestock and crop production, yield-increasing technological change (TC) costs, land conversion costs and intraregional transport costs. To increase total agricultural production, MAgPIE can either invest in yield-increasing TC or in land expansion. The endogenous implementation of TC is based on a surrogate measure for agricultural land use intensity (Dietrich et al., 2012). Investing in TC leads not only to yield increases but also to increases in agricultural land-use intensity, which in turn raises costs for further yield increases. The other alternative for MAgPIE to increase production is to expand cropland into non-agricultural land (Krause et al., 2013). Cropland expansion involves land conversion costs which account for the preparation of new land and basic infrastructure investments. Moreover, land expansion in MAgPIE is restricted by intraregional transport costs which accrue for every commodity unit as a function of the distance to intraregional markets and the quality of the infrastructure. Finally, MAgPIE incorporates non-CO2 emissions from agricultural production (Bodirsky et al., 2012) and CO2 emissions from land use change (Popp et al., 2012) that increase agricultural production costs if GHG emissions in the land system are getting priced. The model has the option to reduce agricultural non-CO2 emissions by improvements in management, based on marginal abatement costs of Lucas et al. (2007), and by avoiding land expansion into high carbon ecosystems such as tropical forests. The MAgPIE model has been validated intensively for land-use, agricultural yield, land carbon and water dynamics. Its ability to simulate and reproduce historical trends well has been demonstrated in previous studies (Popp et al., 2014a; Dietrich et al., 2014; Bonsch et al., 2015).
2.4 Harmonization of models and scenario design
Energy use, food demand, land-use change and related emissions are mainly driven by the growth of population and economic activity (Clarke et al., 2014). Assumptions of population and GDP growth corresponding to the newly developed Shared Socio-economic Pathways SSP2 scenario[1] have been used by all three models. Accordingly, global population increases from almost 7 billion people in 2010 to more than 9 billion in 2050 and stabilize thereafter. Global GDP, measured in constant US$2005 (market exchange rate), increases from US$50tn in 2010 to around US$150tn by 2050 and to around US$300tn by 2100. Harmonization regarding the key drivers allows the comparison analysis to focus on alternative baseline and climate policy pathways that result from model-specific dynamics of the global energy demand and supply system.
Table I shows the scenario design of the study, inspired by the work done for the Energy Modelling Forum (EMF27 study, http://emf.stanford.edu/). We focus on climate change mitigation scenarios that aim to keep total radiative forcing in 2,100 below 2.6 W/m2 and 3.7 W/m2, usually corresponding, respectively, to CO2 equivalent concentrations of 450 and 550 ppm[2]. The choice of two different climate targets is motivated by the objective of exploring challenges associated with different severity of climate target and the expected role of biomass in such mitigation strategies. We expanded the set of analysed scenarios by exploring transformation requirements and costs for pathways that cannot rely on CCS technologies in the case of a moderate climate target, and pathways with reduced biomass availability in the case of an ambitious climate target. Therewith, we cover supply and demand uncertainties due to a lack of technology availability, low potential of biomass and a low acceptance of these technology options by society.
Scenario design
| Scenario name | Climate target (radiative forcing in 2100) | Technology dimension | |
|---|---|---|---|
| Annual bioenergy potential | Availability of CCS technology | ||
| Reference | NA | 300 EJ | Yes |
| RCP2.6 | 2.6 W/m2 | 300 EJ | Yes |
| overshoot prior to 2100 possible | |||
| RCP2.6-lowbio | 2.6 W/m2 | 100 EJ | Yes |
| overshoot prior to 2100 possible | |||
| RCP3.7 | 3.7 W/m2 | 300 EJ | Yes |
| no overshoot | |||
| RCP3.7_noCCS | 3.7 W/m2 | 300 EJ | No |
| no overshoot | |||
3. Transformation of the energy system
3.1 Reference scenario
The comparison of the Reference case of REMIND and TIAM-WORLD helps understand the different possible characteristics of the future energy systems as proposed by different modelling frameworks. Assessment of the Reference case, and especially of the emissions, is also key to understand the mitigation challenges associated with future climate strategies, as mitigation efforts and cost in policy scenarios are always conditional upon the associated baseline (Clarke et al., 2014).
3.1.1 Primary energy, fossil fuel prices and emissions.
While the long-term trend of total primary energy consumption in the Reference case is similar in both models (Figure 2), differences in the composition of primary energy illustrate alternative future pathways. The share of coal is higher in the mid-term in REMIND than in TIAM-WORLD, while the opposite occurs in the long term in which coal is substituted by renewables in REMIND, mainly bioenergy, solar and wind. This transition pattern is motivated, first, by extraction costs for fossil energy carriers, which increase more rapidly in REMIND than in TIAM-WORLD due to assumed higher scarcity and, second, by the anticipation of a higher cost decline in the renewable energy technologies in REMIND compared to TIAM-WORLD. As a result, bioenergy, used mostly for transport, and wind and solar, used mostly in the power sector, penetrate to a larger extent in REMIND than in TIAM-WORLD, where in contrast, more coal is used in the long term to produce synthetic fuels for transportation and electricity. The development of primary energy consumption is also reflected in the dynamics of energy prices in both models. Starting from lower levels, fossil prices (measured in constant US$2005) increase much faster in REMIND than in TIAM-WORLD, indicating a higher scarcity and an increase of fossil resource extraction costs. Coal prices remain stable at a low level in TIAM-WORLD, whereas they increase between 2020 and 2100 from US$2/GJ to US$8/GJ in REMIND. Oil prices are similarly increasing in both models to reach around US$20/GJ in 2070, and continue to increase in REMIND up to more than US$25/GJ at the end of the century, while they stabilize at around US$20/GJ in TIAM-WORLD.
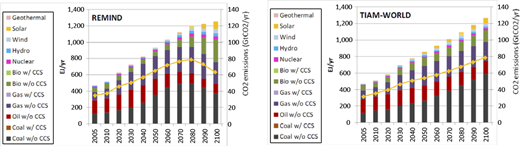
Primary energy and total CO2 emissions (yellow line) in the Reference case[3]
Primary energy and total CO2 emissions (yellow line) in the Reference case[3]
Due to the differences in primary energy consumption and coal consumption in particular, higher CO2 emissions in the mid-term are computed by REMIND (Figure 2). At the very end of the century, emissions in TIAM-WORLD are higher, while REMIND exhibits decreasing CO2 emissions (back to the level of 2050 by 2100) as the share of renewables increases. These emission trajectories yield forcing levels of 6 W/m2 (equivalent to RCP6.0) and 6.9 W/m2 in case of TIAM-WORLD and REMIND, respectively.
3.1.2 Power sector.
The power sector shows differences in both quantity and structure (Figure 3). Total electricity generation, and therefore the electrification of the economy, is higher in REMIND. The additional production is close to 50EJ (14,000 TWh) as of 2040. The dynamics of technology diffusion is quite distinct. Whereas in TIAM-WORLD, all technologies increase continuously, apart from gas technologies which peak around 2050, REMIND exhibits larger changes over small time periods with sequential expansion and reduction for a number of technologies (coal, gas, nuclear). A much higher share of gas for electricity generation is observed in REMIND compared to TIAM-WORLD in the mid-term, while renewables, in particular solar, penetrate more in REMIND than in TIAM-WORLD in the long term, substituting coal and gas. The larger amount of coal in electricity generation in REMIND in the mid-term and of renewables in the long term contribute to the differences observed in primary energy consumption (Figure 2). The development of investment costs for solar photovoltaic (SPV) technologies is a major driver for this transition. In REMIND, investment costs for SPV decrease from US$2,800/kWh in 2010 to around US$830/kWh in 2100. In TIAM-WORLD, a cost level of US$1,300/kWh is achieved by 2100.
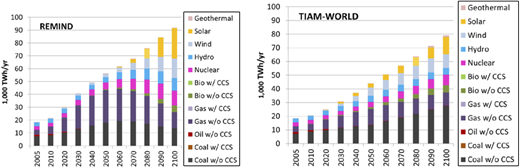
Electricity generation in the Reference case
Electricity generation in the Reference case
3.1.3 Final energy.
Final energy demand shows, correspondingly to the above-mentioned electrification trend, a higher and over time faster increasing share of electricity in REMIND compared to TIAM-WORLD (Figure 4). While TIAM-WORLD derives level and structure of final energy demand based on the characteristics of single technologies (cars, refrigerators, appliances, etc.), final energy demand in REMIND is driven by assumptions on efficiency improvements (differentiated across final energy types) and elasticity parameters between final energy types and between energy, capital and labour. Given the general high elasticities of substitution between electricity and non-electricity stationary energy like solids or heat, the more efficient energy type (electricity) is substituting less efficient final energy types. The implicit gap between assumed efficiency improvements of different final energy types is more pronounced in REMIND than the corresponding efficiency differences between different end use technologies in TIAM-WORLD.
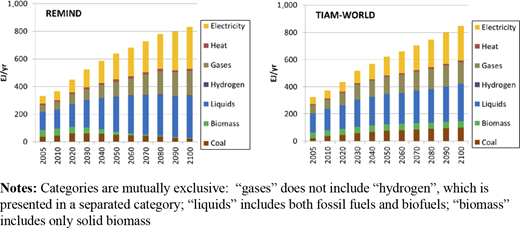
Final energy demand in the Reference case
Final energy demand in the Reference case
In the long run, REMIND does not only demonstrate a higher electricity share but also a higher liquid share, while TIAM-WORLD exhibits a higher share of solids (coal and biomass). Liquids consumption hides some other important differences: biofuels for transportation penetrate much more in REMIND than in TIAM-WORLD, triggering a huge gap in the long-term bioenergy demand. Synthetic fossil fuels (from coal) for transportation penetrate much more in TIAM-WORLD than in REMIND, contributing to differences in primary energy observed earlier.
3.1.4 Comparison with other common scenarios.
Baseline emissions of both models are close to the median of IPCC projections (Clarke et al., 2014, p. 427) with TIAM somewhat below the median in the first half of the century and REMIND with lower levels in the final two decades. The IPCC baseline scenarios represent a multitude of scenario runs reported in the literature. The median of these baseline projections (with default growth assumptions) exceeds 60 Gt CO2 in 2050 and increases slightly above 80 Gt CO2 by 2100. Comparison with the 6DS (business-as-usual) scenario proposed by the International Energy Agency (2014) shows the following: total primary energy supply of TIAM-WORLD in 2050 exhibits a composition similar to the 6DS scenario (IEA, 2014), the main difference being a slightly smaller oil consumption (−15 per cent). REMIND also proposes a smaller oil consumption as well as a smaller biomass consumption (around half) in 2050, but a higher coal consumption (+42 per cent), corresponding to the higher share of coal power plants in REMIND.
In summary, the two models propose two different future outlooks of the world in the case of no climate policy; one with more pronounced electrification and a market entry of renewable energy technologies and one with a moderate increase of the electricity share and a higher share of fossil fuels in primary energy. The resulting challenges for climate change mitigation scenarios are mixed. In REMIND, the mid-term increase of coal will impose higher mitigation efforts, whereas the penetration of renewables eases the long-term challenge. In TIAM-WORLD, the opposite applies. The overall impact on mitigation efforts depends on whether the mid- or long-term effect dominates the long-term temperature increase, and on the emission reduction requirements of the climate target in the intermediate time horizon.
3.2 Mitigation scenarios
The analysis of the climate policy scenarios focuses on the differences, either across scenarios or across models, illustrating the sensitivity of the energy system to two technological conditions: the availability of higher or lower bioenergy potential and of carbon capture and sequestration, both usually recognized as important pillars of emission abatement. By default, the analysis takes into account the differences in Reference scenarios, as mitigation efforts are conditional upon the associated baselines.
3.2.1 Mitigation under ambitious climate target (2.6 W/m2 forcing target).
Despite the differences in the Reference case, where higher penetration of renewable energy is obtained in REMIND than in TIAM-WORLD, the energy system follows quite similar qualitative and quantitative trends in both models for ambitious mitigation scenarios. To achieve a climate stabilization that corresponds to a radiative forcing target of 2.6 W/m2, a transformation of the global economy towards lower energy intensity and lower carbon intensity is required. Hence, a massive penetration of renewable energy (bioenergy as soon as 2040 and other forms of renewable energy a bit later) is presented by either model, even if the expectations on the future in the baseline were different. The two models respond with a similar change of primary and final energy consumption levels which in the long run are around 30 per cent (±10 per cent) below the corresponding levels in the Reference scenario. The renewable share in primary energy is more than 80 per cent at the end of the century in REMIND as well as TIAM-WORLD (Figure 5). Such similar results for primary energy across models are not surprising in scenarios with ambitious climate targets where all mitigation options are needed as soon as possible, making both long-term and transitional period similar across models. This also holds for the scenario with limited availability of biomass (RCP2.6_lowbio). Either model reduces the increase of primary energy consumption and compensates the missing biomass partly by higher solar use and in the mid-century also by a higher share of gas with CCS.
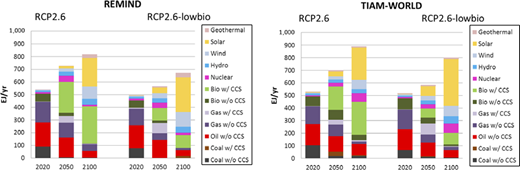
Primary energy consumption in RCP2.6 scenario and RCP2.6-lowbio scenario
Primary energy consumption in RCP2.6 scenario and RCP2.6-lowbio scenario
The power sector, which demonstrates some variance, is of particular interest due to the opportunity to generate negative emissions by the combination of CCS and biomass use (BECCS). While the electrification of the economy increases in both models, and solar technologies dominate in both models in the long run, the power sector proposed by REMIND relies more on wind than the one proposed by TIAM-WORLD, which relies more on nuclear and biomass plants (Figure 6). Notably, either model increases the electrification of the economy when a lower amount of biomass is available, with TIAM-WORLD demonstrating the more substantial increase. This increase of electricity use indicates that a limitation of biomass use may accelerate the transition from currently dominating types of energy use (solids, liquids) to more flexible ones (electricity). The share of electricity in final energy consumption increases to almost 70 per cent by 2100. Low-carbon electricity compensates for the reduced availability of bioenergy in end-use sectors (more details on bioenergy are provided in the next section). Electricity is generated by additional renewable and nuclear capacity in the RCP2.6-lowbio scenario in REMIND as well as TIAM-WORLD. In a similar way, gas with carbon capture and storage is used in either one as an intermediate technology option with a share of around 25 per cent in 2050.
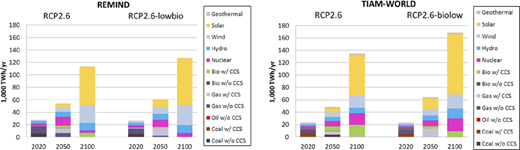
Electricity production in RCP2.6 scenario and RCP2.6-lowbio scenario
Electricity production in RCP2.6 scenario and RCP2.6-lowbio scenario
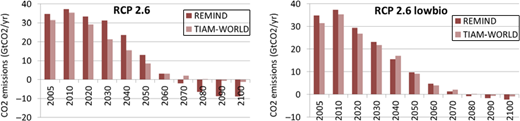
Earlier CO2 reduction is observed in TIAM-WORLD compared to REMIND when carbon capture and storage technologies are available. In return, higher long-term CO2 capture rates are observed in REMIND – partly based on higher assumed sequestration potential. The use of BECCS technologies even result in negative emissions in the long term (Figure 7). Anticipating the future potential of negative emissions, REMIND tends to delay emission reduction when CCS is available. As mitigation starts earlier in TIAM-WORLD, it is less dependent on CCS. Indeed, mitigation options other than CCS, which are not cost-efficient in REMIND appear to be cost-efficient in TIAM-WORLD, like the use of hydrogen produced by electrolysis and the gasification of biomass. These options, which result in less negative emissions in TIAM-WORLD compared to REMIND, provide a viable alternative strategy to BECCS and give additional flexibility to the energy system. When low bioenergy potentials are considered, provoking a reinforcement of the electrification of the economy, the share of fossil fuels, especially coal, needs to decline much faster than in the scenario with the full set of options available. An earlier and higher penetration of solar energy compensates for the lower biomass availability. However, the impact of the lower biomass availability on the early decarbonization of the energy system is more pronounced in REMIND than in TIAM-WORLD, due to the higher dependence of REMIND on BECCS when both carbon capture and high bioenergy potentials are available.
3.2.2 Mitigation under a moderate target (3.7 W/m2 forcing target).
The range of mitigation portfolio is usually wider in scenarios with less ambitious climate targets like the radiative forcing target of 3.7 W/m2. In this scenario, REMIND combines the use of biomass much earlier with carbon capture and sequestration (as of 2030) than TIAM-WORLD (Figure 8). In TIAM-WORLD, a large share of biomass is used without carbon capture over a long time span. Furthermore, lower primary energy consumption in TIAM-WORLD indicates that energy efficiency improvements provide a larger contribution to mitigation than in REMIND. In TIAM-WORLD, efficiency improvements are a low cost option that will be used already at a low level of mitigation. In REMIND, where energy is an input to the macroeconomic production function, each reduction in energy consumption reduces output. Hence, this option is intensively used only in ambitious mitigation scenarios. In the scenario without CCS (RCP3.7_noCCS), biomass is used nonetheless in both models without any substantial reduction in the overall volume of consumed biomass. Within TIAM-WORLD, it is partly gasified – substituting natural gas consumption which is reduced significantly in the long term compared to the scenario with CCS available. Furthermore, the more substantial reduction of oil use in REMIND compared to TIAM-WORLD indicates that a huge share of biomass in REMIND is also used for the production of liquid fuels.
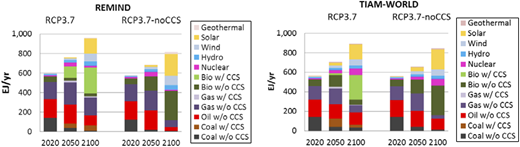
Primary energy consumption in RCP3.7 scenario and RCP3.7-noCCS
Primary energy consumption in RCP3.7 scenario and RCP3.7-noCCS
3.2.3 Carbon prices, signal for mitigation needs.
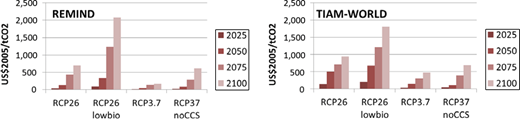
All mitigation scenarios result in a high carbon price in the long run, which is needed to accomplish the transition to a carbon-free energy supply system (Figure 9). In the RCP2.6 scenario, the carbon price increases to around US$900/tCO2 in TIAM-WORLD and around US$700/tCO2 in REMIND in 2100. Carbon prices increase by a factor of two and three in the low biomass scenario. As a general pattern, it can be observed that REMIND results in lower carbon prices in unconstrained scenarios, indicating less expensive low carbon technologies. However, REMIND responds with much stronger price reactions than TIAM-WORLD when CCS or biomass availability is limited. The low sensitivity of the carbon price with TIAM-WORLD in the RCP3.7 scenario when CCS is not available confirms the low dependence of TIAM-WORLD on CCS under moderate mitigation. In contrast, non-availability of CCS yields an increase of carbon prices by factor ten and more in ambitious mitigation scenarios (target below 3 W/m2) with either one of the models (not shown). These extremely high carbon prices indicate that the technological options to keep the climate system below the forcing target are almost exhausted. In this case, the carbon price acts as an indicator, but cannot be interpreted as a real-world quantitative number. The models consider the forcing target as a fixed bound, whereas in the real world, exceeding this bound slightly would cause additional but not infinite costs. Mitigation options still unknown at present may penetrate the market, stimulated by such a high CO2 price. Nevertheless, such high price also indicates that there is not much time left to accomplish the turnaround of the global CO2 emission path.
4. The role of bioenergy
4.1 Bioenergy use
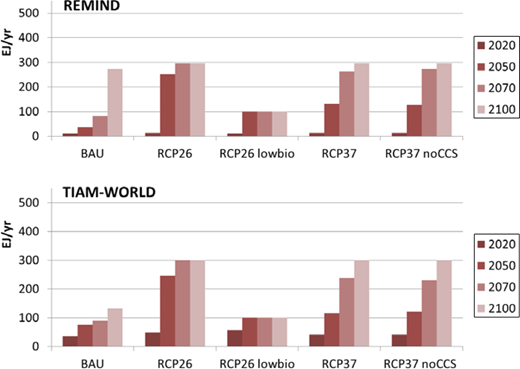
As indicated by the above analysis, the use of bioenergy is a key component of future mitigation strategies. Bioenergy is at the interface between the land-use and the energy system. Coupled to the energy systems of REMIND and TIAM-WORLD, the land-use model MAgPIE provides a common basis for the second generation bioenergy dynamics in both frameworks. Differences in the trajectories of biomass production, thus, indicate differences on the demand side, i.e. the energy systems. While the total amount of globally produced biomass differs over several decades across the models in mitigation scenarios, the available biomass potential of 300 and 100 EJ, respectively, is consumed entirely in all scenarios in the long run (Figure 10).
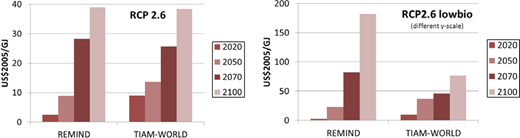
In REMIND as well as TIAM-WORLD, bioenergy prices stay below US$10/GJ in the Reference scenario, but increase substantially in the RCP2.6 policy scenarios (Figure 11). REMIND sets out with somewhat lower bioenergy prices (related to the use of residues in initial periods) and shows substantially higher prices compared to TIAM-WORLD in the end. The scenario with limited biomass potential demonstrates the most significant increase in price. In this scenario, the price amounts to around US$30 per GJ in 2050 in either model and exceeds US$70in 2100 for TIAM-WORLD and even US$170 for REMIND. These high prices of bioenergy in 2100 are due to the imposed bioenergy bound. Obtaining prices in this range in optimization models is not intended to represent a real result but rather to illustrate the pressure on bioenergy uses for mitigation purposes.
The rising bioenergy prices under climate policy in both models are a consequence of rising carbon prices: with increasing carbon prices, the incentive for replacing fossil fuels with bioenergy increases and so do potential revenues from BECCS-generated negative emissions. As Klein et al. (2014a, 2014b) have shown, generating negative emissions from biomass adds a carbon value to the energy value of biomass. Evaluation of the revenues gained from biomass conversion demonstrates that under stringent climate targets and in presence of BECCS, the value of negative emissions tends to dominate over the value of the energy produced. That means that the driving factor for building bioenergy conversion capacities are revenues from generating negative emissions rather than revenues from energy production.
Figure 12 demonstrates the strong correlation between bioenergy prices and carbon prices. The ratio between bioenergy prices and carbon prices differs across the two models, signalling different use of bioenergy. While the bioenergy prices between the two models are comparable in the RCP2.6 scenario, carbon prices are significantly lower in REMIND than in TIAM-WORLD. In REMIND, the sequestration potential is higher and therefore biomass technologies with CCS become competitive in REMIND at a slightly lower price as in TIAM-WORLD. The resulting higher potential of generating negative emissions contains the increase of the carbon price. Furthermore, REMIND uses bioenergy substantially in the transport sector, whereas in TIAM-WORLD, it is more efficient to use oil instead in this sector and keep biomass for other uses (gasification, electricity generation). But in this way, less carbon-intensive energy production is substituted, which leads to an increase of the carbon price in TIAM-WORLD. Within the RCP2.6-lowbio scenario, in contrast, we see more comparable carbon prices across the two models. The low biomass potential hinders the decarbonization of the transport sector in REMIND and the effective emission abatement by the generation of negative emissions. This results in a more drastic increase of the carbon price in REMIND than in TIAM-WORLD compared to the RCP2.6 scenario and drives also the rise of the bioenergy prices. With a more diversified use of biomass and other technologies (e.g. nuclear), TIAM-WORLD is confronted with lower long-term levels of carbon and bioenergy prices. Despite all these differences, we detect a surprisingly robust ratio between the bioenergy prices and the carbon prices for each model across different scenarios – around 1:12 for REMIND and 1:24 for TIAM-WORLD.
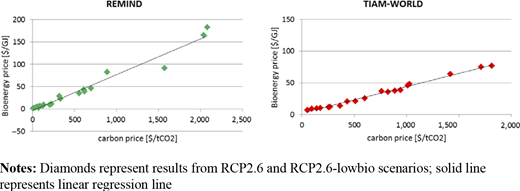
Correlation between bioenergy price and carbon price
Correlation between bioenergy price and carbon price
Bioenergy use is versatile across the two models and includes direct end-use, biorefineries (biofuels), electricity generation, gasification, hydrogen generation, with and without CCS (Figures 13). However, the preferred use of biomass differs. In REMIND, the transport sector consumes the major share of bioenergy. Biofuel production already plays an important role in the Reference scenario in REMIND and is extended and combined with CCS in the RCP2.6 scenario. In TIAM-WORLD, the use of biomass by biorefineries with CCS increases in the RCP2.6 scenario compared to the Reference case but remains much smaller than in REMIND. Indeed, gasification and direct uses (solids) mostly for heating purposes and industry are major uses of biomass in TIAM-WORLD. Moreover, electricity generation from biomass with CCS shows a higher penetration rate in TIAM-WORLD.
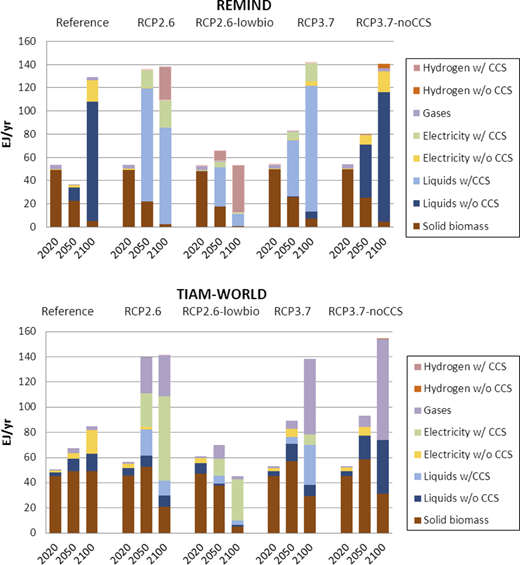
CCS is preferentially combined with biomass conversion technologies. Consequently, the amount of captured CO2 is reduced when a lower amount of biomass is available (scenario RCP2.6-lowbio). REMIND then gives priority to the production of hydrogen (with CCS) – mainly used in the transport sector. TIAM-WORLD prefers the direct uses of biomass in end-use sectors until the mid-century, and by the generation of electricity with CCS afterwards. Less hydrogen (REMIND) and less electricity (TIAM-WORLD) is produced from biomass with a less stringent climate target. The latter use of biomass completely disappears in the long term in TIAM-WORLD when CCS is not available.
4.2 Biomass supply and the transformation of the agricultural system
Ambitious climate targets will not only require a transformation of the energy system but also exert substantial pressure on agriculture via bioenergy demand and GHG prices. While some bioenergy can be provided from forestry products and agricultural residues (Creutzig et al., 2015), high bioenergy deployment in the energy system (Figure 10) can only be achieved with dedicated second generation bioenergy crops that will compete for scarce land resources. In MAgPIE, cultivation of bioenergy crops is not restricted to marginal land, but potentially possible on any land – with varying yields. It emerges as a robust scenario across models that bioenergy cropland requirements will be highest in the RCP2.6 scenario, reaching 550 to 600 Mha (Figure 14). This is more than 30 per cent of current total cropland of about 1,500 Mha (FAOSTAT, 2013) and may thus significantly increase the pressure on natural land ecosystems. In the Reference scenario (BAU), REMIND requests significantly more bioenergy than TIAM-WORLD leading to higher land requirements for bioenergy crops in 2100 (460 and 235 Mha, respectively). The additional challenges in the RCP2.6 scenario compared to BAU in terms of bioenergy cropland are therefore higher in MAgPIE-TIAM than in MAgPIE-REMIND. In the Reference scenario, the area of bioenergy crops increases steeply towards the end of the century in MAgPIE-REMIND (when biomass replaces the use of coal and oil). In contrast, in MAgPIE-TIAM, there is a continuing smooth increase towards a lower final level. A smooth increase also applies to MAgPIE-TIAM in the RCP2.6-lowbio scenario, while the large share of residues used by REMIND in this scenario decreases the long-term demand for additional bioenergy cropland in MAgPIE-REMIND.
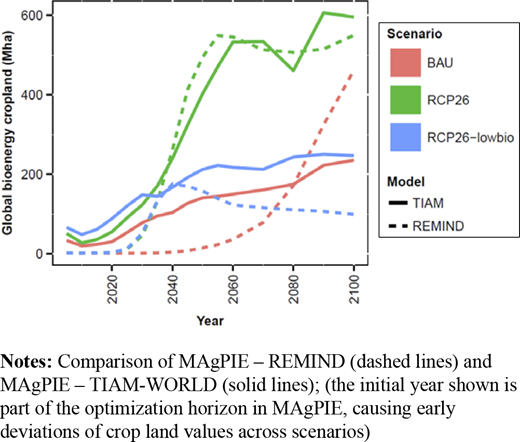
Bioenergy cropland for dedicated 2nd generation bioenergy crops
Bioenergy cropland for dedicated 2nd generation bioenergy crops
Apart from providing bioenergy as a low carbon energy carrier, agriculture can contribute to climate change mitigation by avoiding carbon emissions from land-use change. As forests are among the most carbon rich ecosystems, it is proposed to include emissions from deforestation into global emission pricing mechanisms as a cost effective mitigation option (Kindermann et al., 2008). Within our modelling frameworks, carbon prices (Figure 9) are therefore applied to emissions from deforestation, while land-use change emissions from conversion of pasture or other natural vegetation areas are not priced. Deforestation trends are very similar between the two model suites in the BAU scenario, leading to the loss of 270 Mha (MAgPIE-TIAM) to 310 Mha (MAgPIE-REMIND) of forest by 2100 (Figure 15). The introduction of a carbon price in the mitigation scenarios effectively stops deforestation even at low carbon prices, substituting land expansion with land intensification. This is consistent across the model suites and underpins the claim that forest conservation is a cost-effective mitigation measure. As it has been shown by Popp et al. (2011), reducing the land available for agricultural use by land demanding mitigation measures such as bioenergy and forest conservation could be partially compensated for by means of higher rates of technological change in agriculture.
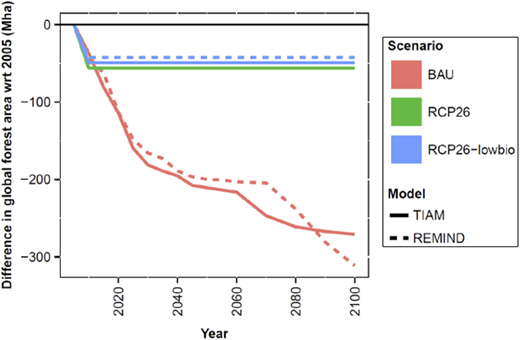
Trends of deforestation (forest area changes with respect to 2005) for three scenarios and the two model suites
Trends of deforestation (forest area changes with respect to 2005) for three scenarios and the two model suites
Despite a carbon price on emissions from deforestation, residual land use change emissions are due to leakage of emissions into non-forest natural land and pasture (Popp et al., 2014b). These land cover types can also store large amounts of carbon in vegetation and soils (Baccini et al., 2012). They are not protected by land-use policies that in this study cover only emissions from deforestation. In the mitigation scenarios, long-term carbon dioxide emissions from land-use change in the mitigation scenarios are very similar across the two model suites (Figure 16). However, land use change emissions until mid-century are higher in MAgPIE-REMIND than in MAgPIE-TIAM. This is due to the rapid increase of bioenergy demand in REMIND. This demand can only be met by land expansion into non-forest land with partly high carbon release. The more continuous increase of bioenergy demand in TIAM allows to expand energy crop land in a less carbon-intensive way and to benefit to a larger extent from technical progress (i.e. increasing hectare yields) in the land use sector. In the second half of the century, cumulative emissions from land use change decrease because of negative emissions due to the regrowth of natural vegetation on abandoned agricultural land. This process is more pronounced in MAgPIE-REMIND, so that cumulative emissions at the end of the century are virtually identical for the two model suites for the RCP2.6 (160 Gt CO2) and the RCP2.6-lowbio (80 Gt CO2) scenario. Moreover, non-CO2 emissions increase in the mitigation scenarios. Induced land competition by bioenergy crops requests intensification of agricultural production, which is associated with increasing N2O emissions from fertilizer application.
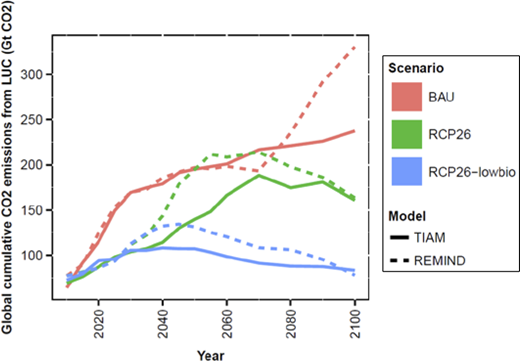
Global cumulative emissions from land-use change for three scenarios and the two model suites
Global cumulative emissions from land-use change for three scenarios and the two model suites
Our results suggest that residual land use change emissions can account for a share of 7-25 per cent of the global carbon budget that will likely keep global warming below 2°C (630-1,180 Gt CO2 by 2100; IPCC, 2014). This finding highlights that comprehensive land-based mitigation policies including all land use change emissions can significantly enhance the contribution of the land-use sector to climate change mitigation (Popp et al., 2014b). In summary, this analysis has shown that the transformation of the agricultural system required to achieve ambitious climate targets is robust across the two investigated model suites.
5. Conclusions
Bioenergy is a key component of climate change mitigation strategies aiming at low stabilization. Its versatility and capacity to generate negative emissions when combined with CCS offers the possibility to maintain emissions from fossil fuels in the energy system and add degrees of freedom to the timing of emission reductions. However, BECCS implies a strong reliance on the combination of two uncertain components – CCS and biomass potential. In low stabilization scenarios, the profitability of the short-term deployment of fossil fuels depends on the long-term availability of biomass and CCS. In these scenarios, power generation with CCS and liquid biofuels with CCS are major types of bioenergy use with alternate dominance between the two analysed models. When CCS is not available, biomass continues to play an important role in the energy system, but in other forms (gasification and production of biofuels without CCS). If the biomass potential is low, the electrification of the energy system based on other renewable energy carriers expands. In this case, preferred uses of biomass are the production of electricity with CCS, and the production of hydrogen with CCS, depending on whether competitive alternatives in the transport sector exist. Finally, use of biomass for power generation with CCS penetrates in scenarios with ambitious climate targets, but far less in scenarios with less ambitious targets, where liquid biofuels with CCS appear more competitive.
In climate change mitigation scenarios, the value of bioenergy is not only determined by its energy value but also by its carbon value, i.e. the potential of capturing carbon and generating negative emissions. Under stringent climate targets and in presence of BECCS, the carbon value tends to dominate over the value of the energy produced. That means that the driving factor for building bioenergy conversion capacities are the revenues from generating negative emissions rather than the revenues from energy production. There is a strong correlation between carbon prices and bioenergy prices. With increasing carbon prices, the incentive to replace fossil fuels with bioenergy triggers a demand pull that increases bioenergy prices.
The provision of bioenergy crops for energy production is one major contribution of the agricultural sector to reduce GHG emissions and mitigate climate change. But the agricultural system is a primary source of GHG emissions itself. Effective climate policy can help to reduce these emissions. This study demonstrated that only 30-50 per cent of the agricultural CO2 baseline emissions are generated under climate policy with GHG pricing. Simultaneously, such climate policy leads to effective forest protection. Triggered by carbon pricing, the forest area that is lost by the end of the century is significantly lower under climate policy compared to a Baseline scenario. Intensification of agricultural production ensures that even with additional land demand for bioenergy crop production less forest has to be converted. At the same time, residual emissions in the land-use sector still occur. Increasing intensity of agricultural production is associated with increasing N2O emissions from fertilizer application. In addition, one should keep in mind that trade-offs with food and water security of land demanding mitigation strategies such as biomass production could occur. Popp et al. (2011) demonstrated that especially a combination of large-scale bioenergy production and avoided deforestation programs as discussed in this study can lead to tremendous increases in food prices. Restricting irrigated bioenergy crop production indeed helps to decrease the pressure on freshwater ecosystems, but higher yields of potential irrigated bioenergy production can reduce the pressure on land and hence decrease food prices (Bonsch et al., 2016). Such food price dynamics would have different effects for producers and consumers and thereby could affect the whole economic system. But those impacts are not covered in the present model framework.
The comparison of the technology choices of REMIND and TIAM-WORLD helps understand how different storylines about the preferred uses of biomass are viable to reduce future emissions. One storyline, associated with REMIND, gives priority to the conversion of biomass into biofuels, electricity and hydrogen. Another storyline, associated with TIAM-WORLD, gives higher priority to biomass power generation and gasification, while hydrogen from electrolysis is produced from non-biomass renewable electricity. Both are realistic strategies and prove the importance of obtaining better knowledge of the technical and economic characteristics of biomass technologies, especially BECCS, to define the preferred transition to a low-carbon world. Provided that the real-world decision maker has only imperfect foresight, the importance of biomass technologies in the portfolio of future mitigation technologies can change into different directions. For example, limited anticipation of the potential for negative emissions may lower the share of BECCS technologies, while the ignorance on technological spillovers with major learning technologies (i.e. solar and wind) may increase the use of biomass technologies in particular in the electricity sector.
While the uncertainty of bioenergy demand is addressed by the combination of two different energy-economy models with the same land use model, a major caveat applies to the representation of the supply side uncertainty. Using bioenergy bounds is a common approach supported by the literature. However, it limits the meaning of the land use model as a supply counterpart of the energy systems’ bioenergy demand. Bioenergy prices at the end of the century are purely demand-driven. This is likely to have an impact on the use of bioenergy. It weakens comparability and demands for a more flexible representation of supply side uncertainty in future studies.
Notes
We applied scenario assumptions according with SSP version v5 from May 2012 (see https://secure.iiasa.ac.at/web-apps/ene/SspDb/dsd?Action=htmlpage&page=about).
The present definition of the climate target differs from that of the EMF27 study. The EMF 27 definition applies the A3NA forcing metric which excludes some gases with negative forcing.
Calibration of both models to different emission data sources (IEA energy balances for TIAM-WORLD, IEA and EDGAR database for REMIND) result in different initial values for CO2 emissions.
The research leading to these results has received funding from the EU Seventh Framework Programme under Grant Agreement No. 265170 (Project ERMITAGE – Enhancing Robustness and Model Integration for The Assessment of Global Environmental Change).
References
Further reading
Appendix. Regional mapping between REMIND, TIAM-WORLD and MAgPIE
Regional structures of REMIND, TIAM-WORLD and MAgPIE are different. For the spatial conversion between REMIND and MAgPIE regions, a one-to-one mapping is applied (Table AI). As REMIND has 11 regions and MAgPIE has 10, one region is not taken into account for the coupling, which is Japan (JPN). This was translated into the simplifying assumption in REMIND that there is no purpose grown bioenergy production in Japan, which is in line with the fact that Japan has very limited land resources for bioenergy production. Compared to an alternatively tested more complex mapping based on area and population weighted shares, the one-to-one region mapping provides a more robust implementation, even though this approach has the crucial shortcoming that some region mappings do not fit very well.
Region mapping between REMIND and MAgPIE
| REMIND regions | MAgPIE regions |
|---|---|
| EUR – EU27 | EUR – Europe |
| CHN – China | CPA – Centrally Planned Asia (including China) |
| IND – India | SAS – South Asia (including. India) |
| JPN – Japan | – |
| RUS – Russia | FSU – Former Soviet Union (excluding Baltic States) |
| USA – United States of America | NAM – North America |
| OAS – Other Asia | PAS – Pacific Asia |
| MEA – Middle East and North Africa and Asian Former Soviet Union | MEA – Middle East and North Africa |
| LAM – Latin America | LAM – Latin America |
| AFR – Sub-Saharan Africa (excluding South Africa) | AFR – Sub-Saharan Africa |
| ROW – Rest of the World (including Canada, Australia, New Zeeland, South Africa, Turkey, Non-EU Europe) | PAO – Pacific OECD including Japan, Australia, New Zeeland |
The region mapping between TIAM-WORLD and MAgPIE is based on the list of countries included in each region of the models (Table AII): prices obtained with MAgPIE for a certain region are applied to all regions of TIAM-WORLD associated to this region of MAgPIE; the sum of regional supplies obtained with TIAM-WORLD are used in the corresponding regions of MAgPIE. This mapping results in a consistent correspondence between the two models, the only important difference being North Africa, allocated to Africa in TIAM-WORLD and to Middle-East in MAgPIE. However, this difference has no impact on bioenergy analysis since North Africa is not expected to play an important role in bioenergy supply.
Region mapping between TIAM-WORLD and MAgPIE
| TIAM-WORLD regions | MAgPIE regions |
|---|---|
| EUR – Europe | EUR – Europe |
| CHI – China | CPA – Centrally Planned Asia |
| IND – India | SAS – South Asia |
| RUS – Russia CAC – Centralized Asia OEE – Other Eastern Europe | FSU – Former Soviet Union |
| USA – United States CAN – Canada | NAM – North America |
| ODA – Other Developing Asia SKO – South Korea | PAS – Pacific Asia |
| MEA – Middle East | MEA – Middle East and North Africa |
| CSA – Central and South America MEX – Mexico | LAM – Latin America |
| AFR – Africa | AFR – Sub-Saharan Africa |
| AUS – Australia JPN – Japan | PAO – Pacific OECD |

